Market Overview
| Study Period | 2018 - 2031 |
|---|---|
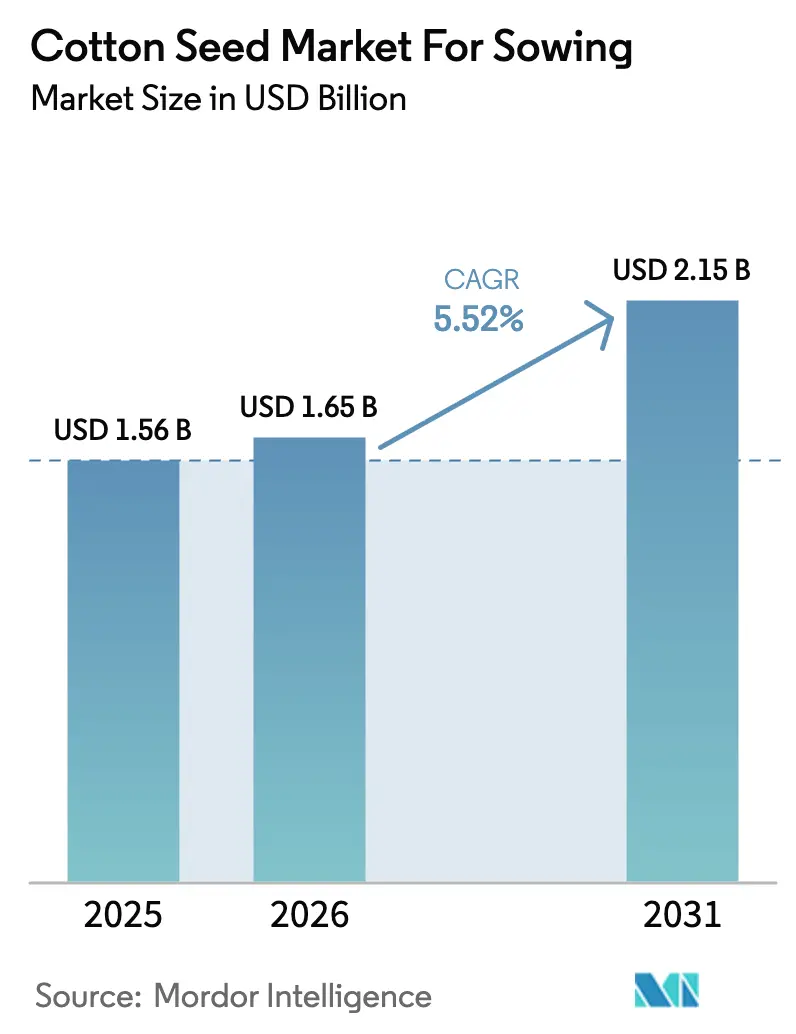
| Market Size (2026) | USD 1.65 Billion |
| Market Size (2031) | USD 2.15 Billion |
| Growth Rate (2026 - 2031) | 5.52% CAGR |
| Fastest Growing Market | Europe |
| Largest Market | Asia-Pacific |
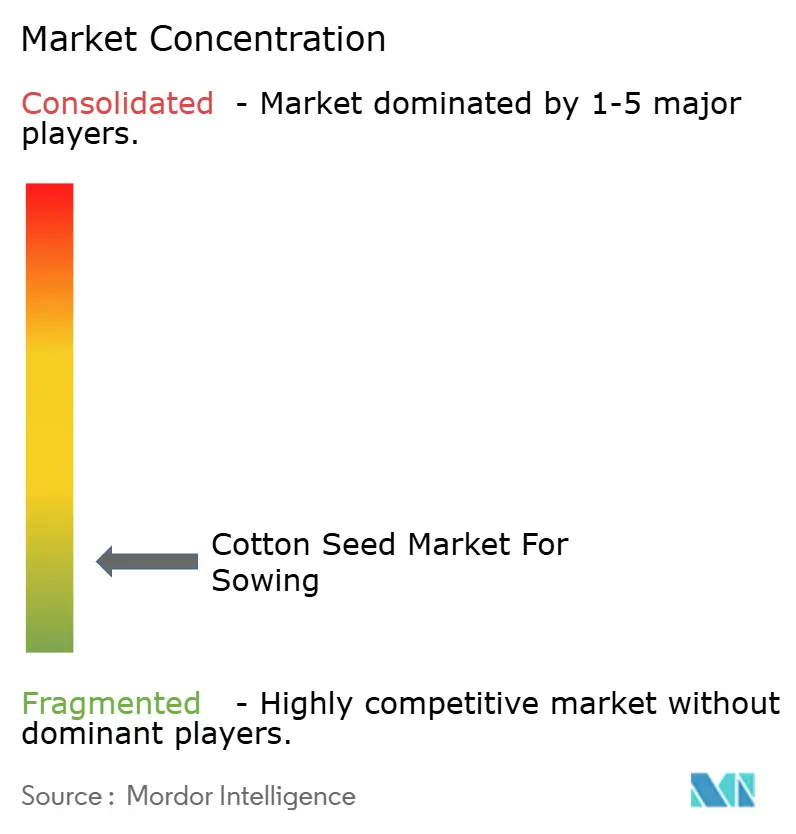
| Market Concentration | Low |
Major Players *Disclaimer: Major Players sorted in no particular order Image © Mordor Intelligence. Reuse requires attribution under CC BY 4.0. | |
Cotton Seed for Sowing Market Analysis by Mordor Intelligence
The cotton seed market size for sowing is expected to grow from USD 1.56 billion in 2025 to USD 1.65 billion in 2026 and is forecast to reach USD 2.15 billion by 2031 at 5.52% CAGR over 2026-2031. Strong demand for genetically modified (GM) and hybrid seeds, ongoing government subsidy programs, and expanding sustainability requirements from major textile brands are the primary forces underpinning growth. Parallel advances in (Clustered Regularly Interspaced Short Palindromic Repeats) CRISPR-edited germplasm, marker-assisted selection, and digital breeding platforms accelerate time-to-market for new traits that tackle pest resistance and climate variability. On the demand side, tighter fiber-quality specifications from premium textile manufacturers are steering breeders toward varieties that combine high yield and superior fiber length, strength, and micronaire values. Regulatory shifts, ranging from European GM cultivation bans to neonicotinoid treatment restrictions, continue to shape regional product portfolios, prompting strategic R&D investments in non-GM hybrids and integrated pest-management seed treatments.
Key Report Takeaways
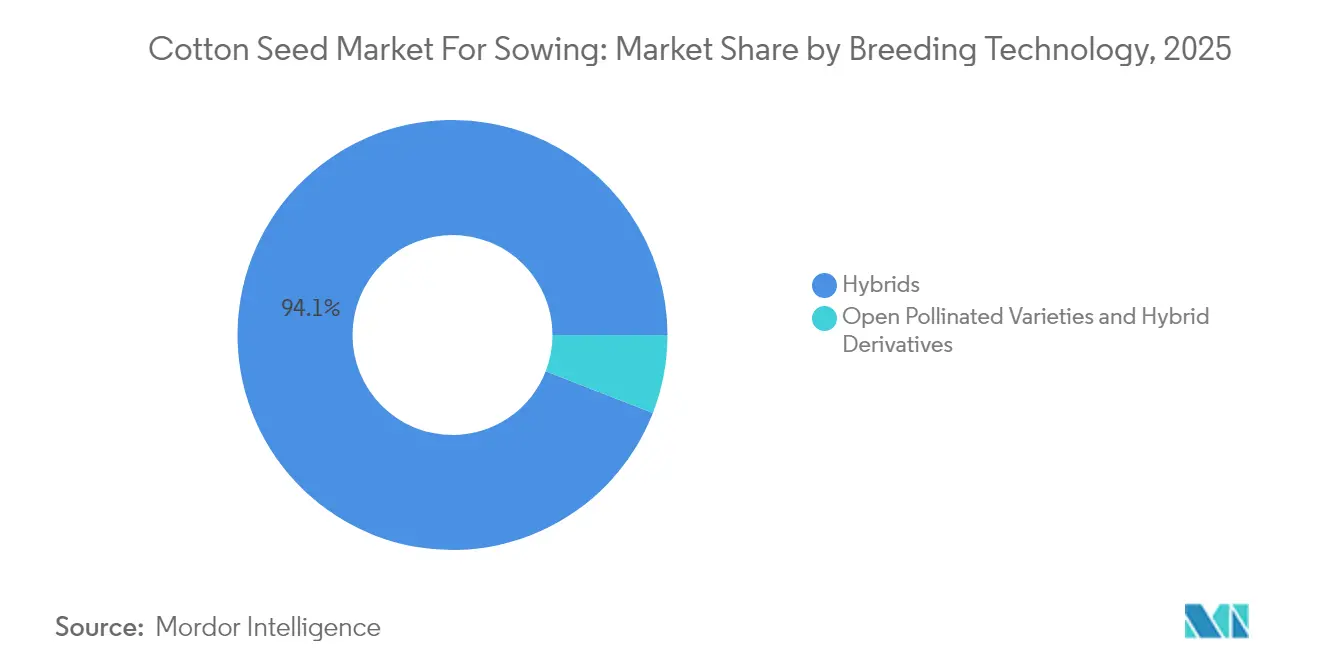
- By breeding technology, hybrids led with 94.10% of the Cotton Seed for Sowing Market share in 2025 and are forecast to grow at a 5.62% CAGR through 2031.
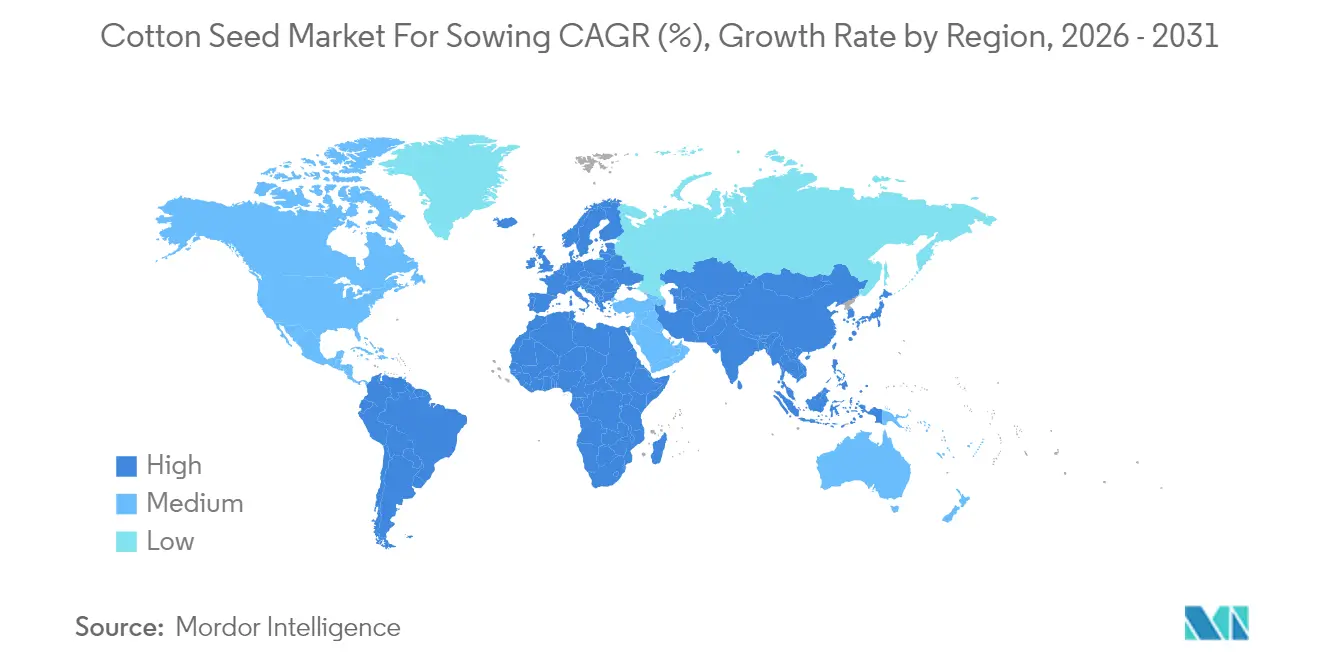
- By geography, Asia-Pacific commanded 74.20% of the Cotton Seed for Sowing Market share in 2025, while Europe is projected to register the fastest 9.82% CAGR between 2026-2031.
Note: Market size and forecast figures in this report are generated using Mordor Intelligence’s proprietary estimation framework, updated with the latest available data and insights as of 2026.
Global Cotton Seed for Sowing Market Trends and Insights
Drivers Impact Analysis*
| Driver | (~) % Impact on CAGR Forecast | Geographic Relevance | Impact Timeline |
|---|---|---|---|
| Expansion of genetically modified cotton adoption | +1.2% | Global, strongest in Asia-Pacific and South America | Medium term (2-4 years) |
| Government support programs and seed subsidies | +0.8% | Asia-Pacific, Africa, select South American markets | Short term (≤ 2 years) |
| Rising demand for high-yield, high-quality fiber | +0.9% | Global, with premium markets in North America and Europe | Long term (≥ 4 years) |
| Increasing seed replacement rates | +0.7% | Developed markets, expanding to emerging economies | Medium term (2-4 years) |
| Emergence of CRISPR-edited low-gossypol cottonseed | +0.6% | North America, Australia, select Asian markets | Long term (≥ 4 years) |
| Sustainable cotton certifications boosting non-GM hybrids | +0.5% | Europe, North America, and premium market segments globally | Medium term (2-4 years) |
| Source: Mordor Intelligence | |||
Expansion of Genetically Modified Cotton Adoption
GM cotton adoption climbed in global cotton area between 2020 and 2024, fueled by proven yield, input-cost, and pest-control advantages that outweigh higher seed prices for most commercial growers. Brazil illustrates the trajectory, reaching 98% GM penetration in 2024 after trait stacks addressing localized insect and herbicide resistance pressures became widely available[1]Source: Brazilian Ministry of Agriculture, “Cotton Production and Technology Adoption Report,” agricultura.gov.br. Producers also value reduced pesticide application, which supports sustainability mandates from global fashion brands and regulatory goals to lower chemical-crop-protection loads. Seed innovators respond by bundling insect-resistant and herbicide-tolerant genes with improved fiber-quality traits, a combination anticipated to unlock incremental premium pricing over the forecast period.
Government Support Programs and Seed Subsidies
Government interventions remain pivotal to cotton seed demand, where smallholder growers face liquidity constraints. India’s subsidy that covers a good share of certified-seed costs for small and marginal farmers has measurably accelerated hybrid uptake, while China links modernization grants with the adoption of high-quality seed and mechanization-ready varieties. Subsidy frameworks increasingly direct funds toward varieties aligned with climate-resilience or sustainability criteria, compelling suppliers to adapt breeding pipelines to meet policy-driven demand profiles. In the near term, such programs will bolster volumes and cultivate longer-term purchasing habits around annual seed replacement.
Rising Demand for High-Yield, High-Quality Fiber
Premium textile supply chains now stipulate tighter fiber-quality specifications, prompting breeders to synchronize gains in yield with enhanced length, strength, and micronaire metrics that command price premiums. Genomic-selection pipelines shorten development cycles for these balanced traits, delivering economic incentives that justify breeders’ elevated R&D spend and farmers’ higher seed budgets. As mill buyers enlarge differential pricing for premium bales, adoption of elite seed varieties is set to accelerate in North America, Europe, and export-oriented segments of the Asia-Pacific.
Increasing Seed Replacement Rates
Global seed-replacement rates climbed from 25% in 2020 to above 35% in 2024, reflecting deeper farmer awareness of hybrid vigor and certified-seed performance advantages[2]Source: FAO Agricultural Development Economics Division, “Seed Systems and Farmer Behavior Analysis,” fao.org. Extension services and mobile-based advisory platforms reinforce the benefits of fresh, trait-enhanced seed each season, particularly in Africa and South Asia. Rising credit access through micro-finance and ag-fintech solutions further reduces barriers, converting formerly saved-seed users into annual buyers and expanding the Cotton Seed for Sowing Market addressable base.
Restraints Impact Analysis*
| Restraint | (~) % Impact on CAGR Forecast | Geographic Relevance | Impact Timeline |
|---|---|---|---|
| Cotton price volatility is reducing farmers spending power | -0.6% | Global, most severe in price-sensitive developing markets | Short term (≤ 2 years) |
| Pink bollworm resistance eroding Bt value proposition | -0.8% | Asia-Pacific, spreading to other regions | Medium term (2-4 years) |
| Regulatory bans on GM cotton in parts of Europe | -0.4% | Europe, with spillover effects on global trade | Long term (≥ 4 years) |
| Tightening rules on neonicotinoid seed treatments | -0.3% | Europe, North America, and expanding globally | Medium term (2-4 years) |
| Source: Mordor Intelligence | |||
Cotton Price Volatility Reducing Farmer Spending Power
Futures prices oscillated in 2024, creating budgeting uncertainty that discourages investment in premium seed, especially among resource-constrained farmers in Asia and Africa. Lower price floors push growers toward cheaper open-pollinated varieties or seed reuse, directly shrinking revenue potential for high-tech seed vendors. While input credit programs mitigate impacts in some markets, volatility remains the single greatest near-term inhibitor to discretionary seed upgrades.
Pink Bollworm Resistance Eroding Bt Value Proposition
Confirmed pink bollworm resistance on more than one million hectares in India forces additional insecticide sprays, diminishing the economic case for Bt-only packages. Similar resistance signals are emerging in Pakistan and China, raising pest-management costs and regulatory scrutiny. Seed developers are racing to deploy three-gene stacks and complementary insect-control traits, but commercialization timelines extend beyond 2027, leaving a medium-term headwind for GM seed uptake.
*Our forecasts treat driver/restraint impacts as directional, not additive. The impact forecasts reflect baseline growth, mix effects, and variable interactions.
Segment Analysis
By Breeding Technology: Hybrids Sustain Innovation Leadership
Hybrids dominate with 94.10% of the Cotton Seed for Sowing Market share in 2025 and post the highest 5.62% CAGR outlook, underscoring their crucial role in bridging yield gaps and integrating trait platforms. Within hybrids, herbicide-tolerant and insect-resistant sub-segments command premium pricing and strengthen farm-level gross margins, particularly where labor shortages elevate the value of simplified weed- and pest-control regimes. Continuous R&D investment by multinationals and regional specialists alike accelerates hybrid trait stacking, thereby sustaining competitive differentiation and supporting robust royalty streams. Simultaneously, non-transgenic hybrids gain traction in Europe and niche organic markets where GM cultivation bans or certification requirements favor conventional breeding approaches.
Open-pollinated varieties and hybrid derivatives retain a residual presence in price-sensitive markets. Their share continues to erode as education initiatives highlight yield differentials and as micro-credit improves the affordability of hybrids. Low seed-multiplication costs and straightforward regulatory pathways keep open-pollinated options viable for small regional players targeting subsistence growers and informal-seed markets. Future competitiveness will depend on breeders’ ability to incorporate disease-tolerance traits through conventional selection, thereby narrowing the performance gap without escalating regulatory burdens.


Geography Analysis
Asia-Pacific retains leadership at 74.20% of the Cotton Seed for Sowing Market share in 2025, grounded in India’s millions of hectares of predominantly Bt-hybrid cultivation and China’s drive for machine-harvestable, fiber-quality-enhanced varieties. Government subsidy frameworks, proactive extension networks, and entrenched hybrid adoption underpin resilient demand despite commodity-price swings. Pakistan and Bangladesh expand certified-seed uptake under international development programs, while Australia’s high-input, high-yield system sustains robust turnover for premium GM seed.
Europe is the fastest-expanding geography with a projected 9.82% CAGR to 2031, catalyzed by Turkish and Spanish producers who leverage sustainable-cotton premiums in proximate European Union textile hubs. Non-GM hybrid breeders benefit from limited competition and stringent European Union approval processes that erect entry barriers for transgenic platforms. Uptake of Better Cotton Initiative and organic-certified seed further broadens addressable demand, compensating for the region’s comparatively modest cultivated area.
North America’s mature market features near-universal seed replacement and rapid adoption of next-generation trait stacks, providing stable cash flows for multinational suppliers. South America, led by Brazil, combines fast GM penetration with geographic expansion into savanna regions, driving double-digit annual volume growth and attracting aggressive facility investments. Africa represents a long-term growth frontier: infrastructural gaps and credit constraints temper immediate prospects, yet rising replacement rates and donor-backed extension services establish a foundation for accelerated adoption beyond 2027. The Middle East remains niche, constrained by water scarcity and limited arable land, though premium irrigated holdings in Egypt and Israel sustain steady demand for high-quality, machine-harvestable seed.

Competitive Landscape
The competitive arena for the Cotton Seed for Sowing Market is fragmented. The major players, including Bayer AG, Corteva Inc., Maharashtra Hybrid Seeds Co. (Mahyco), and Kaveri Seeds, collectively exceed recognizable sales, leveraging proprietary trait platforms and extensive retail networks. Europe’s strict GM rules create openings for mid-sized breeders specializing in high-quality non-GM hybrids, whereas India’s seed law cap on trait royalties allows dozens of domestic firms to coexist alongside multinationals. Competitive strategies center on stacking insect-resistance genes with herbicide tolerance, integrating drought-tolerance loci, and rolling out digital agronomy tools that lock seed customers into broader service ecosystems.
Strategic moves over the past 18 months signal sustained R&D investment. Corteva is committed to expanding South American cotton-breeding capacity, reflecting Brazil’s importance as a trait-testing and commercial launchpad. Bayer secured (United States Department of Agriculture) USDA clearance for a three-gene Bt variety addressing pink-bollworm resistance, while Syngenta’s Indian acquisition added locally adapted germplasm and last-mile distribution[3]Source: Bayer AG, “Annual Report 2024: Agricultural Solutions,” bayer.com. BASF’s biological-chemical seed treatment blends respond to tightening neonicotinoid regulations, illustrating how crop-protection shifts can create pull-through for bundled seed technology solutions.
Looking ahead, competition is anticipated to intensify around CRISPR-enabled non-transgenic trait delivery in jurisdictions with streamlined editing regulations. Firms with broad IP portfolios and in-house regulatory expertise will be best positioned to shorten commercialization timelines and capture early-mover premiums in climate-resilient and protein-meal cotton segments.
Cotton Seed for Sowing Industry Leaders
BASF SE
Bayer AG
Corteva Agriscience
Kaveri Seeds
Maharashtra Hybrid Seeds Co. (Mahyco)
- *Disclaimer: Major Players sorted in no particular order

Recent Industry Developments
- October 2025: More than 30 countries have approved genetically modified (GM) cotton cultivation, demonstrating the increasing adoption of biotechnology to address global challenges, including food security and climate change.
- January 2025: BASF introduced a cotton seed treatment that combines biological and chemical active ingredients for markets with neonicotinoid restrictions. The company expanded its FiberMax and Stoneville cotton seed portfolio to include 13 varieties.


Global Cotton Seed for Sowing Market Report Scope
Hybrids, Open Pollinated Varieties & Hybrid Derivatives are covered as segments by Breeding Technology. Africa, Asia-Pacific, Europe, Middle East, North America, South America are covered as segments by Region.Breeding Technology
| Hybrids | Non-Transgenic Hybrids | |
| Transgenic Hybrids | Herbicide Tolerant Hybrids | |
| Insect Resistant Hybrids | ||
| Open Pollinated Varieties and Hybrid Derivatives | ||
Geography
| Africa | By Breeding Technology | |
| By Country | Egypt | |
| Ethiopia | ||
| Ghana | ||
| Kenya | ||
| Nigeria | ||
| South Africa | ||
| Tanzania | ||
| Rest of Africa | ||
| Asia-Pacific | By Breeding Technology | |
| Australia | ||
| Bangladesh | ||
| China | ||
| India | ||
| Indonesia | ||
| Japan | ||
| Myanmar | ||
| Pakistan | ||
| Philippines | ||
| Thailand | ||
| Vietnam | ||
| Rest of Asia-Pacific | ||
| Europe | By Breeding Technology | |
| France | ||
| Russia | ||
| Spain | ||
| Turkey | ||
| Rest of Europe | ||
| Middle East | By Breeding Technology | |
| Iran | ||
| Rest of Middle East | ||
| North America | By Breeding Technology | |
| Mexico | ||
| United States | ||
| Rest of North America | ||
| South America | By Breeding Technology | |
| Argentina | ||
| Brazil | ||
| Rest of South America | ||
| Breeding Technology | Hybrids | Non-Transgenic Hybrids | |
| Transgenic Hybrids | Herbicide Tolerant Hybrids | ||
| Insect Resistant Hybrids | |||
| Open Pollinated Varieties and Hybrid Derivatives | |||
| Geography | Africa | By Breeding Technology | |
| By Country | Egypt | ||
| Ethiopia | |||
| Ghana | |||
| Kenya | |||
| Nigeria | |||
| South Africa | |||
| Tanzania | |||
| Rest of Africa | |||
| Asia-Pacific | By Breeding Technology | ||
| Australia | |||
| Bangladesh | |||
| China | |||
| India | |||
| Indonesia | |||
| Japan | |||
| Myanmar | |||
| Pakistan | |||
| Philippines | |||
| Thailand | |||
| Vietnam | |||
| Rest of Asia-Pacific | |||
| Europe | By Breeding Technology | ||
| France | |||
| Russia | |||
| Spain | |||
| Turkey | |||
| Rest of Europe | |||
| Middle East | By Breeding Technology | ||
| Iran | |||
| Rest of Middle East | |||
| North America | By Breeding Technology | ||
| Mexico | |||
| United States | |||
| Rest of North America | |||
| South America | By Breeding Technology | ||
| Argentina | |||
| Brazil | |||
| Rest of South America | |||


Market Definition
- Commercial Seed - For the purpose of this study, only commercial seeds have been included as part of the scope. Farm-saved Seeds, which are not commercially labeled are excluded from scope, even though a minor percentage of farm-saved seeds are exchanged commercially among farmers. The scope also excludes vegetatively reproduced crops and plant parts, which may be commercially sold in the market.
- Crop Acreage - While calculating the acreage under different crops, the Gross Cropped Area has been considered. Also known as Area Harvested, according to the Food & Agricultural Organization (FAO), this includes the total area cultivated under a particular crop across seasons.
- Seed Replacement Rate - Seed Replacement Rate is the percentage of area sown out of the total area of crop planted in the season by using certified/quality seeds other than the farm-saved seed.
- Protected Cultivation - The report defines protected cultivation as the process of growing crops in a controlled environment. This includes greenhouses, glasshouses, hydroponics, aeroponics, or any other cultivation system that protects the crop against any abiotic stress. However, cultivation in an open field using plastic mulch is excluded from this definition and is included under open field.
| Keyword | Definition |
|---|---|
| Row Crops | These are usually the field crops which include the different crop categories like grains & cereals, oilseeds, fiber crops like cotton, pulses, and forage crops. |
| Solanaceae | These are the family of flowering plants which includes tomato, chili, eggplants, and other crops. |
| Cucurbits | It represents a gourd family consisting of about 965 species in around 95 genera. The major crops considered for this study include Cucumber & Gherkin, Pumpkin and squash, and other crops. |
| Brassicas | It is a genus of plants in the cabbage and mustard family. It includes crops such as carrots, cabbage, cauliflower & broccoli. |
| Roots & Bulbs | The roots and bulbs segment includes onion, garlic, potato, and other crops. |
| Unclassified Vegetables | This segment in the report includes the crops which don’t belong to any of the above-mentioned categories. These include crops such as okra, asparagus, lettuce, peas, spinach, and others. |
| Hybrid Seed | It is the first generation of the seed produced by controlling cross-pollination and by combining two or more varieties, or species. |
| Transgenic Seed | It is a seed that is genetically modified to contain certain desirable input and/or output traits. |
| Non-Transgenic Seed | The seed produced through cross-pollination without any genetic modification. |
| Open-Pollinated Varieties & Hybrid Derivatives | Open-pollinated varieties produce seeds true to type as they cross-pollinate only with other plants of the same variety. |
| Other Solanaceae | The crops considered under other Solanaceae include bell peppers and other different peppers based on the locality of the respective countries. |
| Other Brassicaceae | The crops considered under other brassicas include radishes, turnips, Brussels sprouts, and kale. |
| Other Roots & Bulbs | The crops considered under other roots & bulbs include Sweet Potatoes and cassava. |
| Other Cucurbits | The crops considered under other cucurbits include gourds (bottle gourd, bitter gourd, ridge gourd, Snake gourd, and others). |
| Other Grains & Cereals | The crops considered under other grains & cereals include Barley, Buck Wheat, Canary Seed, Triticale, Oats, Millets, and Rye. |
| Other Fibre Crops | The crops considered under other fibers include Hemp, Jute, Agave fibers, Flax, Kenaf, Ramie, Abaca, Sisal, and Kapok. |
| Other Oilseeds | The crops considered under other oilseeds include Ground nut, Hempseed, Mustard seed, Castor seeds, safflower seeds, Sesame seeds, and Linseeds. |
| Other Forage Crops | The crops considered under other forages include Napier grass, Oat grass, White clover, Ryegrass, and Timothy. Other forage crops were considered based on the locality of the respective countries. |
| Pulses | Pigeon peas, Lentils, Broad and horse beans, Vetches, Chickpeas, Cowpeas, Lupins, and Bambara beans are the crops considered under pulses. |
| Other Unclassified Vegetables | The crops considered under other unclassified vegetables include Artichokes, Cassava Leaves, Leeks, Chicory, and String beans. |


Research Methodology
Mordor Intelligence follows a four-step methodology in all our reports.
- Step-1: IDENTIFY KEY VARIABLES: In order to build a robust forecasting methodology, the variables and factors identified in Step-1 are tested against available historical market numbers. Through an iterative process, the variables required for market forecast are set and the model is built on the basis of these variables.
- Step-2: Build a Market Model: Market-size estimations for the forecast years are in nominal terms. Inflation is not a part of the pricing, and the average selling price (ASP) is kept constant throughout the forecast period.
- Step-3: Validate and Finalize: In this important step, all market numbers, variables and analyst calls are validated through an extensive network of primary research experts from the market studied. The respondents are selected across levels and functions to generate a holistic picture of the market studied.
- Step-4: Research Outputs: Syndicated Reports, Custom Consulting Assignments, Databases, and Subscription Platforms


