United States Seasoning And Spices Market Size and Share
Market Overview
| Study Period | 2021 - 2031 |
|---|---|
| Forecast Data Period | 2026 - 2031 |
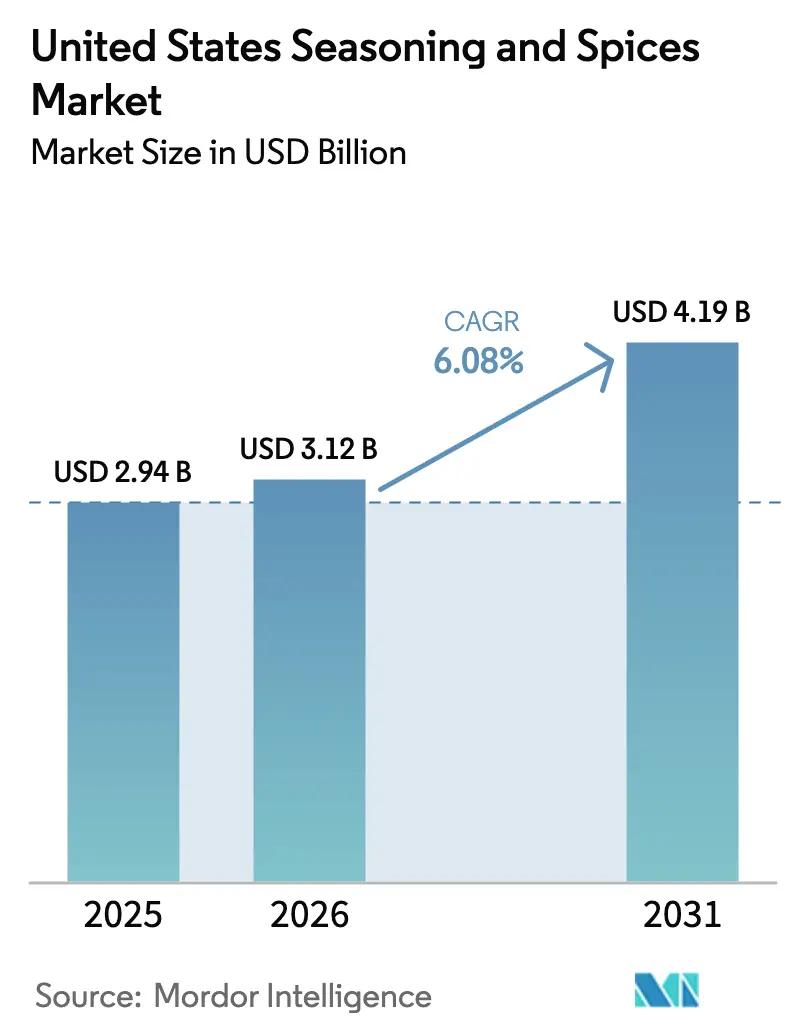
| Base Year Market Size (2025) | USD 2.94 Billion |
| Market Size (2026) | USD 3.12 Billion |
| Market Size (2031) | USD 4.19 Billion |
| Growth Rate (2026 - 2031) | 6.08% CAGR |
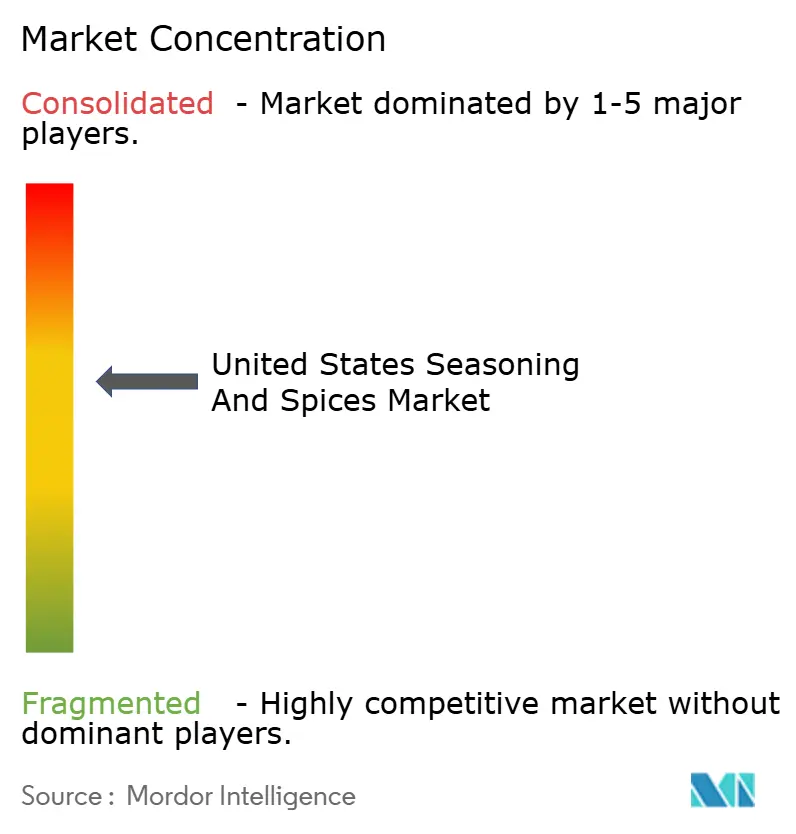
| Market Concentration | Medium |
Major Players *Disclaimer: Major Players sorted in no particular order Image © Mordor Intelligence. Reuse requires attribution under CC BY 4.0. | |
United States Seasoning And Spices Market Analysis by Mordor Intelligence
The United States seasonings and spices market size in 2026 is estimated at USD 3.12 billion, growing from 2025 value of USD 2.94 billion with 2031 projections showing USD 4.19 billion, growing at 6.08% CAGR over 2026-2031. This growth reflects changing American culinary preferences, driven by two key factors: health consciousness and convenience. Health-conscious consumers seek flavorful, low-calorie alternatives, while the increasing demand for ready-to-eat meals and packaged snacks requires industrial quantities of spices and seasonings. The market expansion is evident in both traditional applications, such as cinnamon bread and gingerbread cookies, and innovative products, including seasoned snack chips, flavored beverages, and specialty sauces. These trends indicate a significant shift from conventional seasoning uses toward more sophisticated flavor innovations that cater to evolving consumer preferences. The growing multicultural population in the United States has introduced diverse flavor profiles and ethnic seasonings into mainstream American cuisine. As consumers continue to prioritize health and convenience while exploring new flavors, the US spices and seasonings market is expected to maintain its robust growth trajectory in the coming years.
Key Report Takeaways
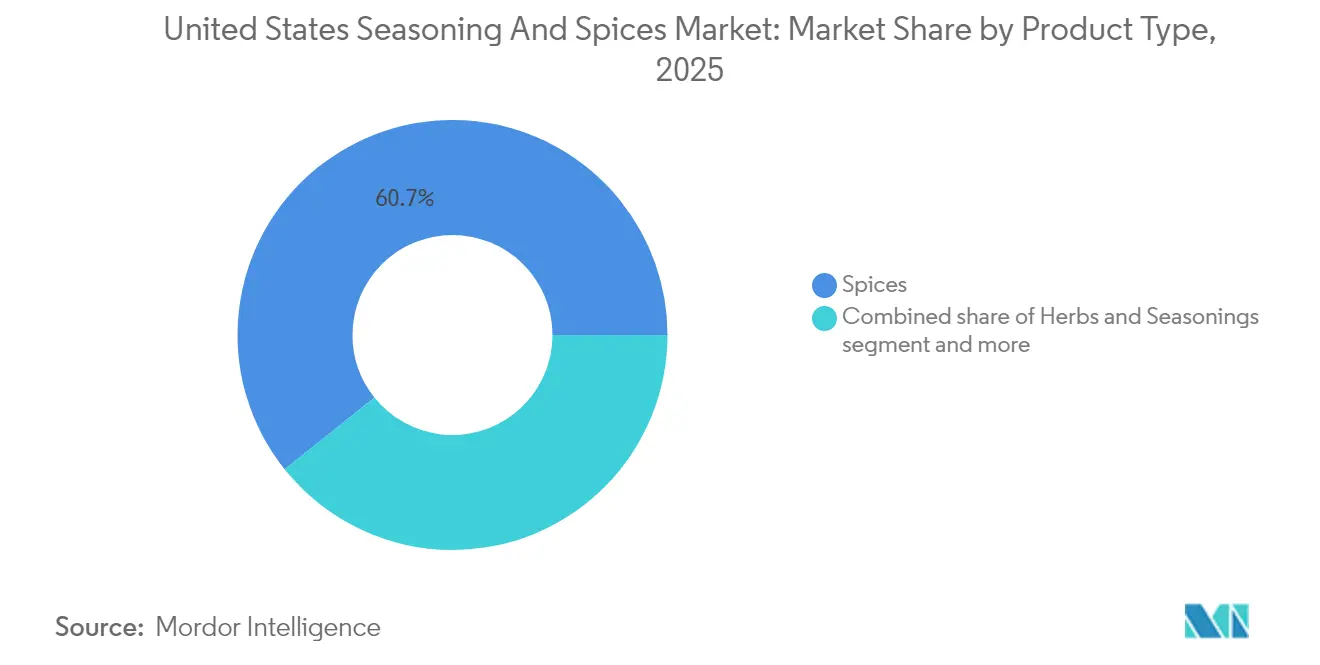
- By product type, spices led with 60.74% of the United States seasonings and spices market share in 2025, herbs and seasonings are projected to expand at a 7.28% CAGR through 2031.
- By category, conventional offerings accounted for 83.55% of the United States seasonings and spices market size in 2025, whereas organic products are set to post a 7.52% CAGR to 2031.
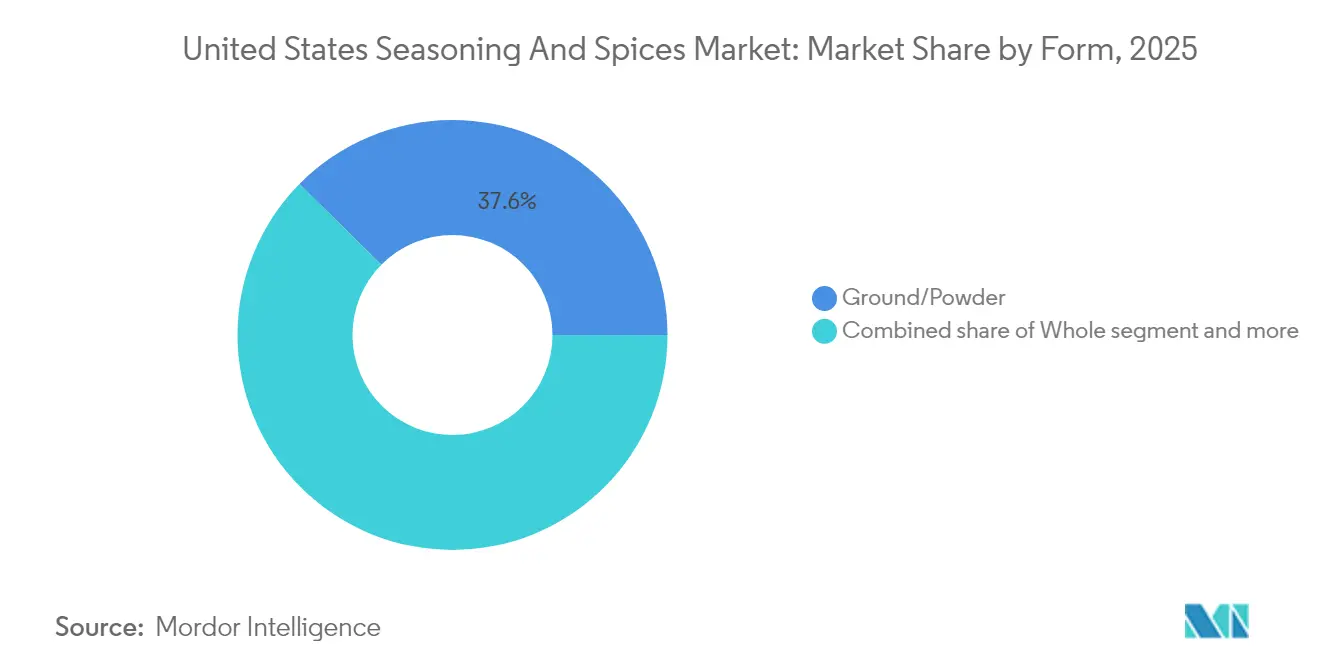
- By form, ground/powdered items held 37.61% of the United States' seasonings and spices market size in 2025 and are projected to advance at a 6.62% CAGR through 2031.
- By application, meat and seafood captured 27.02% of the United States seasonings and spices market share in 2025, and savory snacks represent the fastest-growing segment at 7.46% CAGR to 2031.
- By geography, the South commanded 33.05% of the United States seasonings and spices market share in 2025 and is forecast to grow at 6.55% CAGR through 2031.
Note: Market size and forecast figures in this report are generated using Mordor Intelligence’s proprietary estimation framework, updated with the latest available data and insights as of 2026.
United States Seasoning And Spices Market Trends and Insights
Drivers Impact Analysis*
| Driver | (~) % Impact on CAGR Forecast | Geographic Relevance | Impact Timeline |
|---|---|---|---|
| Rising processed food consumption increases seasoning and spices demand | +1.8% | National, with concentration in urban centers | Medium term (2-4 years) |
| Consumer preference shifts toward organic and clean-label spices | +1.2% | National, strongest in Northeast and West regions | Long term (≥ 4 years) |
| Health benefits of spices drive market growth | +1.0% | National, with emphasis on health-conscious demographics | Long term (≥ 4 years) |
| Growing ethnic food popularity strengthens spice demand | +1.5% | National, concentrated in metropolitan areas | Medium term (2-4 years) |
| Quick service restaurant expansion fuels spice market growth | +0.8% | National, with emphasis on South and West regions | Short term (≤ 2 years) |
| Processing and packaging innovations transform spice industry | +0.6% | National, driven by manufacturing hubs | Medium term (2-4 years) |
| Source: Mordor Intelligence | |||
Rising Processed Food Consumption Increases Seasoning and Spices Demand
Consumption patterns in the United States spices and seasonings market are evolving rapidly, driven by the increasing demand for processed foods. The market growth is primarily fueled by the rising consumption of ready-to-eat meals and frozen foods, particularly in urban areas where busy lifestyles necessitate convenient food options. Food processors are strategically using flavor differentiation through complex spice blends to maintain a competitive advantage. This demographic shift has prompted manufacturers to source region-specific spice varieties and develop specialized blends for various applications, including savory snacks, ready meals, and sauces. The market shows particular interest in complex flavor combinations featuring turmeric, coriander, and warm brown spices. According to the Observatory of Economic Complexity data, the United States imported USD 426 million worth of spices in 2024, ranking as the 561st most imported product among 1,227 categories [1]Source: Observatory of Economic Complexity Team, “US Spices Import Data,” oec.world. This trend creates premium pricing opportunities for specialized seasoning suppliers while sustaining the market's growth trajectory for both established players and new entrants.
Consumer Preference Shifts Toward Organic and Clean-Label Spices
Organic spices and seasonings in the United States market have evolved beyond traditional health considerations to address supply chain transparency and environmental sustainability. The clean-label trend has transformed the industry, with natural herbs and spices replacing synthetic flavor enhancers, driven by increasing consumer demand for transparency in food products. This shift has led manufacturers to expand their organic product portfolios, implement stricter quality control measures, and improve sourcing practices. Freeze-drying and other minimal-intervention techniques have emerged as preferred processing methods, preserving nutritional profiles while extending shelf life. Companies now provide detailed information about origin, processing methods, and sustainability initiatives to align with consumer preferences for minimally processed products without artificial additives. The market's growth is evidenced by the USDA's tracking of over USD 4 billion in organic imported goods in 2023, reflecting consumers' willingness to pay premium prices for certified organic and clean-label spices [2]Source: USDA, “Organic Imports Report 2023,” usda.gov. This transformation has prompted structural changes in spice procurement and certification processes across the industry.
Health Benefits of Spices Drive Market Growth
The spice market is expanding beyond traditional culinary uses into functional food and nutraceutical segments due to increasing consumer focus on preventive healthcare. Research from the National Library of Medicine confirms that spices such as cardamom, cinnamon, chili, fenugreek, garlic, ginger, nigella seeds, and turmeric help prevent and treat metabolic syndrome and related disorders when used in culinary quantities [3]Source: National Library of Medicine, “Therapeutic Roles of Culinary Spices,” nlm.nih.gov. The COVID-19 pandemic intensified consumer interest in immune-supporting ingredients, increasing the consumption of ginger, garlic, and black pepper. Different spices offer specific health benefits: cardamom, ginger, and turmeric aid in inflammation management; garlic, ginger, and turmeric support blood lipid control; and cinnamon, ginger, and fenugreek help regulate blood glucose levels. The recognition of spices as natural sources of beneficial compounds has created new opportunities in the dietary supplements and functional foods markets.
Growing Ethnic Food Popularity Strengthens Spice Demand
Ethnic cuisine mainstreaming in the United States drives sophisticated spice demand patterns, extending beyond traditional applications to fusion innovations and regional authenticity requirements. Mexican, Chinese, and Italian cuisines dominate consumer preferences, while Southeast Asian flavors emerge as significant influences, reflecting demographic diversification and travel-influenced taste preferences. Restaurant operators increasingly emphasize bold, global flavors and immersive food experiences, creating demand for premium spice blends that deliver restaurant-quality results in retail applications. The trend extends to street food influences, where gourmet interpretations of traditional ethnic preparations require specialized spice combinations that balance authenticity with American palate preferences. This market evolution favors spice suppliers with direct sourcing relationships and cultural expertise, as generic spice blends cannot deliver the complexity and authenticity that consumers now demand. The growing emphasis on authentic flavors and specialized blends continues to shape the U.S. spices and seasonings market, driving suppliers to expand their product portfolios and strengthen their sourcing capabilities.
Restraints Impact Analysis*
| Restraint | (~) % Impact on CAGR Forecast | Geographic Relevance | Impact Timeline |
|---|---|---|---|
| Raw material price fluctuations from climate change and supply chain disruptions | -1.4% | Global supply chains are affecting all United States regions | Short term (≤ 2 years) |
| Adulteration and quality concerns in unregulated markets | -0.8% | National, with emphasis on imported products | Medium term (2-4 years) |
| Premium pricing of organic and specialty spice products | -0.6% | National, concentrated in price-sensitive segments | Medium term (2-4 years) |
| Limited shelf Life of certain natural spices restricts growth | -0.4% | National, affecting fresh and minimally processed products | Long term (≥ 4 years) |
| Source: Mordor Intelligence | |||
Raw Material Price Fluctuations from Climate Change and Supply Chain Disruptions
The United States spices and seasonings market experiences significant challenges from raw material price volatility, primarily due to climate change and supply chain disruptions. Extreme weather events, including droughts, floods, and irregular rainfall patterns, affect crop yields and quality of spices such as black pepper, cardamom, and vanilla. Supply chain complications, including transportation delays, labor shortages, and geopolitical tensions, intensify price fluctuations. These factors compel manufacturers to increase inventory levels and modify procurement strategies, affecting their operational costs and profit margins. The seasonal nature of spice cultivation and harvesting creates periodic supply-demand imbalances, resulting in price variations throughout the year. The market's dependence on specific geographic regions for certain spices increases its vulnerability to regional climate events and local market conditions.
Adulteration And Quality Concerns In Unregulated Markets
Quality assurance challenges in the US seasonings and spices market stem from complex global supply chains and regulatory compliance risks that threaten market access and brand reputation. The FDA's increased monitoring of contaminants, particularly lead levels in spices like cinnamon through initiatives such as Closer to Zero, reflects the intensifying safety standards for processed foods, especially those intended for babies and young children. The high value of spices, combined with complex global sourcing networks, makes authenticity verification difficult and increases vulnerability to adulteration. This issue is compounded by inadequate quality control measures in developing regions, leading to contamination with foreign materials, artificial colors, and prohibited substances. Local vendors' attempts to maintain competitive pricing often result in compromised quality standards, while the lack of proper testing facilities and enforcement mechanisms in many sourcing regions further amplifies these concerns. These quality and authenticity issues erode consumer trust and significantly constrain the market's growth potential.
*Our forecasts treat driver/restraint impacts as directional, not additive. The impact forecasts reflect baseline growth, mix effects, and variable interactions.
Segment Analysis
By Product Type: Spices Dominate Through Innovation
Spices, while commanding a dominant 60.74% market share in 2025, face supply chain vulnerabilities due to climate-related production disruptions affecting key products like cardamom, cinnamon, and cloves. These challenges, combined with increasing health-conscious consumption patterns and evolving consumer preferences, create pressure on traditional spice segments to adapt through premium positioning, organic certification, and direct-trade sourcing relationships. The impact is particularly evident in pepper and chili products, where global consumption patterns remain strong despite supply uncertainties. Additionally, manufacturers must navigate production bottlenecks while maintaining quality standards to meet consistent market demand.
The traditional salt and salt substitutes segment experiences market constraints due to health-driven substitution trends and sodium reduction mandates, while herbs and seasonings (growing at 7.28% CAGR through 2031) gain momentum through innovation in convenience applications and health-positioned products. This shift reflects a broader market transformation where processing innovations and increasing consumer sophistication favor alternative seasoning solutions over conventional spice categories. The trend is further amplified by the growing demand for fresh and freeze-dried formats of herbs like thyme, basil, and oregano. Moreover, manufacturers are investing in research and development to create new formulations that address both taste preferences and health considerations.


By Category: Organic Gains Despite Premium Pricing
Conventional products dominate with an 83.55% market share in 2025, supported by established supply chains and cost advantages that maintain accessibility for price-sensitive consumers. This dominance is further reinforced by decades of infrastructure development and optimized distribution networks. While organic alternatives are growing at a 7.52% CAGR through 2031, their expansion faces supply constraints due to certification requirements and limited acreage availability, creating bottlenecks that prevent rapid scaling to meet demand growth. The certification process often requires a three-year transition period for farmland, which significantly impacts the pace of organic production expansion. Additionally, the limited availability of certified organic ingredients affects manufacturers' ability to develop new product lines.
Processing technology advances enable conventional producers to achieve quality attributes traditionally associated with organic products, including minimal processing and extended shelf life without synthetic preservatives. These technological improvements have significantly reduced the quality gap between conventional and organic products, particularly in preservation methods and processing techniques. This development, combined with clean-label positioning, creates a middle ground between conventional and organic categories, potentially impacting organic segment growth despite consumer willingness to pay sustainability premiums. The integration of advanced processing methods has also improved the nutritional retention in conventional products, making them more appealing to health-conscious consumers. Furthermore, the cost-effectiveness of these new technologies allows manufacturers to maintain competitive pricing while delivering enhanced product quality.
By Form: Ground Products Lead Through Efficiency
Ground and powdered spices dominate with 37.61% market share in 2025 and 6.62% growth through 2031, driven by operational advantages like extended shelf life, consistent dosing, and reduced storage requirements. However, these processed forms face challenges in maintaining authentic flavor profiles and volatile compounds during manufacturing, requiring significant investments in advanced technologies like freeze-drying, ultrasonic treatment, and low-temperature plasma processing to preserve product quality. The complexity of maintaining consistent quality across large-scale production batches further necessitates continuous monitoring and quality control measures throughout the processing chain.
While whole spices maintain appeal in premium segments, their higher costs and shorter shelf life limit widespread adoption. The food service sector's increasing automation demands standardized formats like liquid extracts and spray-dried powders, yet the transition to these forms requires substantial capital investment in processing equipment and packaging innovations. Additionally, manufacturers must balance processing efficiency with growing sustainability requirements, including the implementation of recyclable packaging solutions, which can impact production costs and market competitiveness. The integration of these sustainable practices often requires manufacturers to redesign their entire production and packaging processes, leading to temporary operational disruptions and increased short-term costs.
By Application: Savory Snacks Drive Growth
Meat and seafood applications dominate with a 27.02% market share in 2025, driven by established seasoning requirements and premium positioning opportunities, while savory snacks exhibit the highest growth rate at 7.46% CAGR through 2031. The protein segment benefits from health-conscious consumption patterns that prioritize flavor enhancement over caloric content, creating demand for concentrated spice solutions, while bakery and confectionery maintain consistent demand through seasonal offerings and premium products. This market dominance is further reinforced by the increasing consumer preference for authentic and traditional flavor profiles in protein-based products.
The market demonstrates segmentation across various applications, with soups, noodles, and pasta segments growing through convenience food demand and ethnic flavor integration, while sauces, salads, and dressings represent mature categories focusing on clean-label formulations and organic positioning. The ongoing snackification trend provides sustained opportunities for spice suppliers who can develop heat-stable formulations that preserve flavor integrity throughout extended shelf life periods. These diverse application segments create multiple growth avenues for manufacturers who can adapt their product offerings to meet specific category requirements and consumer preferences.
Geography Analysis
The South region commands a dominant 33.05% market share in 2025 and is projected to maintain a 6.55% growth rate through 2031. This leadership position stems from the region's demographic diversity, established cultural traditions, and expanding food service sector. The region's strong quick-service restaurant presence drives demand for specialized spice blends that combine operational efficiency with complex flavor profiles. Additionally, the South's climate advantages for domestic spice cultivation provide logistical benefits through reduced transportation costs and improved product freshness.
Each US region exhibits unique consumption patterns based on demographic composition and cultural preferences. The Northeast market gravitates toward organic and premium spice products, while the Midwest maintains focus on traditional applications and value-oriented offerings. The West region's health-conscious consumers and diverse ethnic population drive demand for specialty and authentic global spices. These regional variations manifest in USDA pricing data, which shows higher premiums for specialty products in metropolitan areas compared to value-focused rural markets.
The combination of demographic trends and established regional preferences reinforces the South's market leadership while creating targeted opportunities in other regions. The Northeast's premium positioning, the Midwest's value orientation, and the West's focus on health and authenticity present distinct market opportunities. Success in each region requires tailored product development and distribution strategies that align with local consumer preferences and purchasing behaviors.
Competitive Landscape
The United States spices and seasonings market exhibits moderate concentration, with established players like McCormick & Company Inc., Kerry Group plc, Sensient Technologies Corporation, Cargill Incorporated, and Olam Group, among others, maintaining market leadership through scale advantages. These major companies strengthen their competitive positions through vertical integration and geographic diversification strategies, which enhance supply chain management and maximize value throughout their distribution networks.
While large companies dominate the market, emerging brands effectively capture niche opportunities through innovation and specialization. The market offers significant opportunities in sustainable sourcing, clean-label products, and ethnic authenticity segments. Smaller players successfully compete against established brands in these areas by leveraging specialized expertise and direct-trade relationships - capabilities that larger companies find challenging to replicate at scale.
Manufacturers continuously launch new products to maintain market visibility. For instance, in August 2024, Fuchs North America introduced a limited-edition line of seasoning blends, including the Apple Lemon Dutch Baby Mix, Strawberry Basil Seasoning, and Brown Sugar Blend, demonstrating the industry's ongoing focus on product innovation and market expansion.
United States Seasoning And Spices Industry Leaders
McCormick & Company, Incorporated
Kerry Group PLC
Sensient Technologies Corporation
Cargill, Incorporated
Olam Group
- *Disclaimer: Major Players sorted in no particular order

Recent Industry Developments
- February 2025: Advent International acquired Sauer Brands, a manufacturer of condiments and seasonings, from Falfurrias Capital Partners. This acquisition expanded Advent International's presence in the food and beverage market.
- June 2024: Fuchs North America introduced a limited-edition line of seasoning blends, featuring Apple Lemon Dutch Baby Mix, Strawberry Basil Seasoning, and Brown Sugar Blend. These products align with current flavor trends and aim to enhance consumer taste preferences.
- April 2024: Kerry Group developed TasteSense Salt, a sodium reduction solution that delivers a salty and savory flavor without increasing sodium content. The product serves as an ingredient in processed foods.


United States Seasoning And Spices Market Report Scope
Seasonings and spices, whether used individually or in blends, play a crucial role in food preparation. When added during or after cooking, they not only enhance flavor and alter color but can also serve as preservatives. Their main purpose is to elevate the natural flavors of food without drastically changing its fundamental taste.
The United States seasoning and spices market is categorized by product type into salt and salt substitutes, herbs and seasonings, and spices. The herbs and seasonings category includes thyme, basil, oregano, parsley, mint, and others. The spices category encompasses pepper, sesame, cinnamon, mustard, onion, garlic, paprika, chili pepper, and more. The market is also divided by category into organic and conventional. Additionally, applications span bakery and confectionery, soups, noodles and pasta, meat and seafood, sauces, salads and dressings, savory snacks, and other uses.
Market sizing is presented in USD value terms for all segments mentioned above.
| Salt and Salt Substitutes | |
| Herbs and Seasonings | Thyme |
| Basil | |
| Oregano | |
| Parsley | |
| Mint | |
| Other Herbs | |
| Spices | Pepper |
| Cardamom | |
| Cinnamon | |
| Clove | |
| Nutmeg | |
| Chilli Pepper | |
| Sesame | |
| Turmeric | |
| Other Spices |
| Conventional |
| Organic |
| Whole |
| Ground/Powder |
| Other Forms |
| Bakery and Confectionery |
| Soups, Noodles, and Pasta |
| Meat and Seafood |
| Sauces, Salads, and Dressings |
| Savory Snacks |
| Other Applications |
| Northeast |
| Midwest |
| South |
| West |
| By Product Type | Salt and Salt Substitutes | |
| Herbs and Seasonings | Thyme | |
| Basil | ||
| Oregano | ||
| Parsley | ||
| Mint | ||
| Other Herbs | ||
| Spices | Pepper | |
| Cardamom | ||
| Cinnamon | ||
| Clove | ||
| Nutmeg | ||
| Chilli Pepper | ||
| Sesame | ||
| Turmeric | ||
| Other Spices | ||
| By Category | Conventional | |
| Organic | ||
| By Form | Whole | |
| Ground/Powder | ||
| Other Forms | ||
| By Application | Bakery and Confectionery | |
| Soups, Noodles, and Pasta | ||
| Meat and Seafood | ||
| Sauces, Salads, and Dressings | ||
| Savory Snacks | ||
| Other Applications | ||
| By Geography | Northeast | |
| Midwest | ||
| South | ||
| West | ||


Key Questions Answered in the Report
What is the current size of the United States seasonings and spices market?
The United States seasonings and spices market reached USD 3.12 billion in 2026 and is projected to hit USD 4.19 billion by 2031.
Which product type holds the largest share in the market?
Spices dominate with 60.74% share, supported by strong demand for turmeric, pepper, and chili blends.
Which segment is growing the fastest?
Savory snacks register the highest growth, advancing at a 7.46% CAGR through 2031 as consumers favor bold, globally inspired flavors.
How important is organic certification in this market?
While conventional products still command 83.55% share, certified-organic lines are expanding at a 7.52% CAGR, driven by clean-label demand and sustainability concerns.
Page last updated on:


