Market Overview
| Study Period | 2020 - 2031 |
|---|---|
| Forecast Data Period | 2026 - 2031 |
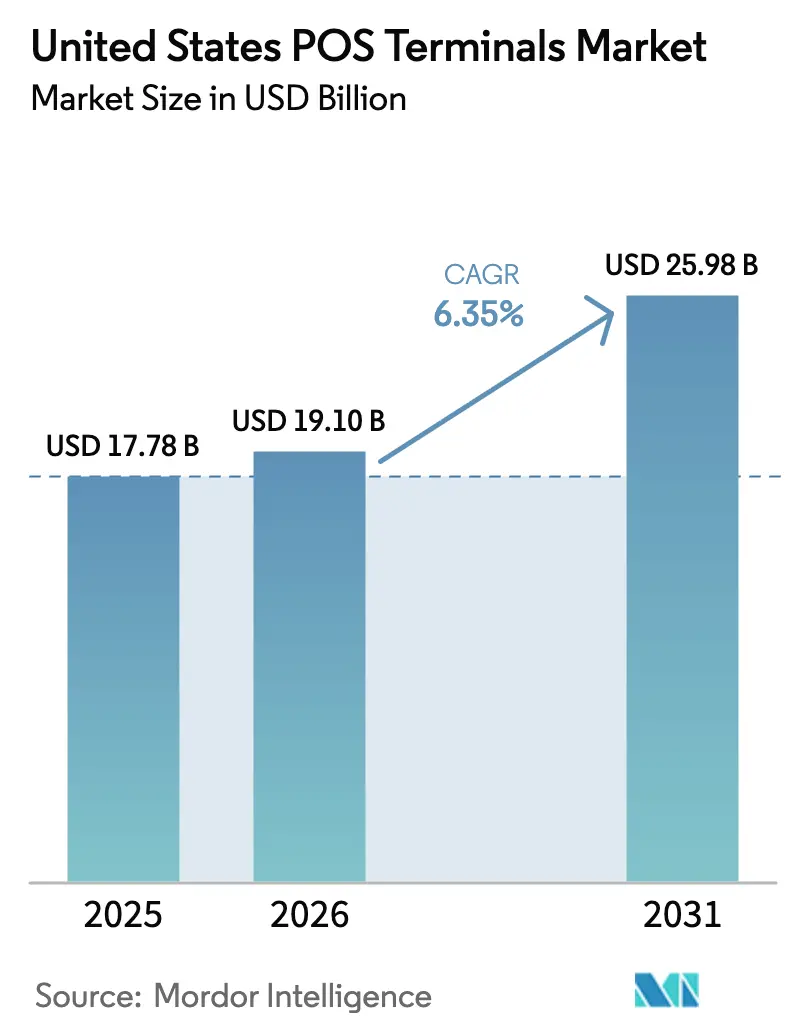
| Base Year Market Size (2025) | USD 17.78 Billion |
| Market Size (2026) | USD 19.10 Billion |
| Market Size (2031) | USD 25.98 Billion |
| Growth Rate (2026 - 2031) | 6.35% CAGR |
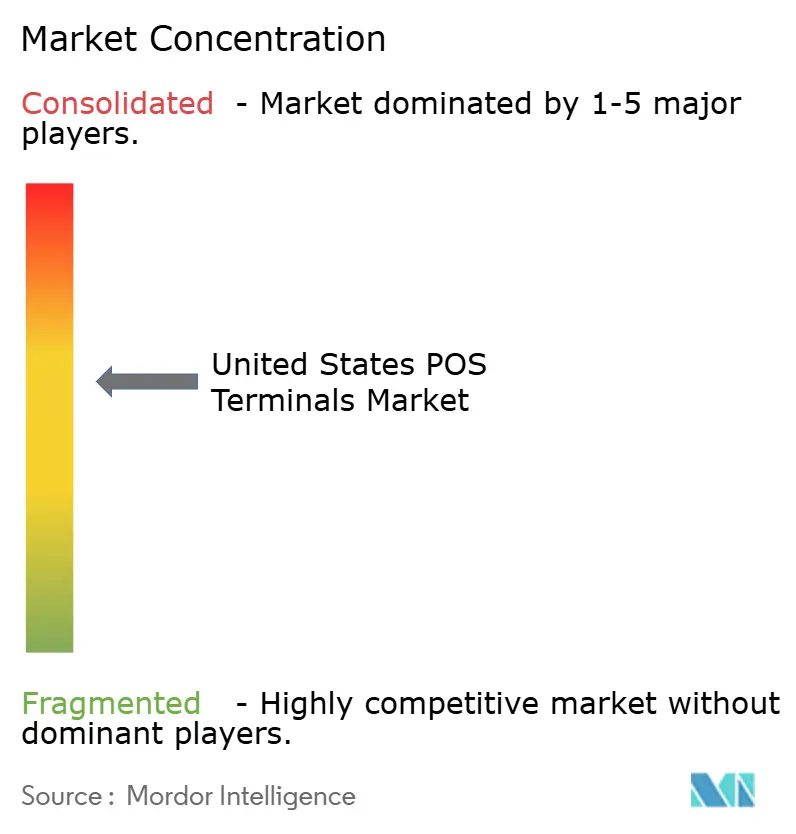
| Market Concentration | Medium |
Major Players *Disclaimer: Major Players sorted in no particular order Image © Mordor Intelligence. Reuse requires attribution under CC BY 4.0. | |
United States POS Terminals Market Analysis by Mordor Intelligence
The United States POS Terminals Market size is projected to be USD 17.78 billion in 2025, USD 19.10 billion in 2026, and reach USD 25.98 billion by 2031, growing at a CAGR of 6.35% from 2026 to 2031.
Three structural shifts are propelling this expansion: a nationwide hardware refresh triggered by PCI-DSS 4.0 enforcement, rapid enablement of FedNow-supported real-time payments, and the ascent of embedded-finance software vendors subsidizing hardware through processing fees. Merchant appetite for faster checkouts is pushing contactless acceptance into the mainstream, while cloud-native software stacks are shortening integration cycles and lowering total cost of ownership for small businesses. At the same time, cybersecurity requirements are raising baseline hardware specifications, tilting competitive advantage toward manufacturers with in-house software engineering. Together, these forces are redefining pricing models, shortening device life cycles, and widening the gap between scale providers and niche specialists within the United States POS terminals market.
Key Report Takeaways
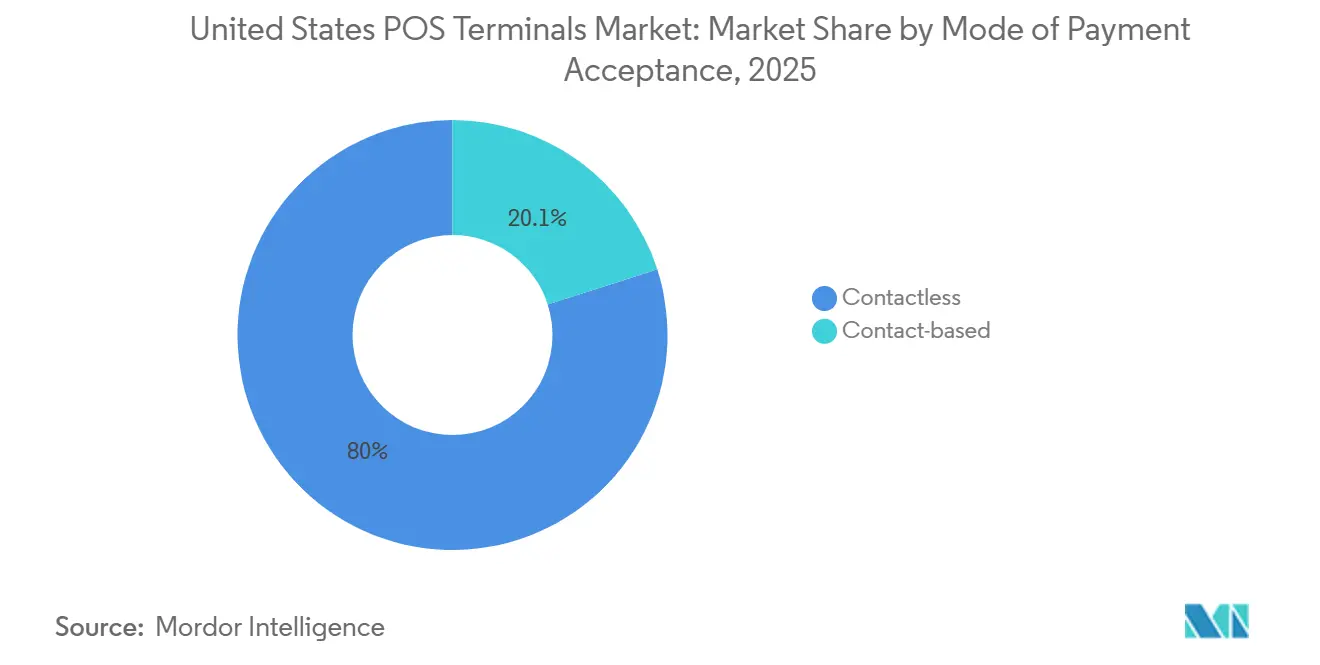
- By mode of payment acceptance, contactless terminals led with 79.95% of the United States POS terminals market share in 2025 and are projected to expand at an 8.42% CAGR through 2031.
- By POS type, fixed systems captured 64.52% of the United States POS terminals market size in 2025, and the Mobile and portable systems segment is forecast to advance at a 9.38% CAGR through 2031.
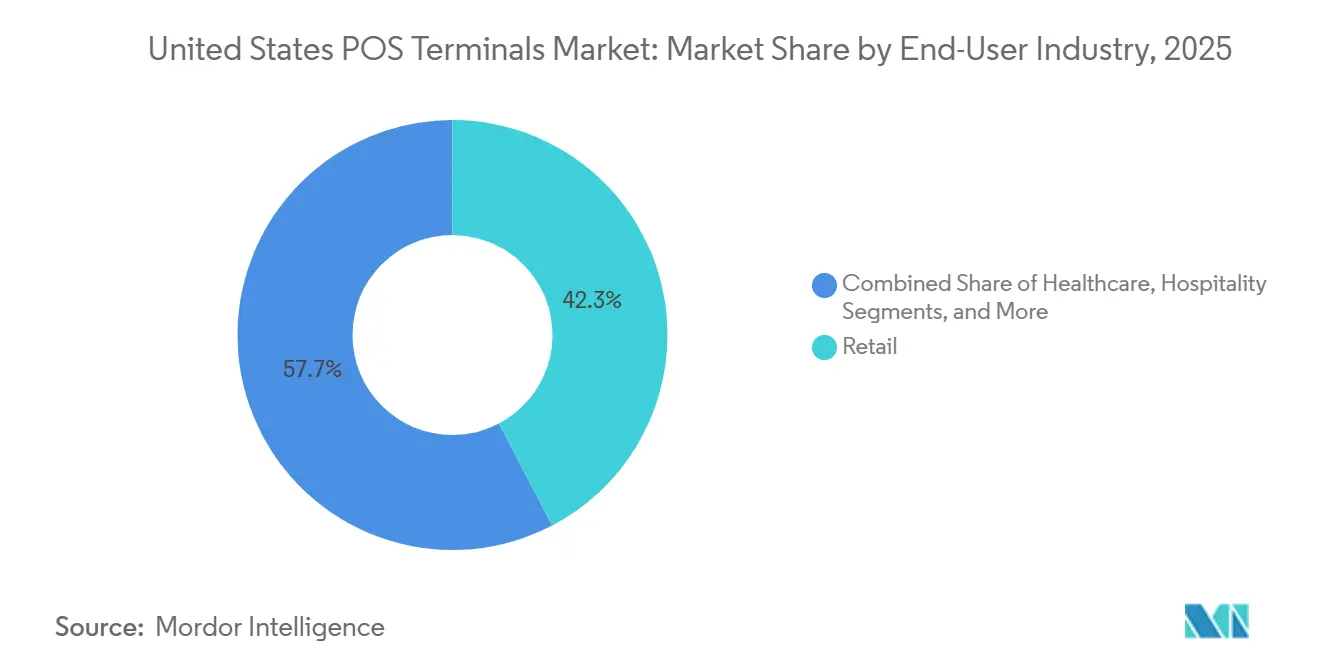
- By end-user industry, retail end-users accounted for 42.32% of the 2025 demand within the United States POS terminals market. Healthcare end-users are expected to grow at an 8.22% CAGR through 2031.
Note: Market size and forecast figures in this report are generated using Mordor Intelligence’s proprietary estimation framework, updated with the latest available data and insights as of 2026.
United States POS Terminals Market Trends and Insights
Drivers Impact Analysis*
| Driver | (~) % Impact on CAGR Forecast | Geographic Relevance | Impact Timeline |
|---|---|---|---|
| Rapid EMV and NFC Terminal Upgrade Cycle | +2.1% | National, concentrated in high-transaction metro areas | Short term (≤ 2 years) |
| SME Shift to Cloud-Based mPOS Solutions | +1.8% | National, accelerated uptake in service and hospitality sectors | Medium term (2-4 years) |
| Retailer Demand for Unified Commerce Analytics | +1.5% | National, led by omnichannel retailers in urban and suburban markets | Medium term (2-4 years) |
| PCI-DSS 4.0 Compliance Driving Hardware Refresh | +1.4% | National, affecting all merchant categories | Short term (≤ 2 years) |
| Surge in Real-Time Payment and Wallet Acceptance at POS | +1.2% | National, early concentration in financial hubs and tech-forward metros | Medium term (2-4 years) |
| Embedded-Finance ISVs Bundling Terminals with SaaS | +0.9% | National, vertical-specific adoption in healthcare, hospitality, professional services | Long term (≥ 4 years) |
| Source: Mordor Intelligence | |||
Rapid EMV and NFC Terminal Upgrade Cycle
Liability-shift rules and network mandates have pushed merchants to replace magnetic-stripe fallback devices with dual-interface terminals. By late 2025, 92% of in-store endpoints accepted tap-to-pay, up from 78% two years earlier. Faster transaction times and acquirer incentives accelerated upgrades among grocery, transit, and quick-service chains. The Payment Card Industry Security Standards Council now requires new certifications to include secure key injection and NFC, effectively ending the commercial life of non-contactless models.[1]Payment Card Industry Security Standards Council, “PCI DSS Version 4.0,” pcisecuritystandards.org Smaller rural merchants lag, yet processor-funded subsidies tied to multi-year contracts are closing the gap. As mobile wallet interoperability improves, contactless share is positioned to exceed 40% of in-person payments by 2027.
SME Shift to Cloud-Based mPOS Solutions
Mobile-first platforms that pair tablets with Bluetooth readers eliminate the USD 1,500 up-front cost of traditional workstations, replacing it with software subscriptions ranging from USD 50 to USD 150 per month. Embedded inventory, staffing, and loyalty modules reduce the need for separate back-office tools, giving small operators enterprise-grade analytics. Same-day settlement mitigates working-capital pinch points cited by 38% of service-sector firms in the 2024 Small Business Credit Survey.[2]Federal Reserve, “Small Business Credit Survey,” frbservices.org Portability supports sales at pop-ups and field locations, while device-attestation protocols and remote wipe functions protect cardholder data. As a result, cloud mPOS adoption is rewriting cost structures across the United States POS terminals market.
Retailer Demand for Unified Commerce Analytics
Omnichannel merchants are converging store, online, and mobile transactions into single customer ledgers. Cloud-native APIs sync point-of-sale data with ERP, warehouse, and marketing platforms in near real time, enabling dynamic pricing that lifts conversion by 10-15% in documented deployments. Overnight batch uploads common to legacy systems create stockouts and lost cross-sell moments, a gap modern platforms eliminate. New connectors to SAP, Oracle, and Salesforce have trimmed integration timelines to as little as four weeks. This capability supports ship-from-store and curbside pickup models that require flexible tender options and inventory accuracy within minutes. Unified data streams are now a prerequisite for large-chain RFPs, cementing analytics as a growth driver for the United States POS terminals market.
PCI-DSS 4.0 Compliance Driving Hardware Refresh
The March 2025 enforcement of PCI-DSS 4.0 introduced enhanced multi-factor authentication, stronger encryption, and automated log review. Roughly 1.8 million devices built before 2020 lack the secure cryptographic modules needed to comply, forcing replacements across retail, hospitality, and healthcare. Acquirers shared upgrade costs to retain merchants, while resellers leveraged new requirements to bundle inventory and loyalty software. Terminals with hardened Linux and over-the-air updates have become the norm, cutting on-site service calls. Fines of up to USD 100,000 per month for non-compliance make the refresh cycle non-optional, bolstering near-term demand in the United States POS terminals market.
Restraints Impact Analysis*
| Restraint | (~) % Impact on CAGR Forecast | Geographic Relevance | Impact Timeline |
|---|---|---|---|
| Intensifying Cyber-attack Sophistication on POS End-points | -1.2% | National, elevated risk in retail and hospitality sectors | Short term (≤ 2 years) |
| Inflation-Driven Cap-Ex Deferrals by Small Merchants | -0.9% | National, concentrated among independent merchants with revenue below USD 500,000 | Short term (≤ 2 years) |
| Processor and Gateway Fee Compression Squeezing Hardware Margins | -0.6% | National, affecting all terminal manufacturers and distributors | Medium term (2-4 years) |
| Rural Connectivity Gaps Limiting Wireless POS Performance | -0.4% | Rural counties in Midwest, Mountain West, and parts of South | Long term (≥ 4 years) |
| Source: Mordor Intelligence | |||
Intensifying Cyber-attack Sophistication on POS End-points
Memory-scraping malware evolved to intercept card data before encryption, leading to breaches that exposed 2.3 million records in 2024.[3]Verizon, “Data Breach Investigations Report,” verizon.com Card networks now require end-to-end encryption and tokenization for new deployments, adding USD 40-USD 80 to device bills of materials. Ransomware targeting POS logs has demanded payouts of USD 10,000-USD 50,000, disrupting revenue for operators without robust backups. Behavior-based threat analytics increase processor load, shortening usable life of older terminals. Implementation complexity and a shortage of qualified security assessors delayed compliance for 22% of Level 3 and Level 4 merchants entering 2026.
Inflation-Driven Cap-Ex Deferrals by Small Merchants
Persistently high interest rates and input-cost inflation prompted 34% of small-business owners to postpone equipment purchases in 2025. Replacement cycles now stretch to six or seven years, dampening immediate demand for fixed workstations. Zero-upfront hardware programs embed device costs into processing fees, but operators with thin margins resist the additional 10-20 basis-point expense. Federal Reserve policy keeping the federal funds rate above 5% through mid-2025 further elevated borrowing costs, pushing merchants toward lower-cost mobile alternatives. While cloud mPOS softens the blow, cap-ex hesitancy remains a constraint on the United States POS terminals market.
*Our forecasts treat driver/restraint impacts as directional, not additive. The impact forecasts reflect baseline growth, mix effects, and variable interactions.
Segment Analysis
By Mode of Payment Acceptance: Contactless Dominance Reflects Completed Infrastructure Shift
Contactless terminals captured 79.95% of the United States POS terminals market share in 2025 and are forecast to expand at an 8.42% CAGR between 2026 and 2031. The surge reflects a wholesale transition from magnetic-stripe and chip-only hardware as merchants finish swapping out legacy devices. Diary data from the Federal Reserve show contactless payments rising from 19.7% of in-person transactions in 2022 to an estimated 34% by late 2025, a lift driven by younger consumers who default to phone-based wallets. Card networks reinforced the shift by lifting no-signature limits to USD 250 in 2025, allowing grocery, fuel, and restaurant operators to process mid-value tickets without authentication delays. Quick-service restaurants and transit agencies were early movers, cutting per-checkout times from roughly 15 seconds to under 5 seconds, while grocery chains accelerated adoption once hybrid devices that handle contact, contactless, and QR payments hit the market.
The ecosystem’s next efficiency gain comes from the FIDO Alliance’s Secure Payment Confirmation standard, finalized in January 2026, which layers biometric authentication onto high-value tap transactions without sacrificing speed. Mobile wallet penetration underpins the trend: Apple Pay, Google Pay, and Samsung Pay together handled 28% of contactless volume by the end of 2025, and that share is on track to top 40% by 2027 as NFC chips appear in more mid-tier phones. PCI-DSS 4.0 now requires every newly certified terminal to support NFC and remote key injection, effectively ending commercial life for contact-only devices. Contact-based units linger in a shrinking set of use cases, government benefit disbursement, certain healthcare reimbursement flows, and high-security sites that insist on physical card checks, but they are expected to slip below 15% of total volume by 2031.


By POS Type: Portability and Cloud Economics Propel mPOS
Fixed workstations commanded 64.52% of the United States POS terminals market size in 2025, reflecting the entrenched needs of grocery, fuel, and big-box formats for integrated peripherals and multi-lane synchronization. Yet, the mobile and portable systems segment is projected to post a 9.38% CAGR through 2031, outpacing all other terminal types. Cloud subscriptions convert capital expense into predictable operating costs and bundle analytics that guide staffing and inventory decisions. Handheld units used tableside trimmed restaurant turn times by 12% and boosted average tips by 8%, according to 2025 deployment data from Toast.
Manufacturers now offer modular hybrids that detach from countertop bases, giving retailers the benefits of both a stationary and a roaming setup. Android-based devices with built-in scanners and 12-hour batteries address delivery and field-service scenarios where payments occur at customer sites. While fixed units remain indispensable in high-volume lanes, device density per store is declining as self-checkout and scan-and-go apps divert traffic. As a result, the United States POS terminals market share of legacy countertop terminals is likely to erode gradually, even though absolute installed numbers stay high.
By End-User Industry: Healthcare Acceleration Reflects Payment-Shift Dynamics
Retail accounted for 42.32% of 2025 demand within the United States POS terminals market, driven by its vast merchant base and transaction volumes. Growth is moderating, however, as e-commerce advances and self-checkout displaces staffed lanes. Healthcare is the standout gainer, forecast to grow at an 8.22% CAGR through 2031. High-deductible insurance plans pushed patient out-of-pocket spending to USD 491 billion in 2024, incentivizing providers to collect balances before patients leave the facility. Terminals integrated with electronic health record platforms post payments automatically, cutting administrative overhead.
HIPAA compliance drives demand for devices that incorporate encrypted patient-identity verification and audit logs. Ambulatory surgery centers and specialist clinics now deploy portable units in exam rooms to secure co-pays, compressing accounts receivable days. Hospitality and transportation follow as early adopters of handheld devices for tableside and curbside transactions. Collectively, shifting payment patterns and industry-specific compliance needs are reshaping terminal requirements across the United States POS terminals industry.

Geography Analysis
Merchant density and connectivity infrastructure create meaningful regional variation, even though formal sub-national data splits are not published. The top 50 metropolitan areas hosted 62% of installed terminals in 2025, reflecting their concentration of retail, hospitality, and healthcare sites. Urban markets also lead contactless acceptance because smartphone penetration and digital-payment familiarity are higher among city dwellers. Conversely, rural counties, especially in the Midwest and Mountain West, face 4G coverage gaps that impair wireless terminal reliability; 14% of counties still lack dependable LTE service. Merchants in these areas choose hybrid units that fail over to Ethernet when cellular networks falter.
The Federal Communications Commission’s 5G Fund for Rural America earmarks USD 9 billion for coverage expansion through 2028. As networks fill in, performance-driven replacement cycles should lift adoption of cloud-managed hardware in agricultural communities. Real-time payment enablement via FedNow is spreading from early adopters in New York, San Francisco, and Charlotte to regional banks nationwide. State privacy laws in California and New York impose encryption requirements beyond PCI-DSS baselines, nudging merchants toward higher-spec terminals with tokenization by default. These combined factors are expected to narrow geographic disparities in terminal capability by 2029, though metro areas will continue to anchor volume within the United States POS terminals market.
Competitive Landscape
The top five suppliers controlled roughly 58% of United States POS terminals market share in 2025, a level that signals moderate concentration. Software-led challengers such as Block, Toast, and Lightspeed Commerce distribute devices at or below cost, recouping margin through 15-30 basis-point slices of processing volume. Incumbent hardware makers Verifone, Ingenico, and PAX Technology have responded by embedding app marketplaces and partnering with vertical SaaS vendors. NCR Voyix’s spin-off sharpened its focus on cloud-native retail solutions, accelerating product roadmaps and deepening integration with enterprise software stacks.
Embedded-finance models are unlocking micro-merchant segments under USD 50,000 in annual card volume, where quick onboarding and flat-rate pricing trump advanced feature sets. AI-driven fraud detection is another battleground, with Mastercard’s Decision Intelligence cutting false declines by 85% across 143 billion transactions processed in 2024. Compliance requirements such as mandatory over-the-air patching elevate vendors with mature software pipelines. Niche opportunities persist in tightly regulated sectors, including cannabis dispensaries and firearms retailers, where mainstream processors restrict service. Overall, competitive intensity is rising even as the United States POS terminals market grows, pressuring legacy gross margins and spurring consolidation.
United States POS Terminals Industry Leaders
VeriFone System Inc.
BBPOS Limited
Castles Technology Co., Ltd.
NCR Corporation
Ingenico Inc.
- *Disclaimer: Major Players sorted in no particular order

Recent Industry Developments
- February 2026: PAX Technology unveiled Android-based mobile terminals with integrated scanners and 12-hour batteries that support contactless, chip, and QR payments, plus over-the-air compliance updates.
- January 2026: The FIDO Alliance finalized the Secure Payment Confirmation standard, introducing biometric authentication for high-value contactless transactions.
- December 2025: Global Payments launched a modular countertop terminal that converts to a portable unit, unifying fixed and roaming use cases.
- October 2025: Block reported USD 62.4 billion in Q3 2025 gross payment volume and introduced a new countertop terminal with dual displays.


United States POS Terminals Market Report Scope
The United States POS Terminals Market Report is Segmented by Mode of Payment Acceptance (Contact-based, and Contactless), POS Type (Fixed Point-of-Sale Systems, and Mobile and Portable Point-of-Sale Systems), End-User Industry (Retail, Hospitality, Healthcare, Transportation and Logistics, and Other End-User Industries), and Geography. The Market Forecasts are Provided in Terms of Value (USD).
By Mode of Payment Acceptance
| Contact-based |
| Contactless |
By POS Type
| Fixed Point-of-Sale Systems |
| Mobile and Portable Point-of-Sale Systems |
By End-User Industry
| Retail |
| Hospitality |
| Healthcare |
| Transportation and Logistics |
| Other End-User Industries |
| By Mode of Payment Acceptance | Contact-based |
| Contactless | |
| By POS Type | Fixed Point-of-Sale Systems |
| Mobile and Portable Point-of-Sale Systems | |
| By End-User Industry | Retail |
| Hospitality | |
| Healthcare | |
| Transportation and Logistics | |
| Other End-User Industries |


Key Questions Answered in the Report
What is the projected value of United States POS terminals by 2031?
The market is forecast to reach USD 25.98 billion by 2031.
How fast are contactless terminals growing compared with chip-based models?
Contactless devices are advancing at a 8.42% CAGR from 2026 to 2031, the highest rate among payment modes.
Which terminal form factor is expanding quickest?
Mobile and portable systems is projected to grow at a 9.38% CAGR through 2031, outpacing fixed units.
Why is healthcare adopting more POS devices?
Rising patient out-of-pocket costs and the need for HIPAA-compliant payment capture are driving a 8.22% CAGR in healthcare deployments.
How does PCI-DSS 4.0 affect merchants?
The standard mandates stronger authentication and encryption, forcing replacement of 1.8 million legacy terminals and imposing fines for non-compliance.
What level of competition exists among vendors?
The top five suppliers hold about 58% share, yielding a moderate concentration score of 6.
Page last updated on:


