United States Pharmaceutical Warehousing Market Size and Share
Market Overview
| Study Period | 2020 - 2031 |
|---|---|
| Forecast Data Period | 2026 - 2031 |
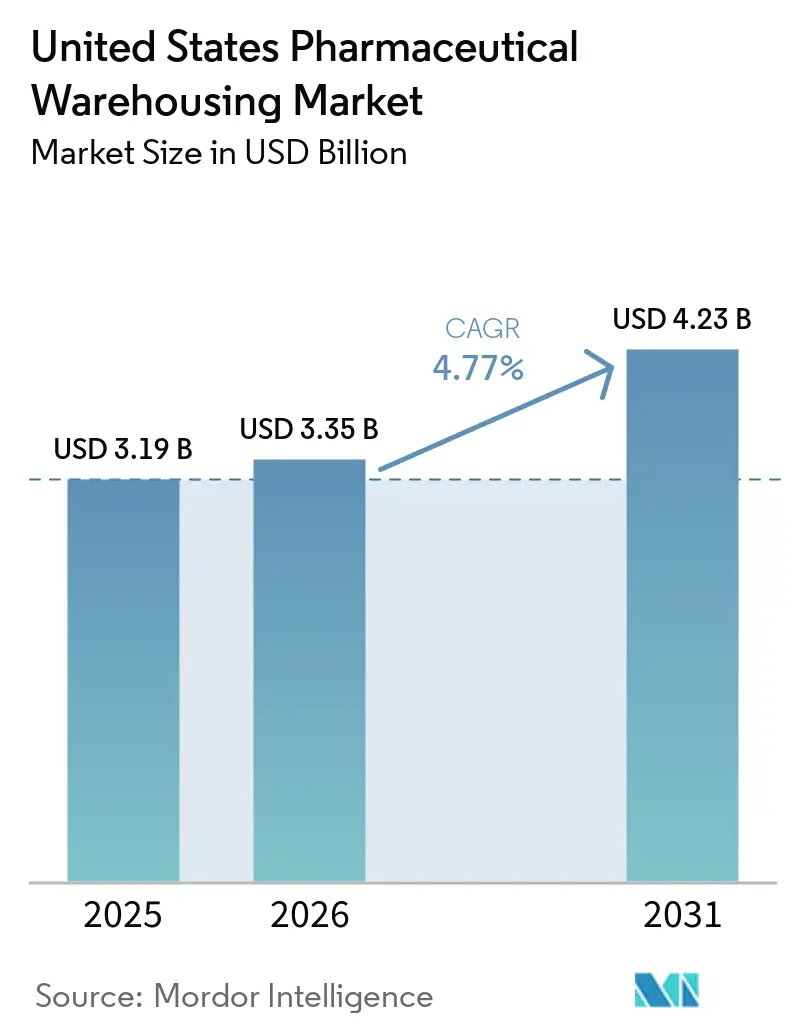
| Base Year Market Size (2025) | USD 3.19 Billion |
| Market Size (2026) | USD 3.35 Billion |
| Market Size (2031) | USD 4.23 Billion |
| Growth Rate (2026 - 2031) | 4.77% CAGR |
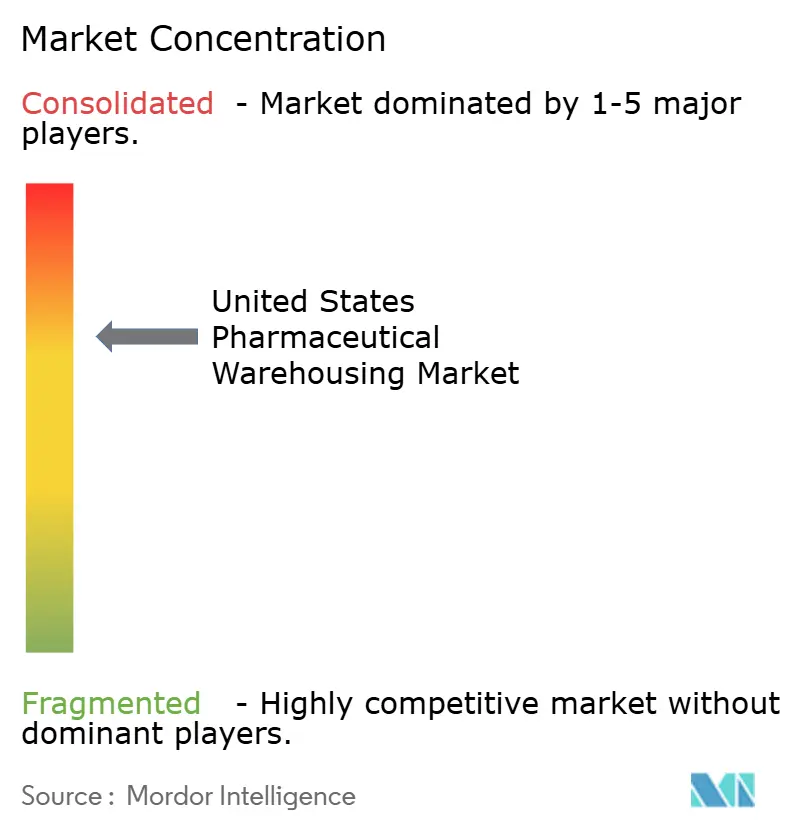
| Market Concentration | Medium |
Major Players *Disclaimer: Major Players sorted in no particular order Image © Mordor Intelligence. Reuse requires attribution under CC BY 4.0. | |
United States Pharmaceutical Warehousing Market Analysis by Mordor Intelligence
The United States Pharmaceutical Warehousing market size is projected to expand from USD 3.19 billion in 2025 and USD 3.35 billion in 2026 to USD 4.23 billion by 2031, registering a CAGR of 4.77% between 2026 and 2031. Ongoing outsourcing to healthcare-focused third-party logistics (3PL) specialists, cold-chain build-outs for biologics, and vertically integrated specialty-pharmacy distribution centers continue to shape demand trajectories. The United States Pharmaceutical Warehousing market is also benefiting from the reshoring of vaccine and antibody production, which is expanding domestic distribution center (DC) footprints, while automation and robotics help operators offset labor shortages and enhance FDA current Good Manufacturing Practice (cGMP) compliance. Meanwhile, climate-resilience investments and state-level privacy statutes are setting new baseline costs that incumbents can more easily absorb than smaller rivals, reinforcing the market’s tilt toward scale players.
Key Report Takeaways
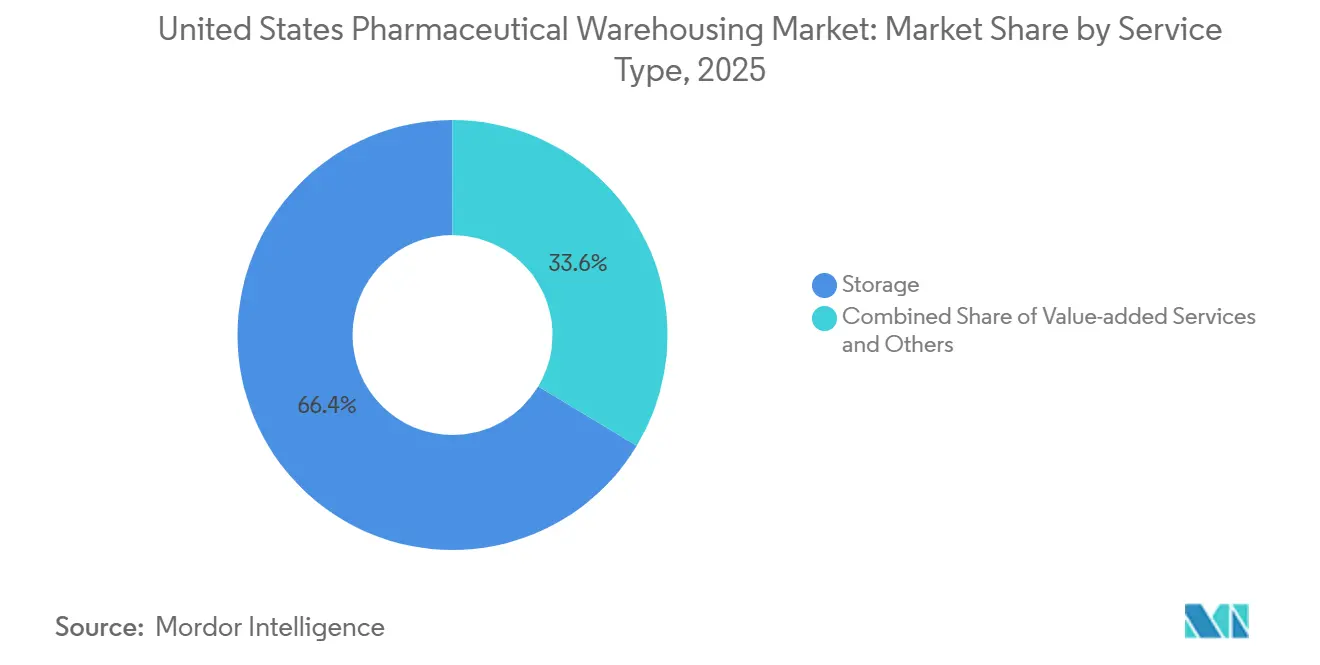
- By service type, storage operations held 66.38% of the United States Pharmaceutical Warehousing market share in 2025, whereas value-added services are advancing at a 5.74% CAGR through 2031.
- By warehouse type, non-cold-chain facilities controlled 75.06% of the United States Pharmaceutical Warehousing market size in 2025, while cold-chain capacity is forecast to grow at a 5.91% CAGR to 2031.
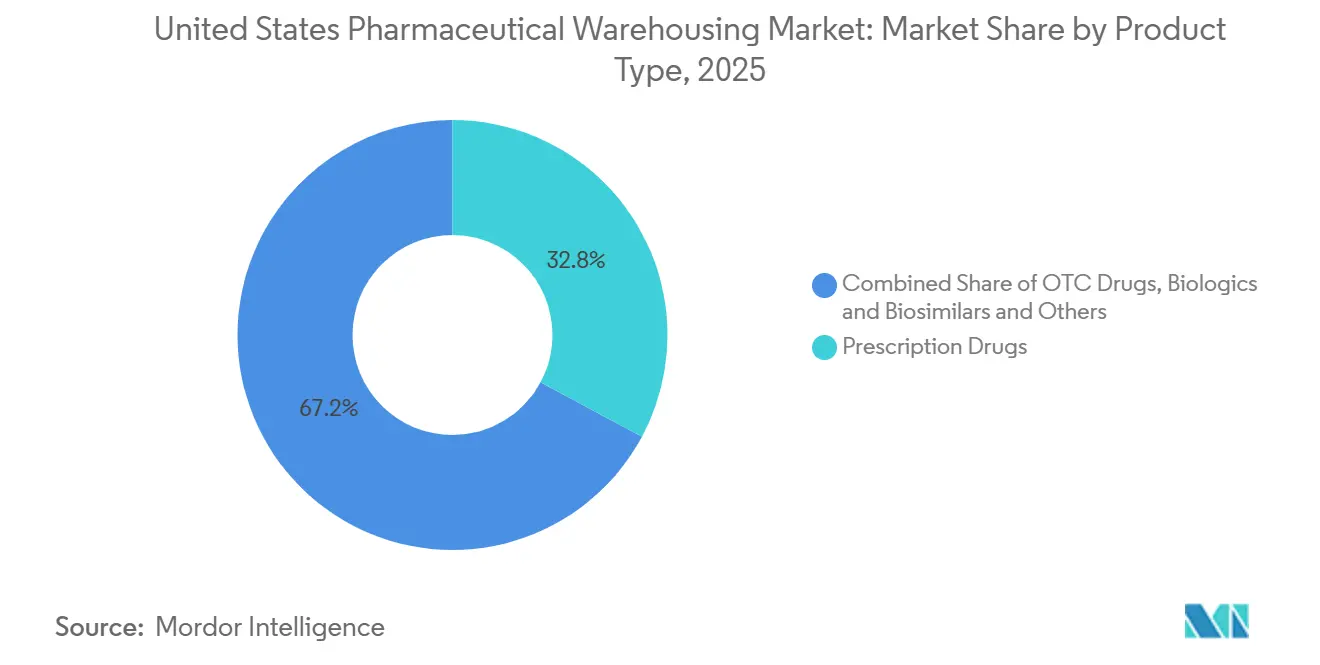
- By product type, prescription drugs accounted for 32.84% of throughput in 2025, and cell and gene therapies are set to post the fastest 6.19% CAGR between 2026 and 2031.
- By end user, pharmaceutical manufacturers led with 34.16% of the United States Pharmaceutical Warehousing market share in 2025, healthcare providers are projected to record a 5.58% CAGR to 2031.
Note: Market size and forecast figures in this report are generated using Mordor Intelligence’s proprietary estimation framework, updated with the latest available data and insights as of 2026.
Proportional positioning is established by comparing country level and regional contributions against the global total, including that of United states. The pharmaceutical warehousing market share in our global report expresses these relative weights.
United States Pharmaceutical Warehousing Market Trends and Insights
Drivers Impact Analysis*
| Driver | (~) % Impact on CAGR Forecast | Geographic Relevance | Impact Timeline |
|---|---|---|---|
| Outsourcing surge to healthcare-focused 3PLs | +1.3% | National clusters in NJ, NC, TX | Medium term (2-4 years) |
| Ramp-up of domestic vaccine & antibody capacity | +0.9% | Boston, San Francisco, Research Triangle | Long term (≥ 4 years) |
| Automation & robotics deployments | +0.8% | High-wage coastal markets | Medium term (2-4 years) |
| Expansion of specialty-pharmacy DC networks | +1.1% | Major metros & integrated health systems | Long term (≥ 4 years) |
| ESG-driven retrofits for energy-efficient cold stores | +0.5% | CA & Northeast | Long term (≥ 4 years) |
| Drone/EV last-mile pilots requiring forward-staged micro cold sites | +0.4% | NYC, LA, Chicago, Seattle | Short term (≤ 2 years) |
| Source: Mordor Intelligence | |||
Outsourcing Surge to Healthcare-Focused 3PLs
The warehousing landscape is witnessing a clear shift toward outsourced and contract-based models as manufacturers focus their resources on innovation and product development instead of owning storage infrastructure. This transition is being accelerated by major logistics integrators, particularly those expanding in healthcare logistics, who are acquiring cold-chain specialists to build integrated, end-to-end supply solutions. Such consolidation allows them to manage temperature-sensitive pharmaceuticals and biologics more effectively while meeting stringent compliance requirements. Increasing regulatory demands, such as those related to facility validation and product traceability, have raised the cost of compliance to levels that smaller, niche warehouse operators often find difficult to sustain, further reinforcing the move toward large, well-capitalized logistics providers[1]U.S. Food & Drug Administration, “21 CFR 211.142 – Warehousing Procedures,” ecfr.gov.
Ramp-up of Domestic Vaccine & Antibody Capacity Fueling DC Demand
Pharmaceutical companies in the United States are significantly expanding their production infrastructure, particularly in biologics manufacturing, which is now a key driver of logistics and warehousing demand. The rise of advanced biomanufacturing has intensified the need for specialized cold-chain facilities capable of managing temperature-sensitive materials throughout the production and distribution cycle. Ultra-low-temperature storage systems are essential for supporting mRNA and other biologic formulations, not only requiring higher energy capacity but also generating strong returns due to the premium pricing of such storage services. As a result, cold-chain warehousing has become a central component of the sector’s capital strategy, linking biomanufacturing growth directly with logistics investment.
Automation & Robotics Deployments Improving GMP Accuracy
Pharmaceutical warehousing is undergoing rapid automation, with robots and intelligent storage systems becoming mainstream across distribution centers. The adoption of autonomous mobile robots and automated retrieval solutions has transformed operations, improving accuracy, space efficiency, and workflow consistency. Flexible subscription-based robotics models are making these technologies accessible even to mid-sized logistics operators, reducing the need for heavy upfront investment. At the same time, AI-driven warehouse management systems are optimizing movement and inventory flow, setting new benchmarks for efficiency and reliability in pharmaceutical logistics.
Expansion of Specialty-Pharmacy Distribution Networks
Health systems are increasingly establishing their own specialized distribution centers to manage high-value biologics and other complex therapies more directly. This growing emphasis on in-house control of pharmaceutical inventories is fueling steady expansion in warehousing demand from healthcare providers. Additionally, limited distribution frameworks for therapies requiring strict safety and monitoring protocols are concentrating logistics operations among a select group of certified providers. These operators benefit from premium handling contracts, as their compliance capabilities and specialized infrastructure align closely with regulatory and manufacturer requirements.
Restraints Impact Analysis*
| Restraint | (~) % Impact on CAGR Forecast | Geographic Relevance | Impact Timeline |
|---|---|---|---|
| Escalating liability & product-recall insurance premiums | −0.5% | National, higher on cell-therapy handlers | Medium term (2-4 years) |
| Construction-material shortages delaying warehouse buildouts | −0.7% | High-growth Sun Belt markets | Short term (≤ 2 years) |
| Patchwork of new state data-privacy laws limiting IoT analytics | −0.3% | CA, VA & 12 additional states | Long term (≥ 4 years) |
| Extreme-weather volatility raising HVAC redundancy capex | −0.4% | TX, Southeast coasts, Midwest | Medium term (2-4 years) |
| Source: Mordor Intelligence | |||
Escalating Liability & Product-Recall Insurance Premiums
The insurance environment for pharmaceutical logistics is tightening as underwriters respond to rising exposure risks, particularly in cell and gene therapy distribution. High product values and complex handling requirements have made recall insurance significantly more expensive, pushing logistics operators to strengthen quality and traceability measures. At the same time, enforcement of serialization and traceability regulations is exposing weaknesses in legacy warehouse systems. Facilities lacking interoperable, real-time tracking capabilities are facing steep premium surcharges, creating strong incentives for rapid digital modernization across the pharmaceutical supply chain[2]Pharmacy Times Staff, “Consequences of the Change Healthcare Cyberattack Continue,” pharmacytimes.com.
Construction-Material Shortages Delaying Warehouse Build-outs
Cold-chain infrastructure projects are facing growing delays as supply constraints affect key construction materials like insulated metal panels and refrigeration systems. These bottlenecks are extending project timelines, slowing the pace at which new temperature-controlled facilities can enter operation despite rising market demand. Added to this, fluctuations in steel prices are increasing budget uncertainty for developers, particularly in regions experiencing rapid expansion and high land costs. These combined pressures are creating a tighter supply environment for cold-chain capacity across emerging logistics hubs[3]Brown West Logistics, “Average Warehouse Cost per Square Foot in the U.S.,” brownwestlogistics.com.
*Our forecasts treat driver/restraint impacts as directional, not additive. The impact forecasts reflect baseline growth, mix effects, and variable interactions.
Segment Analysis
By Service Type: Value-Added Capabilities Outpace Basic Storage
Storage retained 66.38% of the United States Pharmaceutical Warehousing market share in 2025, but value-added services are expanding at a 5.74% CAGR as serialization, kitting, and clinical-trial packaging deliver 40-60% higher revenue per ft². These premium services rely on validated IT and quality-management infrastructures that smaller facilities cannot match, reinforcing consolidation trends. Warehouses offering real-time inventory visibility through cloud dashboards and seamless ERP integrations report 90% client adoption, cementing sticky long-term contracts. Returns processing tied to DSCSA has also emerged as a sustainable profit pool, given the industry’s strict re-serialization requirements.
The United States pharmaceutical warehousing is evolving toward higher-value services, with custom patient packaging and regulatory consulting becoming key differentiators. Providers offering temperature mapping, validation, and audit-readiness support are building recurring revenue streams while reinforcing their role as partners in compliance and distribution excellence.


By Warehouse Type: Cold-Chain Investment Surges
Non-cold-chain sites accounted for 75.06% of the United States Pharmaceutical Warehousing market size in 2025, benefiting from lower operating expenses of roughly USD 9/ft². Cold-chain, however, is set to post a 5.91% CAGR through 2031, pulled by biologics, vaccines, and personalized therapies that require temperatures from 2 °C down to -196 °C. Ultra-low and cryogenic zones yield margins several times higher than ambient space but consume 79% of total warehouse electricity. Energy-efficiency retrofits and automated retrieval systems are therefore critical for profitability and sustainability compliance[4]Cogniteq Team, “IoT in Warehouse Management: Solutions and Use Cases,” cogniteq.com.
Integrated operators blend ambient and cold-chain zones inside the same campus to maximize asset turns, while IoT-enabled predictive maintenance slashes unplanned downtime by 60%. The United States Pharmaceutical Warehousing market share in ultra-low storage remains small but represents a disproportionate share of profits given per-pallet fees of USD 50-75.
By Product Type: Cell & Gene Therapies Lead Growth
Prescription drugs led throughput at 32.84% the United States Pharmaceutical Warehousing market size in 2025, yet cell and gene therapies are advancing fastest with a 6.19% CAGR. Each autologous batch requires tight chain-of-custody documentation, raising operational complexity by 40% relative to traditional drugs. Biologics and biosimilars drive consistent cold-chain volume, while OTC products face margin pressure from e-commerce fulfillment alternatives.
Vaccines, particularly mRNA formulations, accelerate cold-chain capacity due to -80 °C requirements. Clinical-trial materials form a lucrative sub-segment, demanding flexible space and rapid configuration changes, which larger automated warehouses can deliver more readily than manual sites.
By End User: Vertical Integration Among Health Systems Accelerates
Pharmaceutical manufacturers still represent 34.16% of the United States Pharmaceutical Warehousing market size in 2025, primarily outsourcing warehousing to concentrate on R&D. Healthcare providers are the growth engine, expanding at 5.58% CAGR as integrated delivery networks build or lease dedicated centers to manage specialty-drug spend. Retail chains operate national clusters serving thousands of pharmacies, but independent drugstores struggle with DSCSA compliance costs.
Distributors protect relevance through billion-dollar automation and cold-chain upgrades, yet direct manufacturer-to-pharmacy shipping and hospital central-fill models are gradually narrowing traditional wholesale margins.
Geography Analysis
Facility density remains highest in the Northeast owing to its pharma manufacturing heritage; however, real-estate costs surpass USD 18/ft² in parts of New Jersey, pushing secondary storage to lower-cost states. North Carolina’s Research Triangle captures biologics-related builds, leveraging skilled labor at moderate wage levels. California maintains critical clinical-trial material nodes despite costly permitting for ammonia systems and strict environmental reviews.
Texas dominates national square footage, with Dallas-Fort Worth offering central positioning and leases near USD 7/ft²-less than half of coastal peers. Phoenix and Savannah have recorded 40%-plus warehouse growth, tapping near-shore imports, dry climates, or port adjacencies. The Midwest’s cross-country reach, especially from Indiana and Ohio, yields average 2.3-day service times to both coasts. Intermodal strategies, such as a Kansas City cold-store linked to a north-south rail line, eliminate multiday truck queues and open access to Mexico for frozen biologics.
Climate risk overlays geography: Gulf Coast sites must design for hurricanes while Southwest sites face extreme heat and grid constraints. These variables influence insurance premiums, backup-power specifications, and ultimately the total cost of ownership.
Mordor Intelligence examines the pharmaceutical warehousing market across diverse other regional markets as well, including North America, Europe, and South East Asia, while also offering granular country-level perspectives for Germany and China and more.
Competitive Landscape
Concentration is moderate but rising. Two temperature-controlled giants hold 71% of capacity, up 10 percentage points since 2019, allowing them to command premium rates and advantageous multiyear contracts. One of these leaders raised USD 4.44 billion via IPO in 2024, rapidly deploying proceeds into bolt-on acquisitions and automated mega-sites. The other is partnering with rail and port operators to develop intermodal cross-dock campuses that shorten export lead times.
Integrated parcel and freight companies intensify M&A to secure specialty courier networks; deals closed or announced in 2024-2025 exceed USD 18 billion in aggregate value. Technology remains the primary competitive lever: warehouses with robotics and AI-augmented management achieve 15-25% productivity gains versus manual peers.
New entrants must clear high regulatory bars-DEA security, cGMP validation, and state-level pharmacy licensing-that safeguard incumbent positions. White-space niches include urban micro-fulfillment for same-day prescriptions and cryogenic storage tailored to cell-therapy pipelines.
United States Pharmaceutical Warehousing Industry Leaders
United Parcel Service Inc.
DHL Supply Chain
FedEx Corp.
Lineage Logistics
Americold Logistics
- *Disclaimer: Major Players sorted in no particular order

Recent Industry Developments
- November 2025: UPS acquired Andlauer Healthcare Group (AHG) for USD 1.6B to strengthen North American cold-chain logistics and pharma distribution capabilities.
- September 2025: DHL acquired SDS Rx (United States-based pharma logistics provider) to expand healthcare last-mile delivery in the United States.
- March 2025: DHL Acquired CryoPDP (specialty pharma courier for clinical trials and biopharma logistics). Entered a strategic partnership with CryoPDP alongside an acquisition to strengthen global life sciences supply chain services.
- January 2025: UPS Completed acquisition of Frigo-Trans & BPL (Germany-based cold-chain logistics providers) to expand temperature-controlled warehousing and transport.


United States Pharmaceutical Warehousing Market Report Scope
| Storage |
| Distribution and Inventory Management |
| Value-added Services and Others |
| Cold-Chain Warehouse | Chilled (0-5°C) |
| Frozen (-18-0°C) | |
| Ambient | |
| Deep-Frozen / Ultra-Low (less than-20 °C) | |
| Non-Cold-Chain Warehouse |
| Prescription Drugs |
| OTC Drugs |
| Biologics and Biosimilars |
| Vaccines and Blood Products |
| Clinical Trail Materials |
| Cell and Gene Therapies |
| Specialty Medicine (non-biologic) |
| Veterinary Medicine |
| Others |
| Pharmaceutical Manufacturers |
| Healthcare Providers |
| Retail and Pharmacies |
| Distributors and Wholesalers |
| Others |
| By Service Type | Storage | |
| Distribution and Inventory Management | ||
| Value-added Services and Others | ||
| By Warehouse Type | Cold-Chain Warehouse | Chilled (0-5°C) |
| Frozen (-18-0°C) | ||
| Ambient | ||
| Deep-Frozen / Ultra-Low (less than-20 °C) | ||
| Non-Cold-Chain Warehouse | ||
| By Product Type | Prescription Drugs | |
| OTC Drugs | ||
| Biologics and Biosimilars | ||
| Vaccines and Blood Products | ||
| Clinical Trail Materials | ||
| Cell and Gene Therapies | ||
| Specialty Medicine (non-biologic) | ||
| Veterinary Medicine | ||
| Others | ||
| By End User | Pharmaceutical Manufacturers | |
| Healthcare Providers | ||
| Retail and Pharmacies | ||
| Distributors and Wholesalers | ||
| Others | ||


Key Questions Answered in the Report
How big will United States Pharmaceutical Warehousing get by 2031?
The United States Pharmaceutical Warehousing market size is forecast to reach USD 4.23 billion by 2031 under a 4.77% CAGR outlook
What segment is growing fastest in domestic pharmaceutical storage?
Cell and gene therapies lead growth with a projected 6.19% CAGR as approvals and manufacturing scale accelerate.
Why are cold-chain warehouses expanding more quickly than ambient sites?
Biologics, mRNA vaccines, and personalized medicines require 2 °C to -196 °C environments, driving a 5.91% CAGR in cold-chain capacity.
Which regions offer the lowest operational costs for pharma warehousing?
Texas and the broader Southeast provide leases near USD 7/ft² plus favorable permitting, making them cost-efficient distribution hubs.
What technology investments are top 3PLs prioritizing?
Leaders are rolling out AI-driven inventory platforms, IoT temperature sensors and robotics to boost efficiency and maintain FDA compliance.
How is automation reshaping pharmaceutical distribution centers?
Facilities deploying robots and AI-enabled management systems are cutting picking errors to near-zero and boosting space utilization by about 15–25%.
Page last updated on:


