Market Overview
| Study Period | 2020 - 2031 |
|---|---|
| Forecast Data Period | 2026 - 2031 |
| Historical Data Period | 2020 - 2024 |
| Market Size (2026) | USD 97.13 Billion |
| Market Size (2031) | USD 133.87 Billion |
| Growth Rate (2026 - 2031) | 6.63% CAGR |
| Market Concentration | High |
Major Players *Disclaimer: Major Players sorted in no particular order Image © Mordor Intelligence. Reuse requires attribution under CC BY 4.0. | |

US Cold Chain Logistics Market Analysis by Mordor Intelligence
The US Cold Chain Logistics Market size is estimated at USD 97.13 billion in 2026, and is expected to reach USD 133.87 billion by 2031, at a CAGR of 6.63% during the forecast period (2026-2031).
Automation roll-outs, pharmaceutical temperature-control sophistication, and stricter sustainability mandates are reshaping network design, capital allocation, and service differentiation. Traditional food-focused operators face margin compression as energy costs rise, while specialized pharmaceutical logistics providers command premium pricing by offering ultra-low-temperature capabilities with near-zero tolerance for excursions. Surface transportation remains dominant for food volumes, yet airfreight demand is accelerating where cell and gene therapies require overnight delivery and cryogenic handling. Regional shifts are equally notable, with the Southeast maintaining the largest capacity base, the Southwest emerging as a high-growth nexus tied to US-Mexico trade, and rail-integrated inland hubs gaining favor as shippers hedge against trucking volatility.
Key Report Takeaways
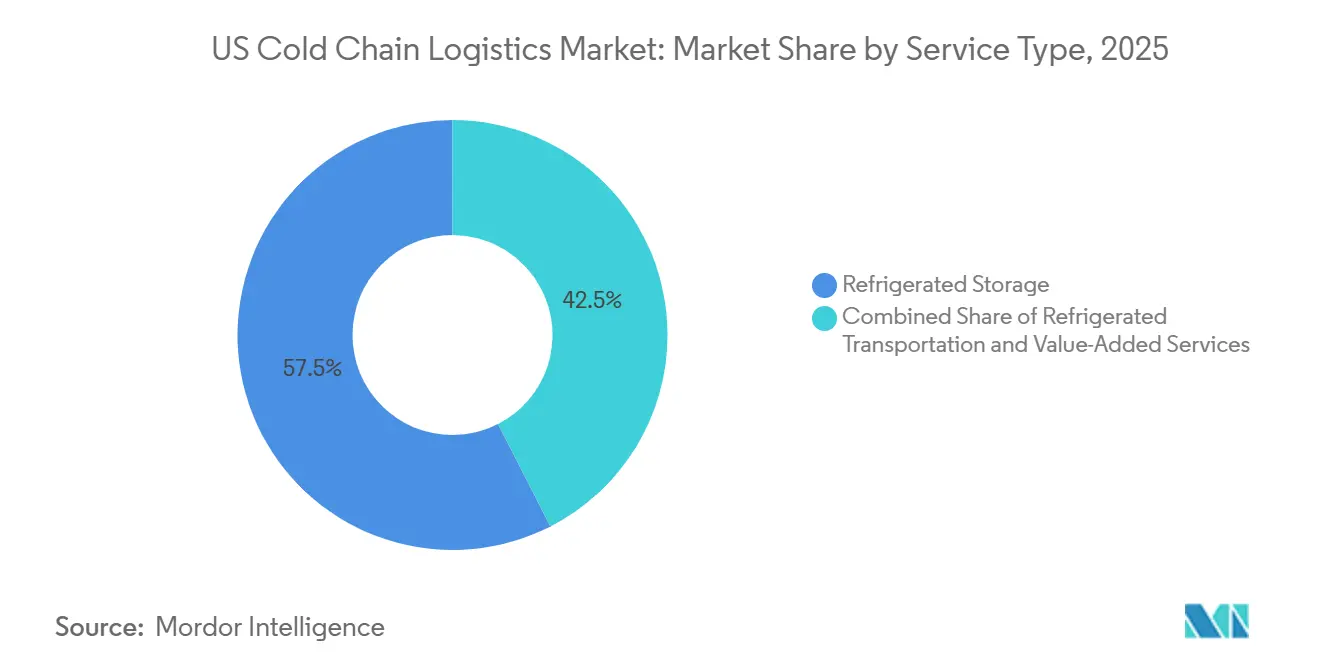
- By service type, refrigerated storage held 57.53% of the US cold chain logistics market share in 2025, while air transportation is forecast to post the fastest 13.23% CAGR through 2031.
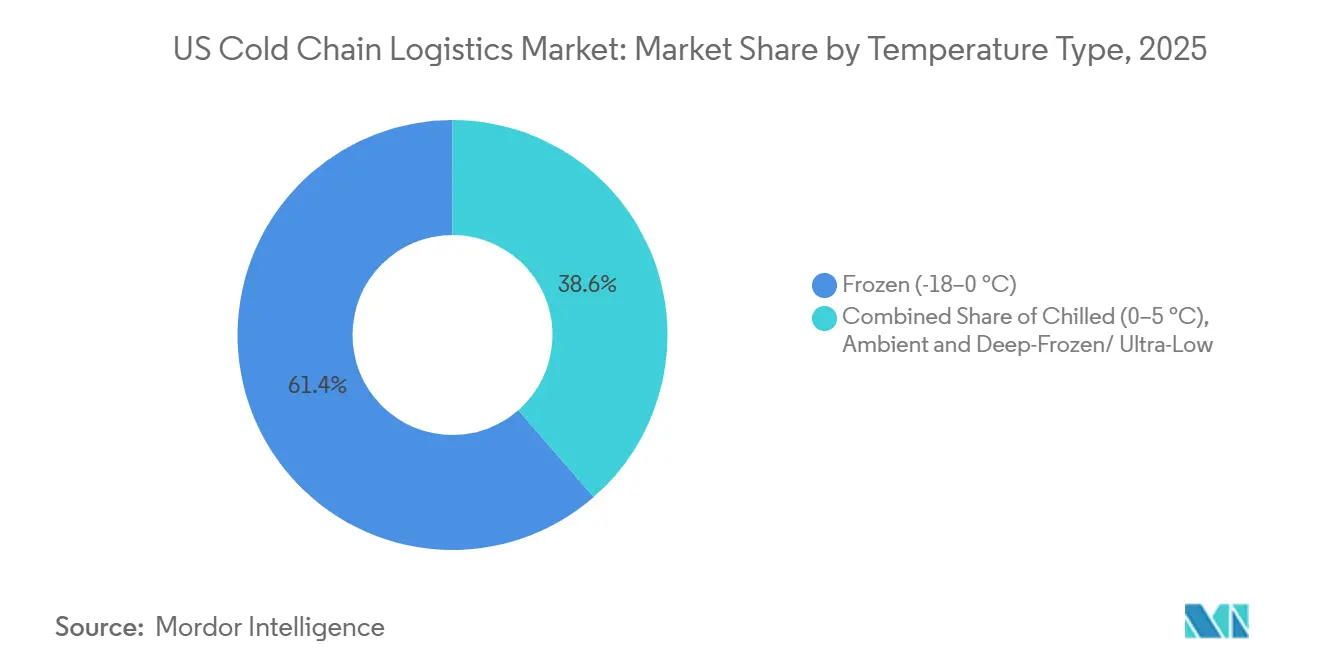
- By temperature band, the frozen segment accounted for 61.42% of the US cold chain logistics market size in 2025, whereas deep-frozen and ultra-low storage is projected to expand at an 11.87% CAGR to 2031.
- By application, meat and poultry led with 22.63% of the US cold chain logistics market size in 2025; vaccines and clinical trial materials record the highest projected 14.11% CAGR through 2031.
- By region, the Southeast captured 34.17% of the US cold chain logistics market share in 2025, while the Southwest is advancing at an 11.02% CAGR to 2031.
Note: Market size and forecast figures in this report are generated using Mordor Intelligence’s proprietary estimation framework, updated with the latest available data and insights as of January 2026.
US Cold Chain Logistics Market Trends and Insights
Drivers Impact Analysis*
| Driver | (~) % Impact on CAGR Forecast | Geographic Relevance | Impact Timeline |
|---|---|---|---|
| E-grocery & Meal-Kit Volumes Surge | +1.6% | National, concentrated in the top 50 metro areas | Medium term (2-4 years) |
| Pharma Biologics & Cell-Gene Therapy Boom | +1.9% | Northeast corridor, expanding to Southeast | Long term (≥ 4 years) |
| Port-Adjacent Automated Mega-Warehouses | +1.2% | Gulf Coast, Pacific Northwest, Mid-Atlantic | Long term (≥ 4 years) |
| Rail-Integrated Inland Cold Hubs (CPKC) | +0.8% | Midwest, Southwest | Medium term (2-4 years) |
| ESG-Linked Financing Accelerates Upgrades | +0.7% | National | Medium term (2-4 years) |
| USDA Food-Waste Mandate Pressure | +0.5% | National, strongest in California | Short term (≤ 2 years) |
| Source: Mordor Intelligence | |||


E-Grocery and Meal-Kit Volumes Surge
Online grocery penetration reached 17% of food retail in 2025, and temperature-controlled last-mile delivery complexity expanded faster than ambient e-commerce[1].Prologis, “The E-commerce Boom Isn’t Over,” prologis.com Individual order dispersion across neighborhoods is forcing micro-fulfilment centers with multi-zone rooms to locate within 10 miles of dense households, inflating real-estate costs in urban cores where vacancy stands near 6.9%. Meal-kit providers add sequencing pressure by cross-docking frozen proteins, chilled produce, and ambient items inside four-hour windows to meet delivery promises. Together, these models lift demand for flexible, small-footprint facilities that can pick, pack, and dispatch within narrow cut-offs. Operators able to integrate route optimization software with real-time refrigeration monitoring have captured new contracts, even as profit margins tighten for legacy facilities lacking value-added capabilities. Growth remains strongest in the top 50 metro areas, reinforcing a hub-and-spoke distribution build-out rather than national uniformity.
Pharma Biologics and Cell-Gene Therapy Boom
Personalized medicines such as CAR-T require point-to-point cryogenic transport, validated storage below -150 °C, and rapid release back to treatment centers, shifting emphasis from bulk storage to patient-specific orchestration. DHL’s commitment to invest EUR 1 billion (USD 1.17 billion) in healthcare logistics across the Americas by 2030 underscores the profitability of premium temperature-controlled lanes. The economic calculus differs from food: a single deviation can erase USD 500,000 in biologics value, compared to USD 5,000 for produce. Consequently, shippers prioritize redundant power, real-time telemetry, and chain-of-custody blockchain, selecting providers on compliance record rather than lowest rate. Capacity shortfalls in Boston, Philadelphia, and Raleigh have spurred speculative ultra-low builds despite 3-4× higher construction costs, signaling sustained demand tailwinds.
Port-Adjacent Automated Mega-Warehouses
Automation and proximity to seaports are converging as developers erect facilities exceeding 500,000 ft² with AS/RS capable of handling 10,000-plus pallet slots under multiple temperature regimes. Lineage’s USD 40 million investment in two automated Gulf Coast complexes demonstrates labor arbitrage benefits near ports where wage premiums for sub-zero work top 30% and turnover eclipses 40% annually. Port adjacency trims dwell time for seafood and produce imports, improving shelf life and lowering demurrage. For operators, the model unlocks power-optimization through dense racking and reduces headcount by up to 70%, keeping operating cost per pallet competitive despite higher capital outlay. Automation readiness is becoming a prerequisite for securing ESG-linked financing that discounts interest rates for demonstrable energy savings.
Rail-Integrated Inland Cold Hubs
Canadian Pacific Kansas City’s intermodal network now offers door-to-door refrigerated container service from Mexican farms to Midwest hubs at a 30-40% cost advantage over trucking, albeit with two-day longer transit windows suited to frozen cargos. Facilities adjoining rail sidings require dedicated lifts, genset charge points, and throughput scales that few mid-sized operators can afford, creating natural entry barriers. Shippers accept modest latency to secure rate stability amid driver shortages and diesel volatility. As volumes scale, inland hubs in Kansas City and San Antonio gain critical mass, diversifying geographic capacity away from coastal bottlenecks. This modal shift supports regional cold chain resilience but demands close inventory management to reconcile slower freight cycles with retail replenishment rhythms.
Restraints Impact Analysis*
| Restraint | (~) % Impact on CAGR Forecast | Geographic Relevance | Impact Timeline |
|---|---|---|---|
| HFC Phase-Down Retrofit Costs | -1.1% | National, acute in the Northeast and the Midwest | Medium term (2-4 years) |
| Labor Scarcity in Sub-Zero Operations | -0.8% | National, the most severe in the Southwest and Southeast | Short term (≤ 2 years) |
| Power-Price Volatility Risk | -0.6% | Texas, California, Northeast | Medium term (2-4 years) |
| Port & Canal Climate Disruptions | -0.4% | Gulf Coast, Mid-Atlantic | Long term (≥ 4 years) |
| Source: Mordor Intelligence | |||
HFC Phase-Down Retrofit Costs
EPA rules compel operators to replace high-GWP refrigerants such as R-404A, raising conversion costs to USD 2-4 million per site while production caps tighten 40% by 2028[2]IIAR, “HFC Phase-Down Guidance,” iiar.org. Facilities constructed in the 2000s retain useful structural life yet face escalating refrigerant prices that have tripled since 2024. Smaller owners struggle to amortize engineering studies and downtime, accelerating consolidation as they exit scale players who spread costs across multiple locations. Retrofit timing also collides with broader capacity expansion plans, forcing capital rationing and delaying other modernization projects.
Labor Scarcity in Sub-Zero Operations
Turnover in freezer zones exceeds 40% annually as workers endure -20 °C environments; wage premiums expanded from 15% in 2020 to nearly 30% by 2025, surpassing productivity gains. Automation mitigates handling but cannot replace maintenance, quality, and dock functions requiring human intervention. The scarcity intensifies in high-growth Sun Belt markets like Phoenix and Dallas, where worker familiarity with deep-freeze conditions is limited. Training costs and attrition squeeze margins, prompting operators to pilot augmented-reality maintenance aids and heated PPE to improve retention.
*Our forecasts treat driver/restraint impacts as directional, not additive. The impact forecasts reflect baseline growth, mix effects, and variable interactions.
Segment Analysis
By Service Type: Automation Reshapes Storage Economics
Refrigerated storage captured 57.53% of the US cold chain logistics market share in 2025, reflecting the pivotal role fixed infrastructure plays in linking producers and consumers. Within this segment, automated public warehouses are gaining share as food companies outsource specialists who distribute fixed costs across multiple tenants. Private storage remains critical for pharmaceuticals, where compliance and security justify single-tenant models. Road transport retains volume leadership, yet capacity headwinds from driver shortages and fuel volatility are steering long-haul frozen goods toward rail-intermodal solutions that offer 30-40% savings. Airfreight’s 13.23% CAGR through 2031 embodies a parallel network optimized for high-value, low-volume therapies that tolerate neither delay nor temperature deviation, cementing premium yields for carriers and handlers. Value-added services - kitting, labeling, and quality testing - have grown by double digits, diversifying revenue streams beyond storage and haulage.
Automation’s impact is multifaceted. Facilities employing AS/RS systems operate with up to 70% fewer floor workers and deliver higher throughput per ft³, mitigating wage inflation and labor scarcity. Energy efficiency gains of 10-15% stem from compact racking and reduced infiltration. As a result, investors funnel capital toward projects exceeding 40 million ft³, supported by ESG-linked financing. Conversely, legacy manual facilities struggle to fund HFC conversions and technology retrofits, pushing industry consolidation as scale operators acquire sub-scale warehouses to redevelop them into automated nodes.


By Temperature Type: Ultra-Cold Drives Investment
The frozen band (-18 °C to 0 °C) accounted for 61.42% of the US cold chain logistics market size in 2025, anchoring traditional frozen food distribution. Operators face rising energy costs and refrigerant phase-down expenses, prompting trials of a “3-degree shift” to -15 °C that promises 10–15% power savings while maintaining food safety[3]Food Logistics, “3-Degree Shift in Frozen Storage,” foodlogistics.com. Chilled storage (0–5 °C) supports fresh produce and dairy with faster turnover and higher spoilage sensitivity, demanding granular demand forecasts and just-in-time replenishment.
Deep-frozen and ultra-low facilities below -20 °C are projected to grow at 11.87% CAGR as mRNA vaccines and cell therapies proliferate. These sites demand redundant cascade refrigeration, liquid nitrogen backups, and validated monitoring systems, driving capital intensity to three times conventional frozen builds. Capacity bottlenecks in biotech corridors have inflated lease rates by 40% versus food-grade space. Ambient-controlled rooms (15-25 °C) are a modest but rising niche for products like chocolate and specialty chemicals, offering energy savings but requiring dehumidification and tight thermal envelopes to avoid excursions.
By Application: Pharmaceutical Premium Pricing
Meat and poultry led with 22.63% share in 2025, leveraging well-established farm-to-retail corridors and specialized blast-freezing infrastructure. Growth, however, moderates as consumers pivot toward fresh and prepared alternatives, curbing utilization in facilities dependent on bulk frozen protein. Fish and seafood benefit from aquaculture imports routed through Gulf Coast ports, necessitating port-adjacent cold storage equipped for rapid transloading and repackaging. Dairy and frozen desserts maintain resilient demand, though rising plant-based alternatives call for distinct temperature and humidity regimes.
Vaccines and clinical trial materials, advancing at a 14.11% CAGR through 2031, now form a parallel premium tier in the US cold chain logistics market size. GDP-compliant providers command lease rates up to USD 22 per ft² in Boston compared to USD 8-12 for food-grade space, reflecting the value at risk. Fruits and vegetables logistics are evolving under federal food-waste targets that push for ethylene-scrubbing systems and IoT freshness sensors. Ready-to-eat meals ride meal-kit demand, necessitating multiproduct assembly lines within temperature-graded docks. Specialty chemicals represent a stable, smaller slice, but their stringent temperature windows make them sticky clients for compliant operators.
Geography Analysis
The Southeast dominated with 34.17% market share in 2025, driven by Latin American produce inflows via Florida, seafood through Gulf ports, and Georgia’s poultry processing base. Population migration into Atlanta, Charlotte, and Nashville is fueling retail cold chain expansion, while hurricane risk spurs investment in elevated structures, hurricane-rated cladding, and on-site generators. Lease rates and land values have climbed as operators compete for infill plots capable of two-hour e-commerce delivery.
The Southwest is projected to expand at an 11.02% CAGR to 2031, anchored by Texas, where cross-border nearshoring, population growth, and petrochemical demand converge. Laredo and El Paso crossings channel increasing refrigerated cargo from Mexican produce regions. Grid instability under ERCOT forces developers to budget USD 3-5 million for redundant power systems on top of standard construction costs. Phoenix and Tucson serve as fast-growing secondary nodes, yet water scarcity raises long-term sustainability questions for desert agriculture feeding these facilities.
The Northeast hosts the densest concentration of biotech and pharmaceutical firms, making Boston, New Jersey, and Philadelphia epicenters for ultra-low-temperature projects with lease premiums exceeding USD 20 per ft². Aging infrastructure in the Midwest, where Illinois and Wisconsin house major meat and dairy processors, requires simultaneous refrigerant retrofits and automation upgrades, straining capital budgets. The West remains a study in contrast: California’s robust agricultural output and Asia-facing ports propel demand, yet aggressive environmental regulations and peak-power pricing challenge operator economics. Public grants such as the California Energy Commission’s retrofit funding mitigate some capital pressure, signaling a policy environment that rewards early adopters of natural refrigerants.
Competitive Landscape
Lineage Logistics and Americold collectively control a majority of national refrigerated warehouse cubic footage, establishing quasi-oligopolistic leverage in key metros. Their scale enables multi-facility customer contracts, diversified energy hedging, and accelerated automation rollouts, creating cost positions smaller competitors cannot match. Second-tier operators respond by specializing: some pivot to GDP-compliant pharma services, others serve ethnic food distributors requiring bespoke handling, and a few focus on last-mile urban facilities where mega-warehouse footprints are impractical.
Technology adoption delineates winners from laggards. Leading providers deploy IoT telemetry, machine-learning demand forecasts, and blockchain traceability, providing clients with shipment-level visibility that reduces spoilage claims. The Global Cold Chain Alliance reported its members expanded capacity to 8.16 billion ft³ in 2025, yet the number of operators shrank, illustrating capacity growth via consolidation rather than new entrants[4]Global Cold Chain Alliance, “2025 Global Top 25 List,” gcca.org . Parcel integrators UPS and FedEx are investing heavily in healthcare cold chain lanes, leveraging existing air networks to offer end-to-end solutions that traditional warehouse operators struggle to match. Private-equity funding remains active, channeling capital into greenfield mega-projects in port and inland rail nodes, further intensifying competition for mid-tier independents.
US Cold Chain Logistics Industry Leaders
Lineage Logistics Holdings, LLC
Americold Logistics, LLC
United States Cold Storage, Inc.
Interstate Warehousing
FreezPak Logistics
- *Disclaimer: Major Players sorted in no particular order


Recent Industry Developments
- May 2025: Lineage Logistics announced a USD 1 billion expansion with Tyson Foods, adding 49 million ft³ via acquisition and committing two automated builds totaling 80 million ft³.
- April 2025: DHL Group earmarked EUR 2 billion (USD 2.34 billion) through 2030, with half for the Americas, to scale GDP-certified pharma hubs and temperature-controlled transport.
- April 2025: The Global Cold Chain Alliance reported members now operate 8.16 billion ft³ of refrigerated space worldwide, up 10% year-over-year, with North America representing 5 billion ft³.
- March 2025: The California Energy Commission granted USD 5 million to replace freon systems with ammonia refrigeration, reducing electricity use by 2.45 million kWh annually.


Research Methodology Framework and Report Scope
Market Definitions and Key Coverage
Mordor Intelligence defines the United States cold chain logistics market as the full spectrum of temperature-controlled storage and transportation services that keep perishable foods, pharmaceuticals, biologics, and specialty chemicals within their mandated temperature bands from the first point of consolidation through domestic distribution. The study tracks revenues generated by public and private refrigerated warehouses, refrigerated road, rail, sea, and air moves, and value-added services such as consolidation, blast-freezing, and repacking.
Scope exclusion: dry-ice courier parcels handled only within hospital campuses are outside our definition.
Segmentation Overview
- By Service Type
- Refrigerated Storage
- Refrigerated Transportation
- Road
- Rail
- Sea
- Air
- Value-Added Services
- By Temperature Type
- Chilled (0–5 °C)
- Frozen (-18–0 °C)
- Ambient
- Deep-Frozen / Ultra-Low (More than 20 °C)
- By Application
- Fruits & Vegetables
- Meat & Poultry
- Fish & Seafood
- Dairy & Frozen Desserts
- Bakery & Confectionery
- Ready-to-Eat Meals
- Pharmaceuticals & Biologics
- Vaccines & Clinical Trial Materials
- Chemicals & Specialty Materials
- Other Perishables
- By Region (United States)
- Northeast
- Midwest
- Southeast
- Southwest
- West
Detailed Research Methodology and Data Validation
Primary Research
Semi-structured interviews with 3PL executives, grocery e-commerce managers, pharmaceutical supply-chain directors, and cold-warehouse developers across California, Texas, the Midwest, and the Northeast helped validate capacity utilizations, reefer rate inflation, and ASP progression assumptions. Follow-up surveys captured regional variance in biologics shipment volumes, enabling us to fine-tune temperature-mix splits.
Desk Research
Our analysts began with publicly available datasets, such as the USDA National Cold Storage Capacity survey, the FDA's FSMA compliance records, the Census Bureau Commodity Flow Survey, International Trade Administration import statistics, and industry briefs from the Food Marketing Institute. Annual reports and 10-Ks from major temperature-controlled logistics operators were mined for capacity builds, utilization, and average selling price trends, which are then cross-referenced in D&B Hoovers and Dow Jones Factiva for consistency. Academic journals covering refrigeration efficiency and perishables spoilage, along with patents flagged in Questel, provided additional demand signals for ultra-low-temperature infrastructure. This list is illustrative, not exhaustive; many other secondary sources aided data gathering and clarification.
Market-Sizing & Forecasting
A top-down demand-pool model reconstructs the tonnage and value of perishables produced domestically plus chilled and frozen imports, which are then allocated to storage and transport nodes using historic throughput ratios. Selective bottom-up checks, such as sampled pallet positions multiplied by average lease rates and major carrier reefer fleets multiplied by lane yields, calibrate totals. Key variables include cubic feet of public refrigerated space, e-grocery penetration, biologics NMEs in Phase III trials, diesel and electricity tariffs, and average outbound reefer spot rates. Forecasts employ a multivariate regression blended with scenario analysis to reflect shifts in e-commerce adoption and biologics approvals, while gap areas in bottom-up counts are bridged by conservative load-factor assumptions.
Data Validation & Update Cycle
Outputs pass variance screens against USDA inventory swings, FMCSA reefer-truck counts, and Bureau of Labor Statistics energy indices. Senior analysts review anomalies before sign-off. Reports refresh yearly, and material events trigger interim updates, ensuring clients always receive the freshest baseline.
Why Mordor's US Cold Chain Logistics Baseline Earns Decision-Maker Trust
Estimates published across the industry often diverge because firms differ on which services they count, the temperature ranges they include, and how frequently they refresh assumptions.
Key gap drivers span scope; some studies bundle dry ice parcel couriers or global monitoring devices, forecast stance; certain publishers apply double-digit growth uplifts from aggressive automation scenarios, and currency-conversion timing. Mordor anchors results to audited domestic capacity and verified perishables flow, applies measured ASP progressions, and refreshes figures each year, thereby avoiding outdated or inflated baselines.
Benchmark comparison
| Market Size | Anonymized source | Primary gap driver |
|---|---|---|
| USD 91.14 B | Mordor Intelligence | - |
| USD 83.9 B (2024) | Global Consultancy A | excludes ultra-low-temperature pharmaceutical moves |
| USD 109.5 B (2024) | Research Firm B | bundles Canada volumes and monitoring-device hardware sales |
| USD 34.67 B (2024) | Industry Study C | models only third-party revenue, omits captive in-house storage |
The comparison shows that once differing scopes and assumptions are isolated, Mordor's balanced, transparent approach supplies a dependable baseline that executives can trace back to clear variables and repeatable steps.


Key Questions Answered in the Report
How large is the US cold chain logistics market in 2026?
It reached USD 97.13 billion in 2026 and is forecast to grow to USD 133.87 billion by 2031.
Which service type leads the US cold chain logistics market?
Refrigerated storage held a 57.53% share in 2025, underpinned by its role as the primary buffer between production and retail.
What is the fastest-growing temperature band?
Deep-frozen and ultra-low storage below -20 °C is projected to post an 11.87% CAGR through 2031, driven by mRNA vaccines and cell therapies.
Which region is expanding most rapidly?
The Southwest, led by Texas, is advancing at an 11.02% CAGR to 2031 owing to cross-border trade and population growth.
Who are the dominant players?
Lineage Logistics and Americold control a majority of national refrigerated warehouse capacity, creating a quasi-duopoly in many metros.
Page last updated on:


