United States Food Truck Market Size and Share
Market Overview
| Study Period | 2020 - 2031 |
|---|---|
| Forecast Data Period | 2026 - 2031 |
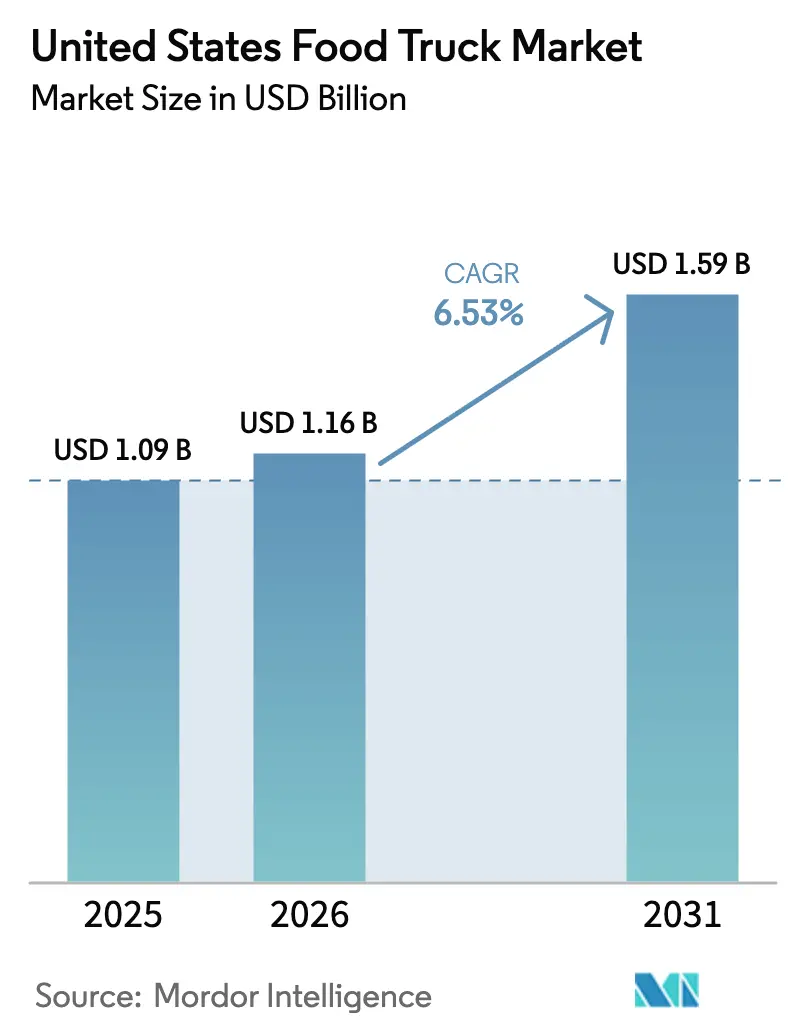
| Base Year Market Size (2025) | USD 1.09 Billion |
| Market Size (2026) | USD 1.16 Billion |
| Market Size (2031) | USD 1.59 Billion |
| Growth Rate (2026 - 2031) | 6.53% CAGR |
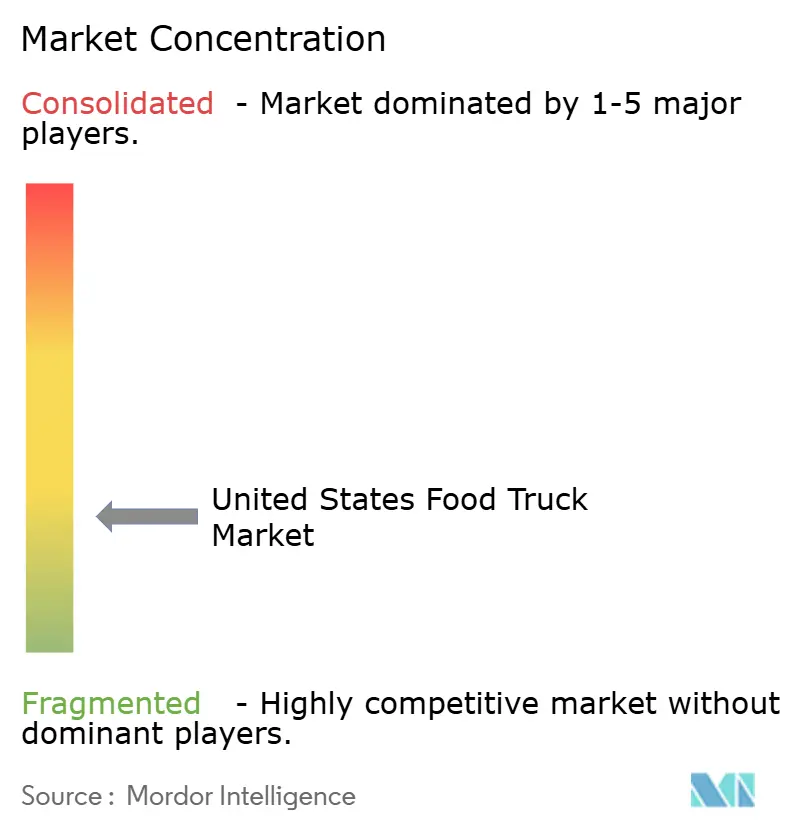
| Market Concentration | Low |
Major Players
*Disclaimer: Major Players sorted in no particular order Image © Mordor Intelligence. Reuse requires attribution under CC BY 4.0. |
|
United States Food Truck Market Analysis by Mordor Intelligence
The United States food truck market size is expected to grow from USD 1.09 billion in 2025 to USD 1.16 billion in 2026 and is forecast to reach USD 1.59 billion by 2031 at 6.53% CAGR over 2026-2031. Rising urban preference for mobile dining, the appeal of experiential street cuisine, and rapid adoption of digital ordering tools are shaping demand. Operators expand beyond traditional downtown lunch crowds into evening entertainment districts, corporate campuses, and university quads, creating all-day revenue streams. Trailers remain the first choice for budget-conscious entrepreneurs, while customized trucks gain traction as premium, tech-ready platforms. Growth is geographically uneven; permissive regulatory climates in the South sustain the largest cluster of operators, whereas California’s innovation ecosystem propels technology-centric models despite higher compliance costs. Competitive pressure from ghost kitchens and escalating protein prices challenge margins, prompting intensified focus on operational efficiency and menu differentiation.
Key Report Takeaways
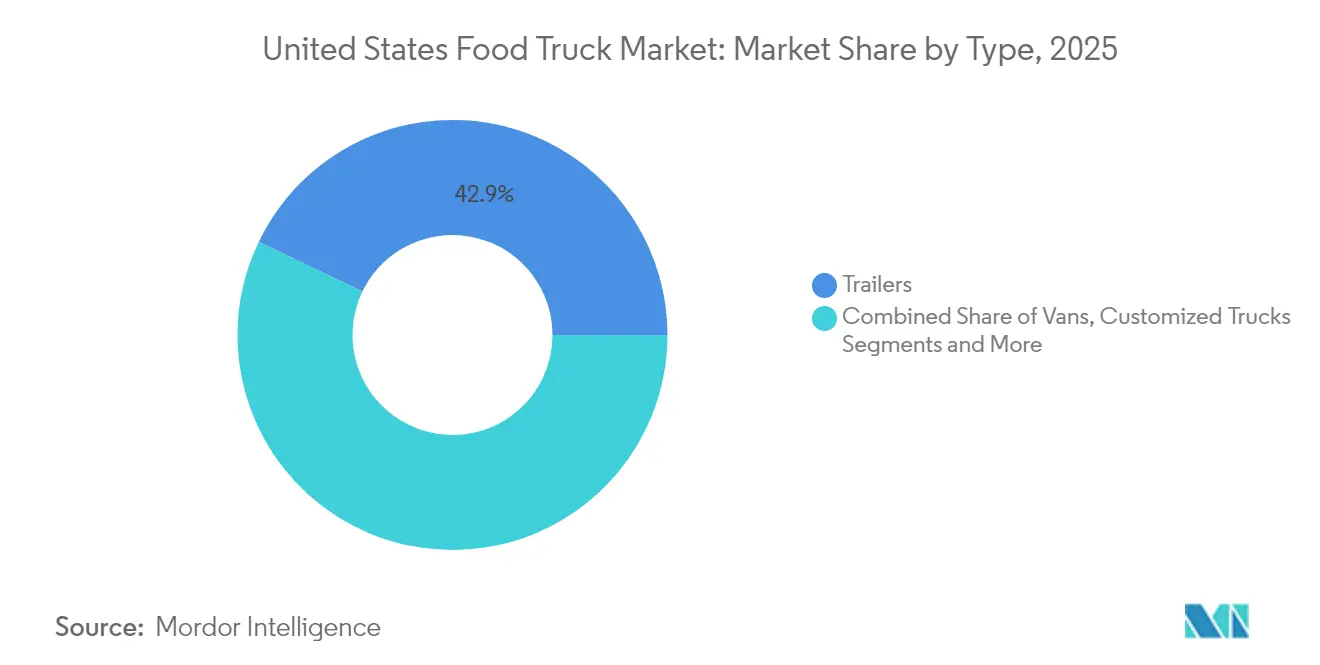
- By type, trailers held 42.85% of the United States food truck market share in 2025; customized trucks are forecast to expand at a 8.78% CAGR through 2031.
- By application, fast food accounted for 47.10% of the United States food truck market size in 2025, while vegan and plant-based menus are projected to grow at an 11.10% CAGR to 2031.
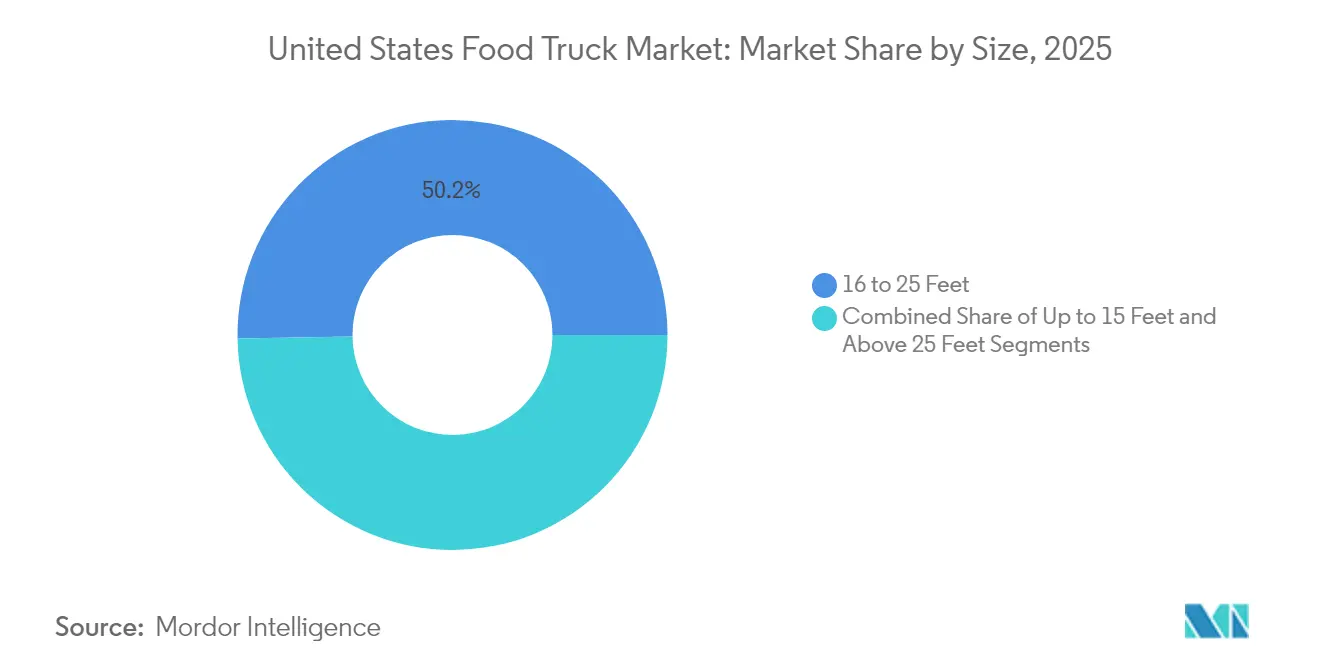
- By size, the 16-25-foot segment captured 50.25% revenue share in 2025; units up to 15 feet show the fastest CAGR at 6.55% through 2031.
- By ownership model, independent operators controlled 85.60% of the United States food truck market in 2025, but franchise concepts are rising at an 7.86% CAGR.
- By region, the South led with a 35.80% revenue share in 2025; the West region is the fastest growing, with a 6.70% CAGR to 2031.
Note: Market size and forecast figures in this report are generated using Mordor Intelligence’s proprietary estimation framework, updated with the latest available data and insights as of 2026.
Worldwide, activity is shaped by contributions from multiple countries and regions, with United states representing one among them. The global report on food truck market by Mordor Intelligence reflects how these countries and regional layers combine into a single system.
United States Food Truck Market Trends and Insights
Drivers Impact Analysis*
| Driver | (~) % Point Impact on Market CAGR | Geographic Relevance | Impact Timeline |
|---|---|---|---|
| Post-Pandemic Surge in Urban Outdoor Dining Culture | +1.8% | National, with Concentration in Metropolitan Areas | Medium term (2–4 years) |
| Growing Corporate and University Campus Contracts | +1.2% | Northeast and West, Expanding to Midwest | Long term (≥ 4 years) |
| Surge in Franchised Food-Truck Chains | +1.1% | National, led by South and West Regions | Long term (≥ 4 years) |
| Advanced Digital POS and Ordering Apps | +0.9% | National, with Urban Concentration | Short term (≤ 2 years) |
| Rising Demand for Plant-Based and Allergen-Free Menus | +0.7% | West and Northeast, Spreading Nationally | Medium term (2–4 years) |
| Tax Incentives in Opportunity-Zone Districts | +0.3% | Targeted Urban Areas Across all Regions | Long term (≥ 4 years) |
| Source: Mordor Intelligence | |||
Post-pandemic Surge in Urban Outdoor Dining Culture
The transformation of urban dining preferences has fundamentally altered food truck positioning from a convenience option to an experiential destination. 63.6% of food truck operators surveyed reported the evening (5 – 8 PM) as their peak business hours[1]"Food Truck Statistics", Food Liability Insurance Program, fliprogram.com.. This shift reflects deeper behavioral changes where outdoor dining became normalized during pandemic restrictions and persisted as a lifestyle preference. Corporate event planners increasingly specify food trucks for employee engagement, recognizing their ability to create memorable experiences while managing costs below traditional catering rates of USD 70-120 per person[2]"The Complete Pricing Guide to Catering Costs in 2024", Food Truck Association Los Angeles, ftala.org.. The trend extends beyond metropolitan areas, with over 60% of the fastest-growing food truck markets located in smaller cities where outdoor dining infrastructure was previously limited. This geographic expansion creates opportunities for operators willing to pioneer secondary markets while established urban areas face increasing competition and regulatory complexity.
Growing Corporate and University Campus Contracts
Institutional food service contracts represent the sector's most stable revenue stream, with universities and corporate campuses seeking alternatives to traditional cafeteria models. Food trucks provide cost-effective solutions for institutions facing budget constraints while offering students and employees diverse culinary options that enhance campus life. California State University Long Beach's pre-approved vendor system exemplifies institutional adoption, requiring food trucks to meet insurance and food handling standards while streamlining procurement processes. Corporate contracts typically guarantee minimum sales of USD 800 per three-hour service period, providing revenue predictability that enables operators to invest in equipment upgrades and staff training[3]"Weekly Food Truck Service (for colleges, corporations, cities, parks, or other locations)", Washington State Food Truck Association, wafoodtrucks.org. . The Washington State Food Truck Association's systematic approach to corporate partnerships demonstrates how organized industry efforts can create sustainable business models. These institutional relationships also serve as testing grounds for menu innovation, with successful items often migrating to public-facing operations.
Surge in Franchised Food-Truck Chains
The franchise model addresses key independent operator challenges, including marketing expertise, supply chain optimization, and operational standardization that drive profitability. Cousins Maine Lobster and Frios Gourmet Pops represent successful niche positioning within franchise frameworks, proving specialized concepts can achieve national scale while maintaining quality standards. Franchise fees typically range from USD 15,000 to USD 50,000, with total investments between USD 90,000 and USD 175,000, positioning franchised units competitively against independent startups[4]"Kona Ice Franchise Cost and Requirements for 2025", International Franchise Professionals Group (IFPG), ifpg.org.. The franchise model's appeal extends to semi-absentee ownership structures, enabling entrepreneurs to maintain primary employment while building food service businesses.
Advanced Digital POS and Ordering Apps
Technology integration transforms food truck operations from cash-based transactions to comprehensive digital ecosystems that enhance customer experience and operational efficiency. Advanced systems like GloriaFood POS offer gesture controls, QR code payments, and offline processing capabilities specifically designed for mobile food service constraints. The integration of AI-powered analytics enables predictive demand forecasting and menu optimization, with 66% of diners preferring mobile ordering options. Cloud-based systems provide real-time visibility across multiple locations for franchise operators while enabling independent operators to compete through professional presentation and streamlined service. Technology adoption correlates directly with profitability, as operators using advanced POS systems report higher customer satisfaction and reduced wait times that drive repeat business and positive social media engagement.
Restraints Impact Analysis*
| Restraint | (~) % Point Impact on Market CAGR | Geographic Relevance | Impact Timeline |
|---|---|---|---|
| Escalating Parking-Permit and Commissary Fees | -1.4% | Urban Areas Nationwide, Particularly Northeast | Short term (≤ 2 years) |
| Labor Shortages in Commercial Driving and Culinary Staff | -1.1% | National, with Acute Impact in Rural Areas | Medium term (2–4 years) |
| Volatile Protein and Packaging Input Costs | -0.8% | National, with Regional Price Variations | Short term (≤ 2 years) |
| Intensifying Competition from Ghost Kitchens | -0.5% | Metropolitan Areas, Primarily West and Northeast | Medium term (2–4 years) |
| Source: Mordor Intelligence | |||
Escalating Parking-Permit and Commissary Fees
Municipal revenue pressures drive permit cost inflation that disproportionately impacts smaller operators while creating barriers to market entry. Urban parking fees range from USD 100-500 per day in metropolitan areas compared to USD 50-150 in suburban locations, with additional commissary kitchen rentals averaging USD 400-1,500 monthly across major markets. Boston's permit structure exemplifies regulatory complexity, with total startup costs reaching USD 28,276, while Indianapolis offers more accessible entry at significantly lower fees. California's mobile food facility permits can reach USD 1,000 annually, with additional local requirements creating cumulative cost burdens that favor established operators over new entrants. The regulatory fragmentation across jurisdictions creates operational complexity for operators seeking to expand geographically, with each municipality maintaining distinct requirements for licensing, health inspections, and operational parameters. These escalating costs force operators to optimize high-traffic locations and develop premium menu offerings to maintain profitability margins.
Labor Shortages in Commercial Driving and Culinary Staff
The broader trucking industry's driver shortage of 80,000 positions, projected to exceed 160,000 by 2030, directly impacts food truck operations through reduced labor availability and wage inflation. Food truck operators compete with traditional restaurants for culinary talent while requiring additional commercial driving qualifications that limit candidate pools. Immigration policy changes create additional workforce constraints, with increased scrutiny on documentation and work permits affecting traditionally immigrant-heavy food service sectors. Competitive wages for food truck employees range from USD 16-20 per hour across major markets, with payroll taxes adding 10-15% to labor costs. California's USD 20 minimum wage for fast-food workers, while improving candidate quality, forces menu price increases and operational efficiency investments that smaller operators struggle to implement. Labor shortages drive technology adoption as operators invest in automated systems and streamlined processes to reduce staffing requirements while maintaining service quality.
*Our forecasts treat driver/restraint impacts as directional, not additive. The impact forecasts reflect baseline growth, mix effects, and variable interactions.
Segment Analysis
By Type: Trailers Dominate Despite Customization Trends
Trailers command 42.85% market share in 2025, reflecting their lower acquisition costs and simplified maintenance requirements that appeal to cost-conscious operators entering the market. The segment's dominance stems from regulatory advantages in many jurisdictions where trailers face fewer commercial vehicle requirements than self-propelled units. Despite representing a smaller current share, customized trucks demonstrate the strongest growth trajectory at 8.78% CAGR through 2031, driven by operators seeking differentiation through specialized equipment and branded designs that enhance customer experience.
Vans occupy a niche position serving urban markets where maneuverability and parking constraints favor compact units, while expandable trucks represent emerging innovation in space optimization technology. The expandable segment addresses fundamental space limitations through hydraulic or mechanical expansion systems that double interior capacity during service periods. Texas Cart Builder's implementation of 3D modeling software for custom food truck manufacturing exemplifies the technological sophistication driving the customized truck segment's growth. The type segmentation reflects broader market maturation where initial cost considerations give way to operational efficiency and brand differentiation as competitive factors.


By Application: Fast Food Leadership Challenged by Specialty Growth
Fast food maintains a 47.10% market share in 2025, leveraging operational simplicity and broad consumer appeal to enable rapid service and predictable margins. However, vegan and plant-based applications surge at an 11.10% CAGR, reflecting demographic shifts toward sustainable dining options and corporate campus contracts prioritizing dietary diversity. This growth trajectory positions plant-based applications to capture significant market share as Gen Z consumers enter peak earning years and influence corporate food service decisions.
BBQ and snacks represent established segments with steady demand driven by event catering and festival participation, while desserts and confectionery target premium pricing opportunities through artisanal positioning. Fresh produce and beverages capitalize on health-conscious trends while offering higher margins than traditional fast food applications. The application diversity reflects market sophistication, where operators differentiate through culinary specialization rather than competing solely on convenience and price. Food trucks increasingly serve as testing grounds for restaurant concepts, with successful menu items often transitioning to brick-and-mortar establishments, creating symbiotic relationships between mobile and fixed food service operations.
By Size: Mid-Range Units Balance Efficiency and Capacity
The 16 to 25 feet segment dominates with 50.25% market share in 2025, representing an optimal balance between operational capacity and regulatory compliance across most jurisdictions. This size range accommodates full kitchen equipment while remaining maneuverable in urban environments and compliant with standard commercial vehicle regulations. Compact units up to 15 feet experience the fastest growth at 6.55% CAGR, driven by urban density constraints and lower operational costs that appeal to startup operators and niche applications.
Units above 25 feet serve specialized applications requiring extensive equipment or high-volume capacity but face increasing regulatory restrictions and operational challenges in urban markets. The size segmentation reflects operational trade-offs between capacity, maneuverability, and regulatory compliance that vary significantly across geographic markets. Compact units benefit from reduced fuel costs, simplified parking, and lower permit fees in many jurisdictions, while larger units enable menu diversity and higher revenue potential through expanded service capacity. The growth in compact units aligns with urban densification trends and sustainability preferences that favor smaller, more efficient mobile food service operations.
By Ownership Model: Independence Prevails Amid Franchise Consolidation
Independent operators maintain 85.60% market share in 2025, reflecting the sector's entrepreneurial character and low barriers to entry that enable individual ownership. However, franchise and chain-affiliated models grow at 7.86% CAGR through 2031, driven by operational support, marketing resources, and proven business models that enhance profitability and scalability. The franchise growth trajectory suggests market maturation where professional management and standardized operations increasingly determine competitive success.
Independent operators benefit from menu flexibility, local market adaptation, and higher profit margins but face challenges in marketing, supply chain optimization, and operational standardization that franchises address systematically. The ownership model segmentation reflects broader small business trends where independent operators compete through personalization and local relationships, while franchises leverage scale advantages and professional systems. Successful independent operators increasingly adopt franchise-like practices, including standardized recipes, professional branding, and systematic marketing, to compete effectively against franchised competitors. The segment dynamics suggest eventual market bifurcation between highly professional independent operators and franchise systems, with casual operators facing increasing competitive pressure.
Geography Analysis
The South captured 35.80% of the United States food truck market in 2025, anchored by city governments in Texas and Tennessee that streamline permit approvals and cap daily fees. Texas's average annual operator revenue hits USD 437,843, supported by an outdoor festival calendar that runs nearly year-round. Lower commercial rents let proprietors rent commissary kitchens at modest rates, shortening break-even horizons. Southern operators also benefit from abundant culinary talent drawn to robust hospitality sectors in Austin and New Orleans.
The West leads on growth momentum with a 6.70% CAGR outlook through 2031. California’s average operator turnover of USD 482,751 underscores strong consumer willingness to pay for premium street fare. Stringent health standards push investment in stainless-steel interiors, water-saving sinks, and electric refrigeration, aligning with broader state sustainability regulations. Operators who absorb higher entry costs gain access to dense, high-income customer bases that reward menu innovation and technology-enabled service.
The Northeast and Midwest face heavier regulatory drag yet offer lucrative urban clusters. New York vendors post the nation’s highest annual revenue at USD 492,545 but navigate complex multi-agency permitting and stringent parking enforcement. Boston’s USD 28,276 start-up fee package restricts competition, favoring experienced, capitalized players. In the Midwest, college towns and corporate parks represent emerging anchors for weekday volume, where administrators seek flexible alternatives to cafeteria refreshes. Operators who master regional route planning and jurisdiction-by-jurisdiction compliance can lift utilization rates toward Southern benchmarks, narrowing profitability gaps.
Competitive Landscape
Competition in the United States food truck market remains fragmented; no single operator holds more than a low-single-digit share. Independent entrepreneurs account for 86.23% of units, reflecting modest start-up costs and localized dining cultures. Yet franchise groups expand at an 8.14% CAGR by standardizing operations, investing in national marketing, and tying in integrated loyalty apps. Kona Ice, Cousins Maine Lobster, and Frios Gourmet Pops illustrate how specialized menu focus and disciplined brand management convert mobile platforms into national networks.
Technology adoption fuels performance differentiation. Operators deploying cloud POS software gain real-time inventory visibility and can rebalance stock between trucks before high-volume events. Data analytics guide menu rotation to hedge against protein price spikes, while social-media-driven geofencing amplifies local reach. Investors note these scale enablers; Roark Capital’s USD 1 billion acquisition of Dave’s Hot Chicken, a concept that began as a USD 900 parking-lot pop-up, underscores the potential for mobile origins to evolve into multichannel brands.
Ghost kitchens, though struggling with oversupply, still shape competitive responses. Hybrid players combine daytime street service with off-peak commissary use for delivery-only orders, lifting asset utilization. Supply-chain partners, including broadline distributor Sysco, deepen mobile-specific offerings such as condensed case sizes and recyclable packaging formats. The fragmented landscape favors operators who integrate professional management practices without sacrificing the personal touch that draws customers to street food.
United States Food Truck Industry Leaders
-
Prestige Food Trucks
-
United Food Truck LLC
-
M&R Specialty Trailers and Trucks
-
MSM Catering Trucks Mfg. Inc.
-
Custom Concessions
- *Disclaimer: Major Players sorted in no particular order

Recent Industry Developments
- June 2025: Dave's Hot Chicken completed acquisition by Roark Capital for approximately USD 1 billion, marking the largest food truck-originated concept exit in industry history. The transaction validates mobile food service as a viable pathway to restaurant chain development and demonstrates investor confidence in concepts that successfully scale from food truck origins.
- March 2025: Cousin's Maine Lobster (CML), the top fast-casual lobster roll brand, is ramping up its expansion in Buffalo, Rochester, and Syracuse, debuting a second food truck in the area, a mere nine months after its initial entry.
- March 2024: The National Park of Boston in the United States announced the call for bids for food truck vendors to operate at the Charlestown Navy Yard through a Request for Bids (RFB) proposal. The administration is willing to lease two spaces identified by the National Park Service (NPS) as suitable for mobile food and beverage vending in the Charlestown Navy Yard at Boston National Historical Park. Further, the administration stated that the minimum rent for the lease is USD 40 per shift per day.


United States Food Truck Market Report Scope
A food truck is a large motorized vehicle such as a van, multi-stop truck, or trailer equipped to store, transport, cook, and sell food. Some food trucks also have an on-board kitchen, which can utilized to prepare food from scratch.
The US food truck market is segmented by type, application, and size. By type, the market is segmented into vans, trailers, customized trucks, and others (expandable food trucks, etc.). By application, the market is segmented into fast food, vegan and plant meat, barbeque and snacks, desserts and confectionery, and others (fruits and vegetables, etc.). By size, the market is segmented into up to 15 feet, 16-25 feet, and above 25 feet.
The report offers market size and forecasts for food trucks in value (USD) for all the above segments.
| Vans |
| Trailers |
| Customized Trucks |
| Expandable Trucks |
| Fast Food |
| Vegan and Plant-based |
| BBQ and Snacks |
| Desserts and Confectionery |
| Fresh Produce and Beverages |
| Up to 15 Feet |
| 16 to 25 Feet |
| Above 25 Feet |
| Independent |
| Franchise/Chain-affiliated |
| Northeast |
| Midwest |
| South |
| West |
| By Type | Vans |
| Trailers | |
| Customized Trucks | |
| Expandable Trucks | |
| By Application | Fast Food |
| Vegan and Plant-based | |
| BBQ and Snacks | |
| Desserts and Confectionery | |
| Fresh Produce and Beverages | |
| By Size | Up to 15 Feet |
| 16 to 25 Feet | |
| Above 25 Feet | |
| By Ownership Model | Independent |
| Franchise/Chain-affiliated | |
| By Region | Northeast |
| Midwest | |
| South | |
| West |


Key Questions Answered in the Report
What is the current size of the United States food truck market?
The United States food truck market stands at USD 1.16 billion in 2026.
How fast will the United States food truck market grow through 2031?
The market is forecast to expand at a 6.53% CAGR, reaching USD 1.59 billion by 2031 over 2026-2031.
Which type of food truck leads the market?
Trailers remain on top with 42.85% market share in 2025, favored for lower entry costs.
Where is regional growth strongest?
The West, led by California, shows the fastest CAGR at 6.70% over the forecast period.
Are franchises gaining ground in the sector?
Yes. Franchise and chain-affiliated units are growing at an 7.86% CAGR, providing standardized operations and marketing scale.
Page last updated on:


