United States Blood Pressure Monitoring Devices Market Size and Share
Market Overview
| Study Period | 2020 - 2031 |
|---|---|
| Forecast Data Period | 2026 - 2031 |
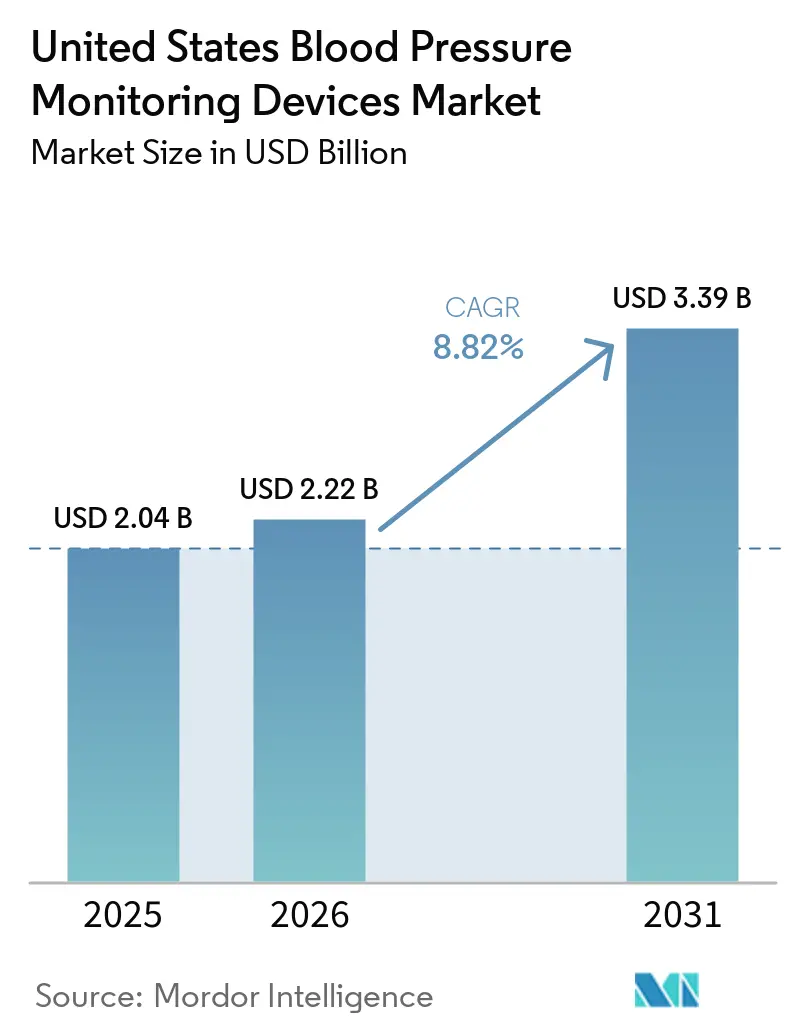
| Base Year Market Size (2025) | USD 2.04 Billion |
| Market Size (2026) | USD 2.22 Billion |
| Market Size (2031) | USD 3.39 Billion |
| Growth Rate (2026 - 2031) | 8.82% CAGR |
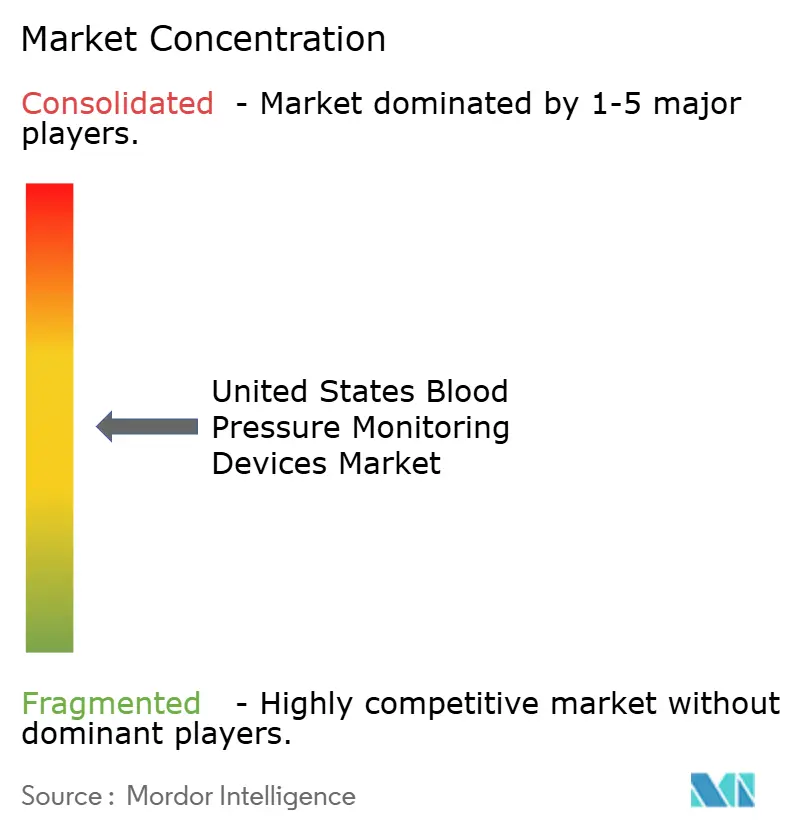
| Market Concentration | Medium |
Major Players *Disclaimer: Major Players sorted in no particular order Image © Mordor Intelligence. Reuse requires attribution under CC BY 4.0. | |
United States Blood Pressure Monitoring Devices Market Analysis by Mordor Intelligence
The United States Blood Pressure Monitoring Devices Market size was valued at USD 2.04 billion in 2025 and is estimated to grow from USD 2.22 billion in 2026 to reach USD 3.39 billion by 2031, at a CAGR of 8.82% during the forecast period (2026-2031).
Growth in the market is being sustained by the country’s large uncontrolled hypertensive population, because 119.9 million adults have hypertension and only 20.7% remain controlled below 130/80 mmHg under the latest national measurement window. The 2025 AHA and ACC guideline gave home monitoring a more central place in treatment pathways, which widened the role of device use across primary care, specialty care, and community programs in the United States blood pressure monitoring devices market. Demand is also shifting toward connected systems that fit remote care workflows, because providers now place more value on validated data flow, EHR compatibility, and continuous patient engagement than on hardware performance alone. Competitive positioning in the United States blood pressure monitoring devices market increasingly depends on the ability to combine validation, software integration, and reimbursement alignment, which favors suppliers that can serve both institutional and home-based monitoring models. The regulatory stance on cuffless devices is becoming stricter at the same time, which supports a two-tier market where clinically validated platforms are likely to gain faster access to premium accounts in the United States blood pressure monitoring devices market.
Key Report Takeaways
- By product type, aneroid blood pressure monitors held 36.31% of 2025 revenue, while digital blood pressure monitors are projected to expand at an 11.38% CAGR through 2031.
- By technology, traditional non-smart devices accounted for 63.24% of revenue in 2025, while smart connected devices are forecast to grow at a 10.52% CAGR through 2031.
- By end user, hospitals and clinics held 65.52% of 2025 revenue, while home healthcare settings are expected to advance at a 10.25% CAGR through 2031.
- By distribution channel, institutional direct sales and group purchasing represented 35.24% of 2025 revenue, while e-commerce is projected to grow at a 9.83% CAGR through 2031.
- By application, hypertension diagnosis and ongoing management accounted for 68.44% share of the United States blood pressure monitoring devices market size in 2025, while remote patient monitoring is expected to grow at a 12.53% CAGR through 2031.
Note: Market size and forecast figures in this report are generated using Mordor Intelligence’s proprietary estimation framework, updated with the latest available data and insights as of January 2026.
United States Blood Pressure Monitoring Devices Market Trends and Insights
Drivers Impact Analysis*
| Driver | (~) % Impact on CAGR Forecast | Geographic Relevance | Impact Timeline |
|---|---|---|---|
| High Uncontrolled Hypertension Burden | +2.5% | National, highest intensity in Southern states and non-Hispanic Black communities | Medium term (2-4 years) |
| RPM Reimbursement Supporting Connected Monitoring | +2.2% | National, with early gains in ACO-enrolled populations and telehealth-active states | Short term (≤ 2 years) |
| Home-Based Chronic-Care Management Adoption | +1.8% | National, accelerating in rural and underserved communities | Medium term (2-4 years) |
| Validated-Device Initiatives Improving Clinician Confidence | +1.0% | National, with early gains in primary care and community health centers | Medium term (2-4 years) |
| Maternal-Health Remote Monitoring Expansion | +0.7% | National, concentrated in high-risk obstetric centers in Southern and Midwestern states | Long term (≥ 4 years) |
| Source: Mordor Intelligence | |||
High Uncontrolled Hypertension Burden
The strongest demand base in the United States blood pressure monitoring devices market comes from low control rates rather than rising prevalence, because national prevalence has stayed near the same broad range for years while control remains weak. During August 2021 to August 2023, only 20.7% of hypertensive adults had blood pressure controlled below 130/80 mmHg, which left a very large pool of patients needing repeated measurement and follow-up. That care burden cannot be managed through occasional office visits alone, since 94.9 million adults are recommended for lifestyle modification and medication support under current clinical guidance[1]Donald W. Jones et al., “2025 AHA/ACC Guideline for the Prevention, Detection, Evaluation and Management of High Blood Pressure in Adults,” Journal of the American College of Cardiology, jacc.org. The 2025 AHA and ACC guideline reinforced this demand pattern by making home blood pressure monitoring a standard part of hypertension management and by linking treatment decisions more closely to out-of-office data. The demand runway is even broader among younger adults and men, where control rates remain lower, which points to sustained adoption potential for app-linked and easy-to-use devices in the United States blood pressure monitoring devices market.
RPM Reimbursement Supporting Connected Monitoring
Connected monitoring is gaining traction because reimbursement now supports a wider set of remote care workflows, which improves the provider business case for keeping hypertensive patients under continuous observation. This shift matters in the United States blood pressure monitoring devices market because the cost of adoption moves away from the patient alone and becomes part of an organized care pathway managed by health systems and physician groups. Providers can justify a larger installed base of connected cuffs when monitored readings feed chronic care programs, billing workflows, and risk-management models at the same time. Cellular-enabled devices benefit more than Bluetooth-only devices in these settings, because they reduce the number of patient actions required before data reaches the care team. Reimbursement design is therefore shaping product strategy in the United States blood pressure monitoring devices market almost as strongly as accuracy, especially for vendors selling into large RPM programs.
Home-Based Chronic-Care Management Adoption
Home care is becoming a primary treatment setting rather than a secondary one, because hypertension management now depends more on repeated readings over time than on occasional measurements taken in clinics. The United States blood pressure monitoring devices market is benefiting from this shift because home use expands the number of monitoring events, the number of devices per care pathway, and the value of replacement and upgrade cycles. Buyers are also changing how they evaluate products, since workflow fit with EHR systems, care coordination tools, and remote management dashboards now matters more than standalone measurement capability. The same logic supports demand in rural and underserved settings, where home monitoring can replace missed follow-up visits and reduce the burden of travel on patients and care teams. As a result, suppliers that can simplify patient onboarding and send usable data into clinical systems are likely to gain more durable positions in the United States blood pressure monitoring devices market.
Validated-device Initiatives Improving Clinician Confidence
Clinical confidence is improving because validation is becoming a visible procurement screen rather than a technical detail that sits in the background of device selection. ValidateBP.org listed more than 102 devices in 2025, and listed products must meet recognized accuracy standards such as ISO 81060-2:2018/AMD 2:2024 and related AAMI or ANSI pathways. This matters in the United States blood pressure monitoring devices market because hospital committees and RPM operators increasingly want evidence that goes beyond basic regulatory clearance when outcomes and liability are under review. Manufacturers with multiple validated models have a stronger moat, since each listed SKU needs its own validation support and that takes time, money, and clinical trial effort. The result is a clearer split between clinically trusted tiers and consumer-only tiers, which is changing pricing power and institutional access across the United States blood pressure monitoring devices market.
Restraints Impact Analysis*
| Restraint | (~) % Impact on CAGR Forecast | Geographic Relevance | Impact Timeline |
|---|---|---|---|
| Cuffless Accuracy And Evidence Gaps | -1.5% | National, most acute in clinical and RPM deployment contexts | Medium term (2-4 years) |
| Premium Pricing For Connected And Cuffless Devices | -1.2% | National, disproportionate in price-sensitive consumer and safety-net hospital segments | Short term (≤ 2 years) |
| Lack Of Reimbursement For Home BP Cuffs | -1.0% | National, highest impact in Medicare FFS and Medicaid populations | Medium term (2-4 years) |
| Cuff-Size Mismatch Limiting Patient Eligibility | -0.6% | National, with higher incidence in Southern and Midwestern states with elevated obesity rates | Long term (≥ 4 years) |
| Source: Mordor Intelligence | |||
Cuffless Accuracy And Evidence Gaps
Cuffless devices are drawing high commercial interest, but the evidence gap is still limiting their use in diagnosis and treatment decisions across the United States blood pressure monitoring devices market. Even after Aktiia received FDA 510(k) clearance for over-the-counter use in July 2025, the broader clinical category still lacks the depth of comparative evidence that providers want before changing practice patterns. The American Heart Association stated in December 2025 that cuffless technologies had not yet shown enough accuracy to diagnose hypertension or guide treatment with confidence, which keeps them closer to wellness use than to core care pathways. The FDA’s January 2026 draft guidance raises the bar further by specifying clinical performance testing expectations for future submissions, which increases time and evidence demands for new entrants. Until head-to-head validation becomes broader, premium institutional and RPM channels in the United States blood pressure monitoring devices market are likely to remain anchored in cuff-based standards[2]American College of Cardiology, “New ACC/AHA Guideline Addresses Prevention, Detection, Evaluation and Management of High Blood Pressure,” American College of Cardiology, acc.org.
Premium Pricing For Connected And Cuffless Devices
Price remains a practical barrier because validated connected devices sell well above the level of basic home units that many consumers and smaller providers still prefer. Withings launched BPM Vision in the United States at USD 149.95 in April 2025, while Omron’s connected upper-arm devices were sold in a lower but still premium range of USD 80 to USD 120, compared with basic devices that commonly sit far below those levels. That spread creates difficult purchasing choices for safety-net hospitals, community clinics, and lower-income patients who may need validated equipment but cannot absorb higher upfront hardware costs. The problem is more visible in connected care programs, because reimbursement supports monitoring activity and data exchange but does not directly remove the initial cost of hardware purchase. This keeps a meaningful part of the United States blood pressure monitoring devices market split between clinically preferred products and economically accessible products, which slows full conversion to connected systems.
*Our forecasts treat driver/restraint impacts as directional, not additive. The impact forecasts reflect baseline growth, mix effects, and variable interactions.
Segment Analysis
By Product Type: Aneroid Dominance Masking a Digital Inflection
Aneroid blood pressure monitors held 36.31% of the United States blood pressure monitoring devices market share in 2025, while digital blood pressure monitors are projected to grow at an 11.38% CAGR through 2031. Aneroid devices kept the lead because hospitals and clinics still value their low cost, familiar workflow, and continued fit with supervised auscultatory measurement in trained settings. That installed base gives the legacy segment resilience, especially in large provider systems that replace equipment gradually and prefer proven operating routines. Digital monitors are still advancing faster because home care, connected apps, and the decline of mercury alternatives are making automated measurement the default choice for new household and outpatient demand. This split shows that the United States blood pressure monitoring devices market is moving in two speeds, with institutional inertia on one side and home-led upgrading on the other.
Ambulatory blood pressure monitors remain a smaller product class, but they hold a strong clinical role because the 2025 guideline continues to treat ABPM as the reference standard for confirming white-coat and masked hypertension. That recommendation supports demand in nephrology and cardiology outpatient settings where 24-hour profiles shape treatment adjustments more directly than single office readings. Cuffs and accessories also remain important inside the blood pressure monitoring devices industry because replacement cycles, size variation, and calibration needs create recurring revenue after the initial device sale. Cuffless wearables are still the smallest product segment, but regulatory milestones such as Aktiia’s July 2025 over-the-counter clearance and Nanowear’s FDA-cleared continuous monitoring pathway show that innovation is pushing the edge of future category change. The near-term outcome is a product mix where conventional categories still carry most revenue, while newer formats influence investment priorities across the United States blood pressure monitoring devices market.


By Technology: Connected Platform Ecosystem Replacing Hardware Competition
Traditional non-smart devices retained 63.24% of the United States blood pressure monitoring devices market share in 2025, while smart connected devices are set to grow at a 10.52% CAGR through 2031. Legacy devices remain dominant because many hospital systems already own validated inventories, and large procurement teams still favor products that are easy to standardize across care sites. Cost discipline also supports this segment, since traditional monitors can fill routine measurement needs without the extra software stack required by connected ecosystems. Smart connected devices are growing faster because the value of a monitor now extends beyond a reading and into data movement, remote management, and clinical documentation. This shift is pushing the United States blood pressure monitoring devices market toward platform competition rather than pure hardware competition.
Omron’s FDA De Novo authorization in November 2024 for AFib detection inside a standard upper-arm monitor shows how algorithmic layering can change product positioning without changing the core act of measurement. Bluetooth-connected devices still suit broad retail demand because they work naturally with patient smartphones and familiar app behavior. Cellular devices are gaining strength in formal RPM programs because they lower patient friction and improve the chances that readings move into the provider system without interruption. Cuffless sensor-based technologies remain small in revenue terms, yet standards such as IEEE 1708 and ISO 81060-2 are already shaping which products can pursue clinical credibility and third-party review pathways. In the blood pressure monitoring devices industry, early compliance with both validation and software integration requirements is becoming the main route to premium institutional access.
By End User: Shifting Clinical Gravity from Institutional to Home Settings
Hospitals and clinics held 65.52% of 2025 revenue, while home healthcare settings are projected to grow at a 10.25% CAGR through 2031 in the United States blood pressure monitoring devices market. Institutional settings remain the largest buyer group because they purchase validated monitors at scale, require service support, and often pay for system integration that raises average selling value. Hospitals and clinics also benefit from guideline backing for automated office blood pressure devices, which supports gradual replacement of legacy manual equipment in cardiology and primary care. Home healthcare is expanding faster because treatment now extends beyond site-based care and requires repeated measurements that fit daily living rather than episodic visits. That change is shifting procurement decisions across the United States blood pressure monitoring devices market toward simpler onboarding, lower patient friction, and dependable data transmission.
Ambulatory surgical centers remain a smaller but durable end-user group, because they need compact and dependable monitoring equipment that fits fast procedural workflows and limited staffing patterns. The stronger strategic movement is in home-based care programs, where devices become part of a structured follow-up pathway rather than a standalone purchase. Evidence from a postpartum cell-enabled monitoring program at a safety-net hospital showed that remote surveillance could maintain consistent blood pressure follow-up across a diverse population while reducing resource use. That finding matters well beyond obstetrics because it shows how the United States blood pressure monitoring devices market can expand when devices are selected to match low-complexity patient use and provider workflow demands. The end-user mix is therefore moving from site ownership toward pathway ownership, with home care gaining importance even while hospitals remain the largest revenue center.
By Distribution Channel: E-commerce Disrupting Traditional Procurement Economics
Institutional direct sales and group purchasing held 35.24% of 2025 revenue, while e-commerce is forecast to grow at a 9.83% CAGR through 2031 in the United States blood pressure monitoring devices market. E-commerce is expanding because first-time home buyers and replacement buyers increasingly want convenient access to connected monitors, transparent product comparisons, and easier repeat purchasing. This channel also influences institutional behavior, since public retail pricing creates clearer benchmarks that purchasers can use when comparing premium and mid-tier devices. Direct institutional sales remain important because large systems still need contract pricing, integration support, device training, and service commitments that retail channels do not provide. This keeps the United States blood pressure monitoring devices market balanced between digital self-service buying and managed procurement relationships.
Retail pharmacies and drug stores still hold relevance because older adults often want to see the product physically, ask questions, and rely on pharmacist reassurance before buying a home monitor. Another channel is emerging through RPM program fulfillment, where devices are provisioned directly to enrolled patients at the point of care activation rather than sold through a store. That model gives providers better control over device compatibility, onboarding, and data continuity, which can make usage more predictable than open retail purchasing. It also supports vendors that bundle software, logistics, and monitoring support around the device itself, which raises switching costs after deployment. Distribution strategy is therefore becoming a core competitive lever in the United States blood pressure monitoring devices market, not just a route to shelf presence.

By Application: Hypertension Management Anchoring Revenue While RPM Accelerates
Hypertension diagnosis and ongoing management accounted for 68.44% share of the United States blood pressure monitoring devices market size in 2025, while remote patient monitoring is forecast to expand at a 12.53% CAGR through 2031. The core diagnosis and management segment remains largest because it spans all major device formats and all major care settings, from office visits and outpatient follow-up to home monitoring and specialist evaluation. Baseline demand stays firm because a very large hypertensive population still needs repeated monitoring even before any new care model or product innovation is added. RPM is growing faster because it combines home monitoring, provider oversight, digital transmission, and reimbursement support inside one scalable operating model. That makes RPM the clearest growth engine inside the United States blood pressure monitoring devices market even though traditional hypertension management still generates most revenue.
Pregnancy and preeclampsia monitoring form a smaller but expanding application area, and growth here is being shaped more by clinical pathway redesign than by population expansion alone. A 2025 systematic review found that remote blood pressure monitoring for women at high risk of hypertensive disorders of pregnancy was already reflected in international guidance and reduced in-person visits without worsening maternal or fetal outcomes across 61,539 patients covered in 100 publications. That creates a distinct purchasing stream, because maternal monitoring needs validated devices, clear escalation rules, and follow-up that can continue well into the postpartum period[3]David C. Goff et al., “Updates in the 2025 AHA/ACC Hypertension Guideline,” Current Hypertension Reports, springer.com. Preventive screening and wellness monitoring remain earlier in commercial maturity, but they are widening device use beyond traditional physician-centered settings through employer programs, community screening, and validation-led public health initiatives. Application mix in the United States blood pressure monitoring devices market is therefore broadening, even though hypertension control remains the anchor that supports the largest revenue base.
Geography Analysis
The United States blood pressure monitoring devices market is national in commercial scope, but the heaviest clinical need is concentrated in the South, where hypertension prevalence is highest and control rates are weakest. Southern states such as Mississippi, Alabama, Arkansas, Louisiana, and West Virginia show the clearest mismatch between disease burden and consistent access to advanced monitoring pathways. This concentration is especially important because non-Hispanic Black adults had a hypertension prevalence of 58.0% in the latest national breakdown, which intensifies demand in several Southern communities already carrying heavier cardiology loads. Safety-net providers and rural care gaps make this region more dependent on low-friction, easy-to-use devices that can support follow-up beyond the clinic. That is why cellular transmission, multilingual setup, and simple patient workflow have stronger practical value in these states than premium consumer features alone.
The Northeast and West Coast are better positioned for RPM deployment because they have larger concentrations of integrated systems, specialty care capacity, and telehealth-ready care models. Urban centers in California, New York, and Massachusetts are more favorable for premium connected products that blend device use with app guidance, digital engagement, and continuous oversight. Withings’ April 2025 launch of BPM Vision in the United States shows how manufacturers are targeting these tech-fluent markets with higher-priced connected offerings that emphasize guided monitoring and screen-based usability. The Midwest presents a mixed pattern, because it combines high-burden urban populations with rural access gaps that keep demand split between institutional-grade systems and simple durable home units. This regional mix means product strategy in the United States blood pressure monitoring devices market cannot rely on one national channel model alone.
Rural America remains a large upgrade opportunity because the commercial challenge is less about awareness and more about matching devices to irregular follow-up patterns and lower care access. Connected monitoring becomes more relevant here when providers can track patients remotely without depending on frequent office returns. As federal and provider interest in remote care grows, these underserved geographies are likely to remain a major long-run demand pocket for the United States blood pressure monitoring devices market.
Competitive Landscape
The United States blood pressure monitoring devices market shows moderate concentration, with stronger rivalry in consumer-connected categories and more stable positions in institutional channels where contracts and integration needs support incumbents. The field is organized around institutional suppliers such as Baxter, GE HealthCare, Philips, Spacelabs Healthcare, SunTech Medical, and Mindray, consumer-focused brands such as Omron, Withings, iHealth Labs, A&D Medical, Microlife, and Rossmax, and a smaller group of connected or cuffless innovators led by Aktiia and similar entrants. Competitive advantage no longer comes from cuff hardware alone, because vendors are layering arrhythmia detection, cloud transfer, and workflow integration onto standard blood pressure measurement. This is why the United States blood pressure monitoring devices market is rewarding companies that can combine regulatory strength, software utility, and clinical workflow fit in one offer. Omron’s April 2026 OMRON-AF Trial launch with UCSF is a clear example of this strategy, because the company is using large-scale clinical evidence generation to deepen differentiation around daily home monitoring and AFib detection.
Baxter took a different route in September 2025 when it launched the Welch Allyn Connex 360 Vital Signs Monitor with cloud-based DeviceBridge support, which positions blood pressure monitoring inside a broader connected patient monitoring framework. That move matters because institutional buyers often prefer platforms that reduce documentation effort and support direct EHR synchronization rather than standalone monitors. GE HealthCare also reinforced its position in October 2025 with the Carevance platform, which targeted hospitals seeking advanced monitoring with scalable deployment across acute care settings. In consumer and hybrid care channels, Withings used product design and guided usability with BPM Vision, while Aktiia used regulatory novelty to establish the first over-the-counter cuffless pathway in the country. These moves show that the United States blood pressure monitoring devices market is not converging toward one winning model, because institutional integration, consumer usability, and cuffless innovation are all advancing at the same time.
A key open space remains the patient who leaves the hospital but has not yet been absorbed into a formal home monitoring program, because that patient sits between institutional devices and consumer self-purchase behavior. Vendors that can provision devices, support onboarding, and maintain data continuity across that transition can win share disproportionate to their current hardware volume. This helps explain why smaller players are trying to compete through service bundles and software coordination rather than by undercutting large incumbents on hardware alone. Competitive outcomes in the United States blood pressure monitoring devices market are therefore likely to depend on channel execution and care-pathway relevance as much as on device unit sales.
United States Blood Pressure Monitoring Devices Industry Leaders
Omron Healthcare
Baxter International (Welch Allyn)
GE HealthCare
A&D Medical
Withings
- *Disclaimer: Major Players sorted in no particular order

Recent Industry Developments
- January 2026: Fukuda Denshi USA, Inc. introduced the LX-1300 series telemetry transmitter along with the LXN-1000 non-invasive blood pressure (NIBP) monitor. This combination provides healthcare professionals with a practical and integrated solution for monitoring vital signs effectively in hospital settings.
- July 2025: Aktiia received FDA 510(k) clearance for its over-the-counter cuffless blood pressure monitor, G0 Blood Pressure Monitoring System, also known as the Hilo Band.


United States Blood Pressure Monitoring Devices Market Report Scope
As per the scope of the report, blood pressure monitoring devices are medical instruments used to measure and monitor a person's blood pressure, which indicates the force of blood against the walls of the arteries as the heart pumps blood throughout the body. These devices help in diagnosing and managing conditions like hypertension (high blood pressure) and are essential tools in healthcare for assessing cardiovascular health.
The segmentation for the United States blood pressure monitoring devices market is categorized by product type, technology, end user, distribution channel, and application. By product type, the market includes aneroid blood pressure monitors, digital blood pressure monitors, ambulatory blood pressure monitors, cuffless blood pressure wearables, and blood pressure cuffs and accessories. By technology, it is segmented into traditional non-smart devices, smart connected devices, and cuffless sensor-based devices. By end user, the market is divided into hospitals and clinics, ambulatory surgical centers, home healthcare settings, and other end users. By distribution channel, the segmentation includes institutional direct sales and group purchasing, retail pharmacies and drug stores, e-commerce, and direct-to-consumer RPM programs. By application, the market is segmented into hypertension diagnosis and ongoing management, remote patient monitoring, preventive screening and wellness monitoring, and pregnancy and preeclampsia monitoring. For each segment, the market size and forecast are provided in terms of value (USD).
| Aneroid Blood Pressure Monitors |
| Digital Blood Pressure Monitors |
| Ambulatory Blood Pressure Monitors |
| Cuffless Blood Pressure Wearables |
| Blood Pressure Cuffs and Accessories |
| Traditional Non-smart Devices |
| Smart Connected Devices |
| Cuffless Sensor-based Devices |
| Hospitals and Clinics |
| Ambulatory Surgical Centers |
| Home Healthcare Settings |
| Other End Users |
| Institutional Direct Sales and Group Purchasing |
| Retail Pharmacies and Drug Stores |
| E-commerce |
| Direct-to-Consumer RPM Programs |
| Hypertension Diagnosis and Ongoing Management |
| Remote Patient Monitoring |
| Preventive Screening and Wellness Monitoring |
| Pregnancy and Preeclampsia Monitoring |
| By Product Type | Aneroid Blood Pressure Monitors |
| Digital Blood Pressure Monitors | |
| Ambulatory Blood Pressure Monitors | |
| Cuffless Blood Pressure Wearables | |
| Blood Pressure Cuffs and Accessories | |
| By Technology | Traditional Non-smart Devices |
| Smart Connected Devices | |
| Cuffless Sensor-based Devices | |
| By End User | Hospitals and Clinics |
| Ambulatory Surgical Centers | |
| Home Healthcare Settings | |
| Other End Users | |
| By Distribution Channel | Institutional Direct Sales and Group Purchasing |
| Retail Pharmacies and Drug Stores | |
| E-commerce | |
| Direct-to-Consumer RPM Programs | |
| By Application | Hypertension Diagnosis and Ongoing Management |
| Remote Patient Monitoring | |
| Preventive Screening and Wellness Monitoring | |
| Pregnancy and Preeclampsia Monitoring |


Key Questions Answered in the Report
What is the 2031 outlook for blood pressure monitoring devices in the United States?
The market is projected to reach USD 3.39 billion by 2031 from USD 2.22 billion in 2026, growing at an 8.82% CAGR over 2026-2031.
What is driving the strongest demand for blood pressure monitoring devices in the country?
The main demand driver is the large uncontrolled hypertensive population. The CDC reported 119.9 million adults with hypertension, while only 20.7% had control below 130/80 mmHg.
Which application is growing the fastest through 2031?
Remote patient monitoring is the fastest-growing application, with a projected 12.53% CAGR through 2031, supported by wider use of connected monitoring and reimbursement-backed remote care models.
Which end-user group currently leads revenue generation?
Hospitals and clinics lead revenue with 65.52% of 2025 sales, because they buy validated devices, service support, and integration-ready systems at scale.
Are digital monitors replacing aneroid devices in the United States?
Digital devices are growing faster at an 11.38% CAGR through 2031, but aneroid monitors still held the largest product share at 36.31% in 2025 due to cost advantages and clinical familiarity in supervised settings.
Why are smart connected devices becoming more important?
Smart connected devices are projected to grow at a 10.52% CAGR through 2031 because providers increasingly value data integration, remote monitoring support, and workflow compatibility over standalone measurement alone.
Page last updated on:


