
Market Overview
| Study Period | 2021 - 2031 |
|---|---|
| Forecast Data Period | 2026 - 2031 |
| Base Year Market Size (2025) | USD 5.53 Billion |
| Market Size (2026) | USD 5.84 Billion |
| Market Size (2031) | USD 7.55 Billion |
| Growth Rate (2026 - 2031) | 5.28 % |
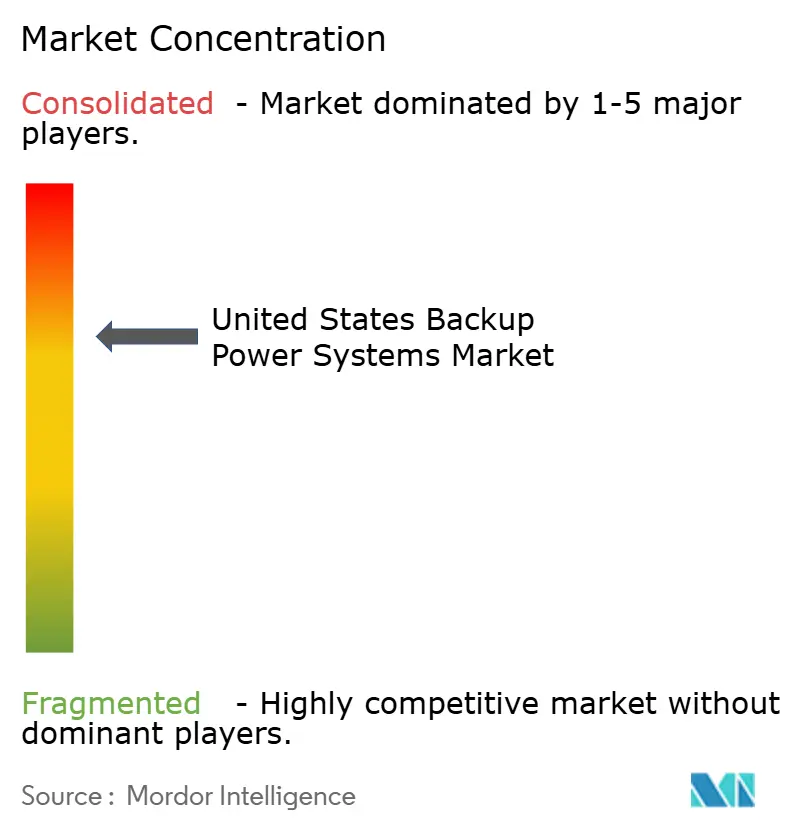
| Market Concentration | Medium |
Major Players *Disclaimer: Major Players sorted in no particular order Image © Mordor Intelligence. Reuse requires attribution under CC BY 4.0. | |
United States Backup Power Systems Market Analysis by Mordor Intelligence
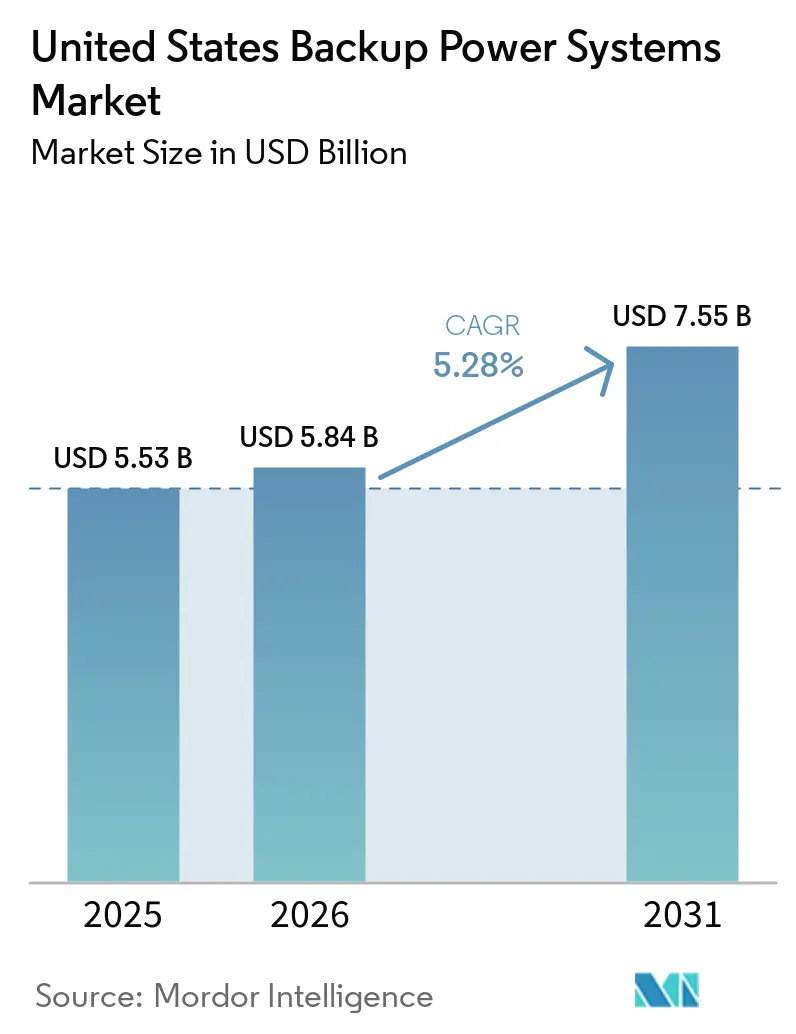
The United States Backup Power Systems Market size was valued at USD 5.53 billion in 2025 and is estimated to grow from USD 5.84 billion in 2026 to reach USD 7.55 billion by 2031, at a CAGR of 5.28% during the forecast period (2026-2031).
Aging transmission infrastructure, a 15% rise in sustained outages during 2024, and the commissioning of 23 gigawatts of new data-center standby generation in 2025 collectively underpin resilient demand. Fuel switching is underway as Tier 4 Final diesel‐emission costs lift natural-gas and hydrogen-ready adoption, while predictive-maintenance software is lowering whole-life service costs for fleets exceeding 500 units. Rental genset-as-a-service offerings are compressing margins for OEMs, but the sector continues to rely on standby power’s irreplaceable role in critical facilities where even brief outages can incur multi-million-dollar losses. These forces combine to drive a steady yet diversified growth trajectory for the United States backup power systems market.
Key Report Takeaways
- By technology, gas generators led with 40.2% revenue share in 2025, while fuel-cell backup platforms are forecast to grow at a 9.6% CAGR through 2031.
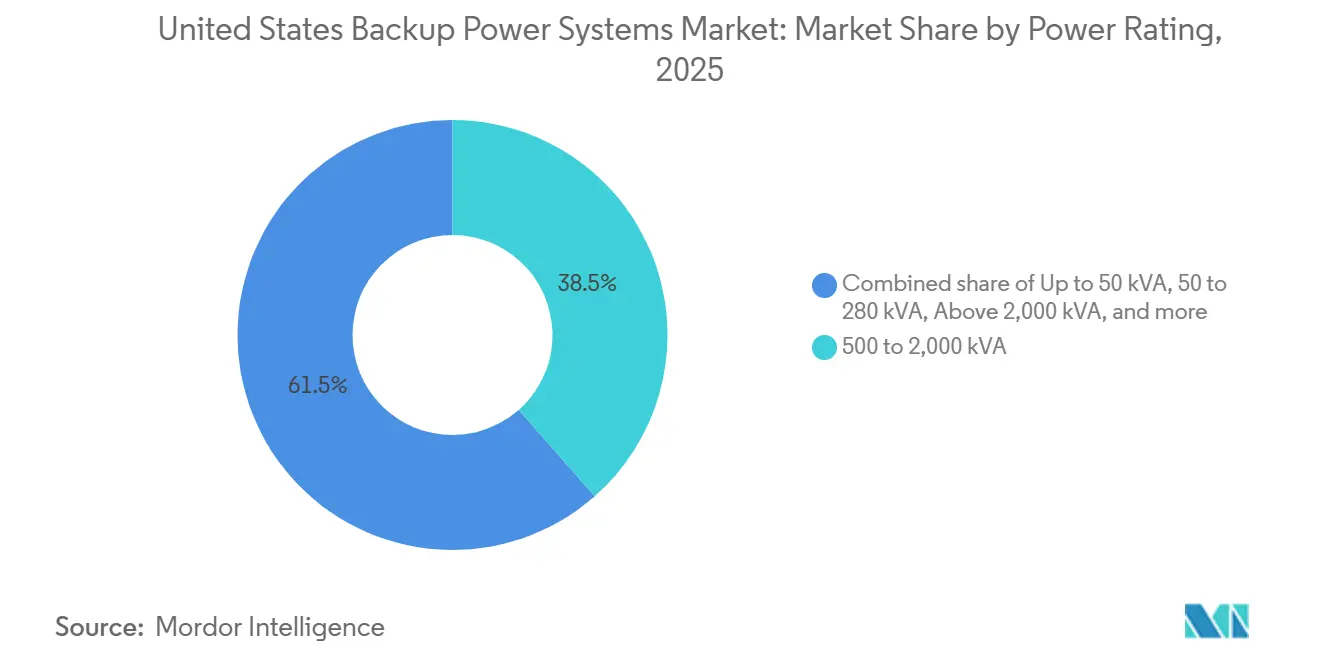
- By power rating, the 500-2,000 kVA segment held 38.5% of the United States backup power systems market share in 2025 and is advancing at a 5.8% CAGR to 2031.
- By application, standby and emergency systems captured a 49.9% share in 2025; off-grid and remote uses are projected to expand at an 8.5% CAGR to 2031.
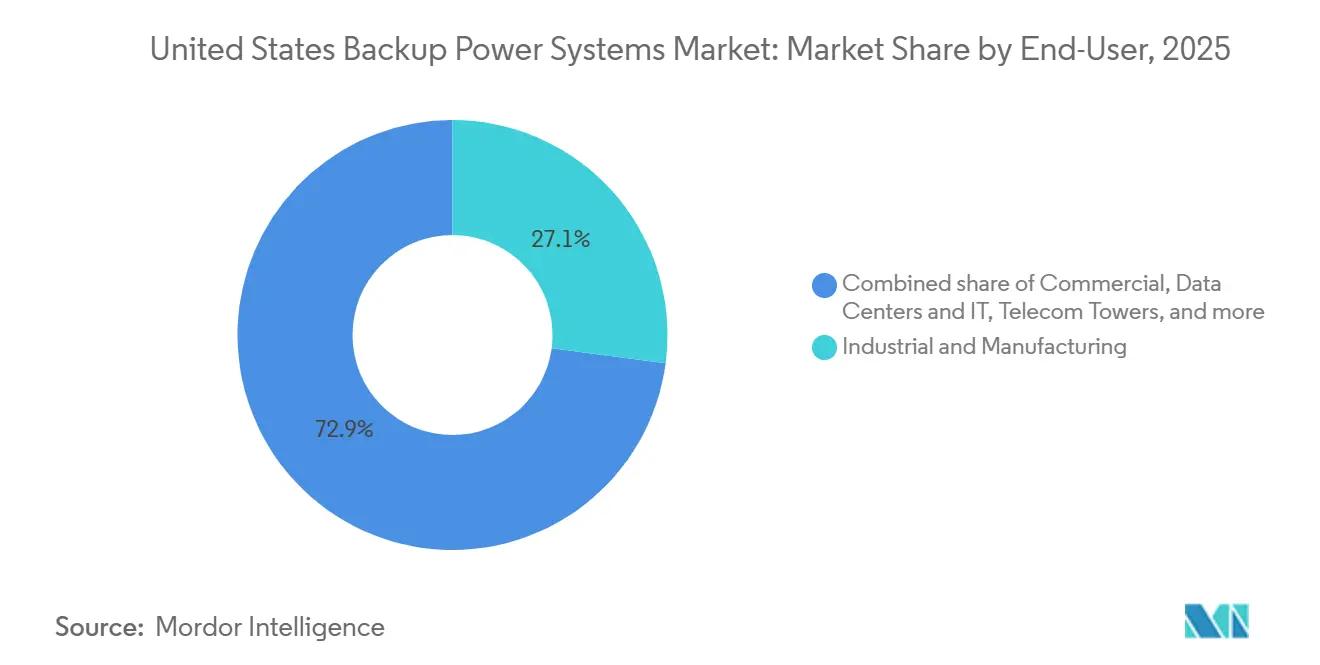
- By end user, industrial and manufacturing sites accounted for 27.1% of the United States backup power systems market size in 2025, while data centers are progressing at a 10.3% CAGR through 2031.
- Generac, Cummins, and Caterpillar together commanded roughly 55-60% of 2025 revenue, yet new entrants in fuel cells and hybrid genset-plus-storage solutions are eroding share through differentiated zero-emission offerings.
Note: Market size and forecast figures in this report are generated using Mordor Intelligence’s proprietary estimation framework, updated with the latest available data and insights as of January 2026.
United States Backup Power Systems Market Trends and Insights
Drivers Impact Analysis*
| Driver | (~) % Impact on CAGR Forecast | Geographic Relevance | Impact Timeline |
|---|---|---|---|
| Increasing data-center footprint | 1.8% | National, concentrated in Northern Virginia, Oregon, Texas, Arizona | Medium term (2-4 years) |
| Severe grid-outage frequency & duration | 1.2% | National, acute in Gulf Coast, California wildfire zones, Northeast ice-storm corridors | Short term (≤ 2 years) |
| Growth of AI-enabled manufacturing lines | 0.7% | Midwest industrial belt, Southwest semiconductor clusters | Long term (≥ 4 years) |
| Electrification of critical healthcare assets | 0.5% | National, urban hospital systems and rural critical-access facilities | Medium term (2-4 years) |
| Mandatory resiliency codes for commercial buildings | 0.6% | Coastal states (Florida, North Carolina, New York), California seismic zones | Short term (≤ 2 years) |
| AI-driven predictive-maintenance platforms unlock TCO savings | 0.4% | National, early adoption in large industrial and data-center portfolios | Long term (≥ 4 years) |
| Source: Mordor Intelligence | |||
Increasing Data-Center Footprint
Hyperscale operators commissioned 11 gigawatts of additional white-space in 2025, prompting 23 gigawatts of redundant onsite generation to satisfy N+1 and 2N topologies.[1] Loudoun County added 1.2 gigawatts of diesel and gas sets, straining local air-quality compliance and catalyzing battery-assisted runtime pilots.[2] Power-density escalation toward 50-60 kilowatts per rack now requires backup systems to stabilize voltage in milliseconds, elevating demand for hybrid UPS paired with quick-start gas turbines. Secondary hubs in Oregon and Texas are scaling because of renewable energy access and land availability, yet transmission congestion heightens the strategic value of onsite standby power.[3] Collectively, these deployments embed long-term growth for the United States backup power systems market.
Severe Grid-Outage Frequency and Duration
The System Average Interruption Duration Index for investor-owned utilities rose 15% in 2024, reflecting extreme weather and equipment aging.[4] Hurricane events in Florida and Louisiana during the 2025 season caused outages averaging 72 hours, spurring insurers to mandate backup generation for policy renewal. California logged 38 days of Public Safety Power Shutoffs in 2025, with some circuits de-energized for 200-plus hours, thereby shifting backup economics from rarely used assets to frequently dispatched resources. Ice storms in Vermont and Maine triggered week-long blackouts, leading to state bills that offer tax credits on residential units above 10 kilowatts. The persistent nature of outages embeds backup power procurement into capital budgets across every vertical, reinforcing growth in the United States backup power systems market.
Growth of AI-Enabled Manufacturing Lines
Semiconductor fabs and EV battery plants now deploy equipment that fails if voltage sags exceed 5% or frequency drifts 0.1 hertz, necessitating rotary UPS or flywheel bridges for the 8-12 second genset start window. Intel’s Arizona fab added 120 megawatts of standby capacity in late 2025 to protect USD 150 million lithography tools from power anomalies. Domestic content rules in the Inflation Reduction Act accelerated six battery gigafactory groundbreakings in 2025, each specifying 30-45 minutes of full-load backup. Hydrogen fuel cells are in pilot use because they offer zero onsite emissions and share pipeline infrastructure with natural gas after minor retrofits. Continuous investment in AI-driven production environments raises the baseline need for resilient power and widens the addressable base for the United States backup power systems market.
Mandatory Resiliency Codes for Commercial Buildings
Hurricane-exposed states and seismic zones now embed standby power within updated building codes that require elevators, fire pumps, and egress lighting to run for 96 hours during outages. Florida, North Carolina, and New York implemented stricter provisions after the 2025 storm season, creating a compliance-driven surge in medium-sized gensets. Joint Commission standards for hospitals similarly enforce 96-hour runtime, prompting facility managers to renew older diesel fleets with Tier 4 Final or gas alternatives. Urban adoption is also growing as local ordinances limit noise, making low-NOx natural-gas sets and modular fuel cells attractive for downtown buildings. These statutory pressures ensure a predictable installation pipeline, materially benefiting the United States backup power systems market.
Restraints Impact Analysis*
| Restraint | (~) % Impact on CAGR Forecast | Geographic Relevance | Impact Timeline |
|---|---|---|---|
| Tightening EPA emission caps (Tier 4 Final) | -0.9% | National, enforcement concentrated in non-attainment zones (California, Northeast) | Short term (≤ 2 years) |
| Rising interest-rates inflate capex for large gensets | -0.6% | National, acute impact on capital-intensive industrial and utility projects | Short term (≤ 2 years) |
| Lithium-ion fire-safety concerns in UPS rooms | -0.5% | National, heightened scrutiny in high-rise commercial buildings and legacy data centers | Medium term (2-4 years) |
| Capital-allocation shift toward on-site PV-plus-storage | -0.7% | Sunbelt states (California, Arizona, Texas, Florida), ITC-eligible projects | Medium term (2-4 years) |
| Source: Mordor Intelligence | |||
Tightening EPA Emission Caps
Tier 4 Final rules cap particulate matter at 0.03 g/kWh and NOx at 0.4 g/kWh, adding USD 8,000-15,000 per genset for after-treatment hardware. California’s Air Resources Board mandates extra filter regeneration cycles, lifting annual maintenance outlays 12-18%. Best Available Control Technology permitting extends diesel project timelines up to nine months in Los Angeles and the San Joaquin Valley, pushing buyers toward natural-gas and propane units that emit 60% less NOx. Secondary markets for used gensets weaken because non-compliant equipment cannot be resold, raising lifecycle costs. This dynamic trims near-term diesel demand, tempering growth for the United States backup power systems market.
Capital-Allocation Shift Toward On-Site PV-Plus-Storage
The Investment Tax Credit and declining battery prices make photovoltaic-coupled storage arrays financially attractive, diverting capex from large gensets in California, Arizona, Texas, and Florida. Commercial sites can offset 40-60% of annual load with solar, leaving backup duty for shorter durations that smaller gensets or batteries can handle. Rising interest rates added 180 basis points to genset financing between 2024 and 2025, widening the gap versus subsidized solar loans. Insurance incentives also favor carbon-free backup, further challenging diesel deployments. While PV-plus-storage cannot yet replace multi-day runtime in all applications, it constrains some addressable segments of the United States backup power systems market.
*Our forecasts treat driver/restraint impacts as directional, not additive. The impact forecasts reflect baseline growth, mix effects, and variable interactions.
Segment Analysis
By Technology: Gas Generators Anchor Installations While Fuel Cells Accelerate
Gas generators captured 40.2% of 2025 revenue, reflecting widespread pipeline coverage to 77% of commercial sites and lower selective catalytic reduction costs compared with diesel. Fuel-cell platforms, although smaller today, are growing at a 9.6% CAGR in the United States backup power systems market size through 2031 because corporate net-zero pledges and California’s 2028 zero-emission mandate incentivize hydrogen and solid-oxide systems.
Diesel sets remain economical for code-minimum standby use where annual operation remains below 100 hours, yet Tier 4 compliance outlays and resale limitations are eroding share. Lithium-ion UPS dominates the sub-50 kVA tier that guards sensitive IT loads, while battery energy storage systems monetize demand-charge avoidance and ancillary-services revenue. Hybrid diesel-plus-battery packages are emerging in microgrids for military bases and remote industrial sites, cutting fuel burn by 30-40% and supporting the broader United States backup power systems market.
By Power Rating: Medium-Scale Units Balance Footprint and Redundancy
The 500-2,000 kVA class held 38.5% of the 2025 market and is set to rise 5.8% annually, underscoring its appeal for multi-tenant data halls and mid-sized factories that need N+1 redundancy without oversizing. Modular enclosures allow parallel operation in 500-kW increments, aligning capacity with demand ramps and preserving capital.
Above-2,000 kVA sets serve hyperscale campuses where 3-4 MW singles reduce interconnect complexity, but they face 12-18 month lead times for custom switchgear, tempering uptake. Units up to 50 kVA dominate residential demand and small commercial offices; natural-gas variants command 65% because of automatic transfer and unlimited runtime. The 50-280 kVA cohort protects retail, hospitality, and small clinics by covering refrigeration and life-safety loads, offering a three-to-five-year payback via avoided spoilage. This nuanced mix supports sustained volume in the United States backup power systems market.

By Application: Standby Leads, Off-Grid Gains with Rural 5G
Standby and emergency systems held 49.9% of the United States backup power systems market share in 2025, anchored by building codes and hospital life-safety rules and demand for emergency power generators. Off-grid and remote power is the fastest growing application at 8.5% CAGR, propelled by telecom carriers deploying 5G small cells where grid extension costs exceed USD 50,000 per mile.
Prime and continuous duty grows modestly as natural-gas price volatility and renewable incentives tilt economics toward grid-connected operations. Peak-shaving is a high-margin niche: battery arrays and fast-start turbines cut demand charges 15-30% and offer frequency-regulation revenue without jeopardizing standby readiness. Application boundaries blur as operators stack services, enabling a single asset to provide backup, demand response, and energy arbitrage, further broadening the United States backup power systems industry opportunity set.
By End User: Industrial Spending Dominates, Data Centers Expand Rapidly
Industrial and manufacturing facilities contributed 27.1% of 2025 revenue because unplanned shutdowns can cost up to USD 500,000 per hour. Data centers are the fastest-growing vertical at a 10.3% CAGR, reflecting AI training clusters that push rack densities beyond 50 kW and require 99.982% uptime.
Hospitals remain a steady buyer group under Joint Commission mandates for 96-hour runtime, though consolidation tempers absolute growth. Telecom towers need 5-10 kW units as 5G densification adds 15,000-20,000 sites annually, while residential installations now comprise 8% of shipments after multi-day storm outages disrupted remote work in 2025. Utilities and government facilities demand military-grade, multi-fuel sets for control centers and defense bases. These varied use cases diversify revenue streams inside the United States backup power systems market.
Geography Analysis
California's wildfire-related shutoffs and the nation's strictest emissions caps accelerate the adoption of natural-gas gensets, fuel cells, and large battery systems that offset diesel runtime. Texas combines rapid data-center buildout with an isolated grid, making onsite backup indispensable during cold snaps and heatwaves. Florida's hurricane exposure drives residential and commercial uptake, reinforced by insurer requirements following USD 42 billion of 2025 storm losses.
Northern Virginia added 1.2 gigawatts of data-center backup in 2025, challenging air-quality attainment and prompting utility-scale batteries that cut genset runtime. The Northeast grapples with ice storms and aging substations, spurring proposed residential tax credits in Vermont and Maine. Midwest industrial states rely on standby power to hedge against coal retirements and wind curtailments, whereas Arizona and Oregon emerge as secondary data hubs constrained by transmission limits.
Regional divergence in regulation and weather risk makes the United States backup power systems market both geographically balanced and opportunity-rich. Stringent emissions in California and the Northeast steer investment toward gas and zero-emission options, while diesel remains prevalent in cost-sensitive Sunbelt states. Population shifts into the South and West elevate demand where grid capacity lags, sustaining nationwide growth momentum.
Regulatory Landscape
US backup power deployments sit at the intersection of emissions compliance, reliability standards, and emergency grid-operations authority. EPA Tier 4 Final requirements continue to shape generator selection and project economics for diesel sets, while air-quality permitting in non-attainment areas adds schedule and cost pressure that favors low-NOx natural gas, propane, and hybrid architectures.
In 2026, federal and reliability bodies reinforced the link between onsite resources and grid reliability. The US Department of Energy issued emergency orders for PJM, including Order No. 202-26-06 (effective through February 2, 2026) and Order No. 202-26-33, which enable last-resort direction of backup generation at large-load customer sites during bulk power system emergencies. NERC also advanced reliability oversight through proposed standards activity (including petitions tied to EOP-004-5 and CIP-015-2) and ongoing compliance guidance, while the NRC issued draft guide DG-1477 in June 2026 on application and testing expectations for onsite emergency AC power sources in nuclear facilities, tightening performance and verification for critical backup power.
Competitive Landscape
The top five suppliers hold roughly 55-60% revenue, giving the United States backup power systems market a moderate concentration yet leaving ample space for innovators. Generac, Cummins, and Caterpillar leverage broad service networks and vertical integration, but fuel-cell specialists and solar-plus-storage integrators are chipping away at legacy diesel strongholds. Generac’s 2025 acquisition of Electriq Power adds solar and batteries to its portfolio, while Cummins partnered with a hydrogen-electrolyzer firm to co-develop zero-carbon backup for data centers.
Smaller firms exploit the 50-280 kVA bracket by offering quiet, modular fuel cells that bypass urban noise ordinances. Rental providers are shifting to genset-as-a-service models enabled by predictive analytics that guarantee uptime and transfer ownership risk. AI-driven maintenance from Schneider Electric cuts unscheduled downtime up to 60%, lowering total cost and reducing churn.
Patent filings in fuel-cell durability and battery thermal management rose 28% to 340 in 2025, underscoring a pivot toward zero-emission architectures. Tesla’s entry with commercial Powerpacks combines backup and peak-shaving, challenging OEMs that lack advanced software and grid interconnection expertise. Competitive intensity is therefore moving from mechanical superiority to integrated energy-as-a-service platforms, reshaping the trajectory of the United States backup power systems market.
United States Backup Power Systems Industry Leaders
-
Eaton Corporation plc
-
Generac Holdings Inc.
-
Caterpillar Inc.
-
Cummins Inc.
-
Kohler Co.
- *Disclaimer: Major Players sorted in no particular order
Market Opportunities and Future Outlook
Data centers, industrial automation, and building resiliency codes keep pushing the market toward larger, more integrated backup architectures that combine generation, UPS, controls, and service. The most visible whitespace is hybridization and controls that let operators use the same assets for ride-through, runtime extension, and limited grid-support participation, without conflicting with emergency-engine operating constraints. EPA guidance clarifying the conditions under which stationary emergency engines may participate in certain non-emergency demand response programs (while maintaining the 50-hour rule) provides a practical compliance pathway that supports controller, metering, and dispatch-software upgrades.
As solar and storage take a larger share of facility generation, backup systems that coordinate cleanly with inverter-based resources and microgrids at the facility edge face more demand. EIA reported plans for a record 86 GW of new US utility-scale capacity additions in 2026, led by solar and battery storage, while NERC has highlighted rapid battery additions since summer 2025, underscoring the need for backup power designs that coordinate with fast-responding storage and modern protection requirements. DOE activity, including the i2X DER Interconnection Roadmap (January 2025) and April 2026 microgrid-focused strategic documents on modular building blocks and coordinated distribution-transmission modeling, also supports more standardized, cyber-aware integration, helping suppliers package generators, BESS, switchgear, and controls for data centers, healthcare, and industrial campuses.
Recent Industry Developments
- July 2026: Eaton partnered with VoltServer to advance fault-managed power and next-generation DC power distribution for buildings and data centers. The collaboration targets safer, more efficient power delivery at the edge, supporting higher-density loads where conventional AC distribution can be space and loss constrained.
- June 2026: Generac signed a global supply agreement with a leading hyperscale data center operator to supply backup power generators. The agreement reinforces demand visibility for large-scale standby fleets and strengthens the role of standardized generator platforms and service support in hyperscale procurement.
- November 2024: Eaton launched an energy storage system for commercial and industrial customers across North America. The product expansion supports hybrid backup configurations that pair storage with generators and UPS to reduce runtime emissions and improve power quality during outages.
Research Methodology Framework and Report Scope
Market Definition and Coverage
For this methodology, the market includes equipment sold in the United States that provides backup electricity when the grid supply is interrupted, and the value is tracked as revenue from system sales and related hardware that enables backup operation.
Scope exclusions: We exclude routine electrical distribution gear that does not provide backup output (such as standard switchgear without backup functionality) and general fuel supply services.
Segmentation Overview
- By Technology
- Diesel Generators
- Gas Generators
- Uninterruptible Power Supply (UPS)
- Battery Energy Storage Systems (BESS)
- Hybrid Power Solutions
- Fuel-Cell Backup Systems
- Portable Power Stations
- By Power Rating
- Up to 50 kVA
- 50 to 280 kVA
- 280 to 500 kVA
- 500 to 2,000 kVA
- Above 2,000 kVA
- By Application
- Standby/Emergency Power
- Prime/Continuous Power
- Peak Shaving and Load Management
- Off-Grid and Remote Power
- By End-User
- Residential
- Commercial (Retail, Offices, Hospitality)
- Industrial and Manufacturing
- Data Centers and IT
- Healthcare Facilities
- Telecom Towers
- Utilities and Energy
- Government and Defence
Data Sources, Market Sizing, and Validation
Desk Research
Desk work starts with aligning the definition to public power reliability and generation context, since outages and resiliency spending are key demand signals in this space. We use sources such as the U.S. Energy Information Administration for electricity generation and fuel context, the U.S. Census Bureau for construction and business activity series, and the Bureau of Labor Statistics for relevant price and labor indicators that influence installation intensity.
To keep product and safety assumptions realistic, we also review reference material such as National Fire Protection Association codes (for emergency power systems), standards from organizations such as NEMA, and technical publications and filings that describe runtime, capacity, and typical use cases. Company filings, investor presentations, reputable press coverage, and an approved paid subscription for company financials and news are used to cross-check revenue exposure and timing. These examples are not exhaustive, and many other public documents and datasets are reviewed to collect inputs, validate assumptions, and clarify open questions.
Primary Interviews and Surveys
Primary conversations were used to test what desk sources cannot fully show, especially where system type boundaries, typical sizing choices, and replacement cycles differ by end user. We spoke with a mix of manufacturers, distributors, contractors, facility teams, and engineering consultants across the United States to confirm adoption drivers in healthcare, data centers, telecom, industrial sites, and residential backup use.
Distribution of primary research fieldwork respondents
| Company type | Respondent position |
|---|---|
| Top tier: 32% | CXOs: 17% |
| Mid tier: 47% | Functional/Unit leaders: 24% |
| Smaller Players: 21% | Managers: 59% |
Market-Sizing & Forecasting
Sizing begins with a top-down build that reconstructs the addressable demand pool from U.S. power reliability exposure and backup equipment adoption across major end users, which is then translated into revenue using realistic price bands. The model is corroborated with selective bottom-up checks, such as sampled system ASP multiplied by expected unit volumes for key use cases, and channel feedback on the mix of generator sets versus UPS and battery-based backup.
Inputs are kept practical and repeatable, including outage frequency and duration signals, new construction and retrofit activity in critical facilities, typical kVA ranges chosen by end users, fuel preference and permitting friction, and replacement timing for aging units. Where direct unit visibility is limited, gaps are handled by using application-level penetration ranges validated in interviews, then stress-tested against supplier disclosures and contractor throughput. Forecasting uses scenario analysis anchored to expected grid reliability trends, construction cycle expectations, and the pace of data center and healthcare capacity additions, with the final year-by-year path adjusted to match how pricing and mix usually move in this market.
Data Validation & Update Cycle
Validation is done through repeated checks across the model, where totals are compared with independent signals such as construction intensity in critical end markets, fuel and equipment availability commentary, and observed shifts in system sizing and runtime requirements. When an output looks off, the assumptions are reopened, variances are explained, and follow-up questions are sent back to interviewees before the numbers are finalized.
Before sign-off, a second analyst reviews the logic, units, and year-over-year movements so that simple errors and hidden double counting get caught. The report is refreshed annually, and interim updates are made when material events occur, such as major code changes, extreme weather seasons that shift ordering patterns, or meaningful pricing swings. Right before delivery, a fresh pass is completed so clients receive the latest updated view.
Mordor Intelligence's United States Backup Power Systems Market Size Versus Other Published Estimates
Published market sizes for U.S. backup power systems often vary because analysts do not always count the same equipment set, and they also use different price and mix assumptions for generators, UPS, and battery-based backup. Timing can add another layer, since some figures are stated in a different base year or reflect older pricing and outage-driven demand patterns.
The biggest gap drivers usually come from scope and counting rules, for example whether portable power stations and fuel-cell backup are included, and whether the estimate mixes standby use with prime and off-grid deployments. Differences also show up in how average selling prices are progressed, since contractor-led installation costs and product mix can move totals even when unit demand is steady. A stricter separation of included technologies and a faster refresh when pricing and mix shift helps explain the spread seen in the table, which is the approach applied by Mordor Intelligence.
Benchmark comparison
| Source | Market Size | Gaps in Research Methodology |
|---|---|---|
| Mordor Intelligence | USD 5.53 B (2025) | |
| Global Consultancy A | USD 21.21 B (2026) | Uses a broader product basket that can fold in adjacent power solutions and services, and it is not clearly constrained to standby backup use cases, which inflates the counted revenue pool versus a tighter backup-only definition. |
| Trade Journal B | USD 4.31 B (2024) | Tracks a narrower slice centered on residential backup in North America rather than the full United States across residential, commercial, and industrial demand, and the earlier year can miss recent mix and pricing shifts. |
The comparison shows that the spread is mostly explained by what gets counted, and by whether the scope is national and multi end-user or focused on a single pocket of demand. With clear technology inclusion rules, consistent year and currency handling, and assumptions that can be traced back to outage exposure and end-market build activity, the resulting market size stays easier to reproduce and verify.
Key Questions Answered in the Report
What is the current value of the United States backup power systems market?
The market was valued at USD 5.84 billion in 2026 and is forecast to reach USD 7.55 billion by 2031.
Which technology leads sales in the United States backup power systems market?
Natural-gas generators led with 40.2% revenue share in 2025.
How fast is the fuel-cell segment growing?
Fuel-cell backup systems are advancing at a 9.6% CAGR through 2031.
Why are data centers driving demand for backup power?
AI workloads require 50-60 kW per rack and strict uptime, prompting hyperscale operators to install large redundant generation.
What regulations most impact diesel generators?
EPA Tier 4 Final rules that add USD 8,000-15,000 per unit for after-treatment and extend permitting in non-attainment zones.
Which U.S. regions show the strongest growth?
California, Texas, and Northern Virginia exhibit the highest installation rates because of wildfire shutoffs, grid isolation, and data-center clustering.