
High Voltage Direct Current (HVDC) Cables Market Size and Share
Market Overview
| Study Period | 2021 - 2031 |
|---|---|
| Market Size (2026) | USD 11.70 Billion |
| Market Size (2031) | USD 17.27 Billion |
| Growth Rate (2026 - 2031) | 8.10 % |
| Fastest Growing Market | Asia Pacific |
| Largest Market | Asia Pacific |
| Market Concentration | Medium |
Major Players *Disclaimer: Major Players sorted in no particular order Image © Mordor Intelligence. Reuse requires attribution under CC BY 4.0. | |
High Voltage Direct Current (HVDC) Cables Market Analysis by Mordor Intelligence
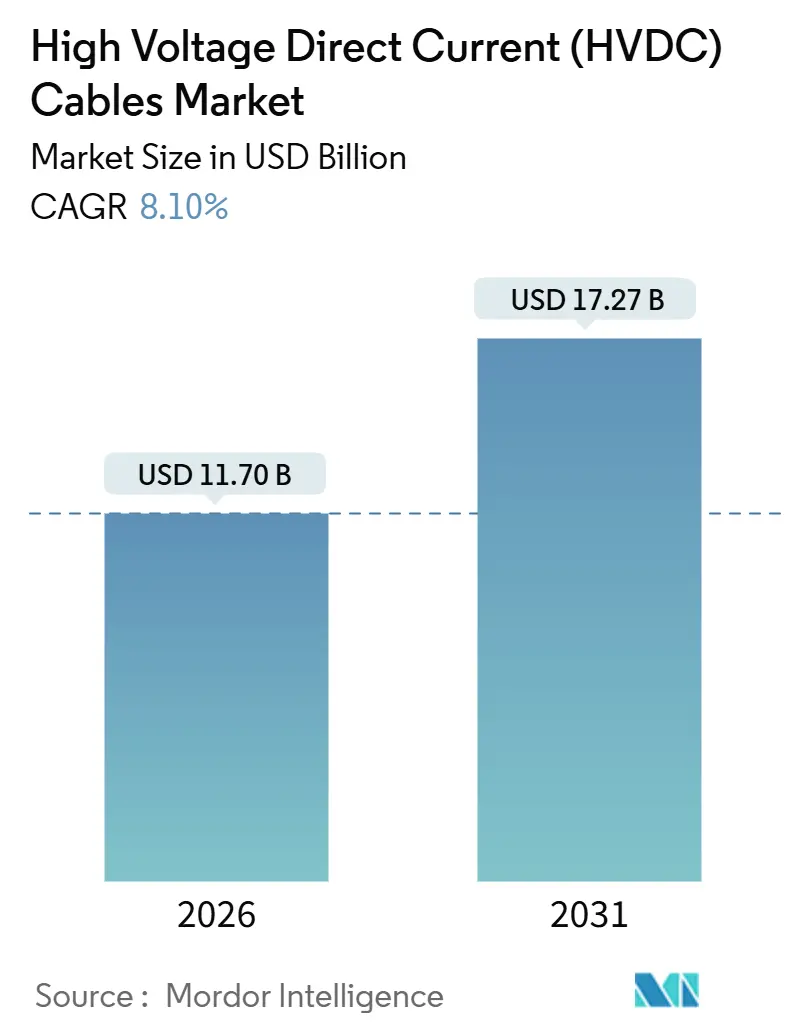
The High Voltage Direct Current (HVDC) Cables Market size is estimated at USD 11.70 billion in 2026, and is expected to reach USD 17.27 billion by 2031, at a CAGR of 8.10% during the forecast period (2026-2031).
Rising offshore wind build-outs in Europe and Asia-Pacific, national super-grid programs in China, India, and the Gulf, and the move toward grid-forming converter stations are jointly pushing demand for long-distance, high-capacity links. Utilities are shifting specifications toward aluminium-core conductors to hedge copper price volatility, while cable makers deepen backward integration into XLPE resin production to secure supply. Turnkey engineering-procurement-construction (EPC) contracts that bundle cable, converter, and installation services are now the preferred procurement route, rewarding scale and vertical integration. At the same time, stricter cybersecurity clauses under IEC 62351 add both cost and competitive barriers, favoring vendors that can certify secure communication protocols.
Key Report Takeaways
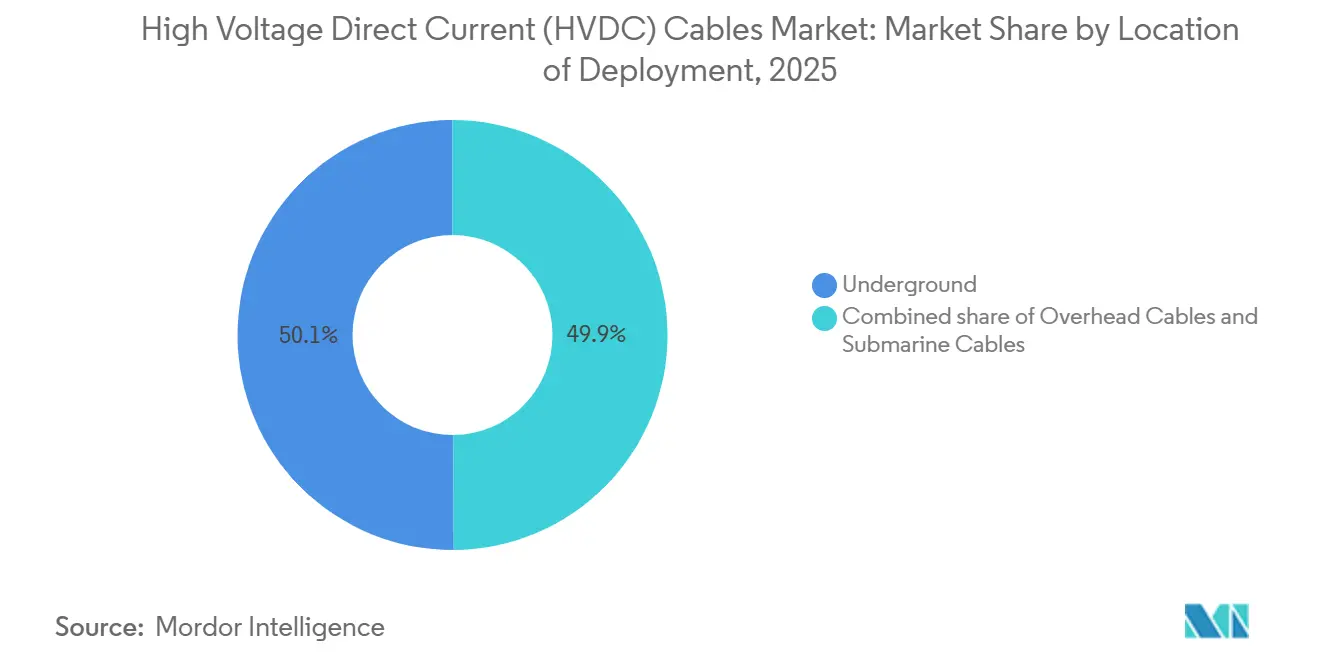
- By location of deployment, underground cables led with 50.1% HVDC cables market share in 2025; submarine cables are the fastest-growing deployment mode at a 10.5% CAGR through 2031.
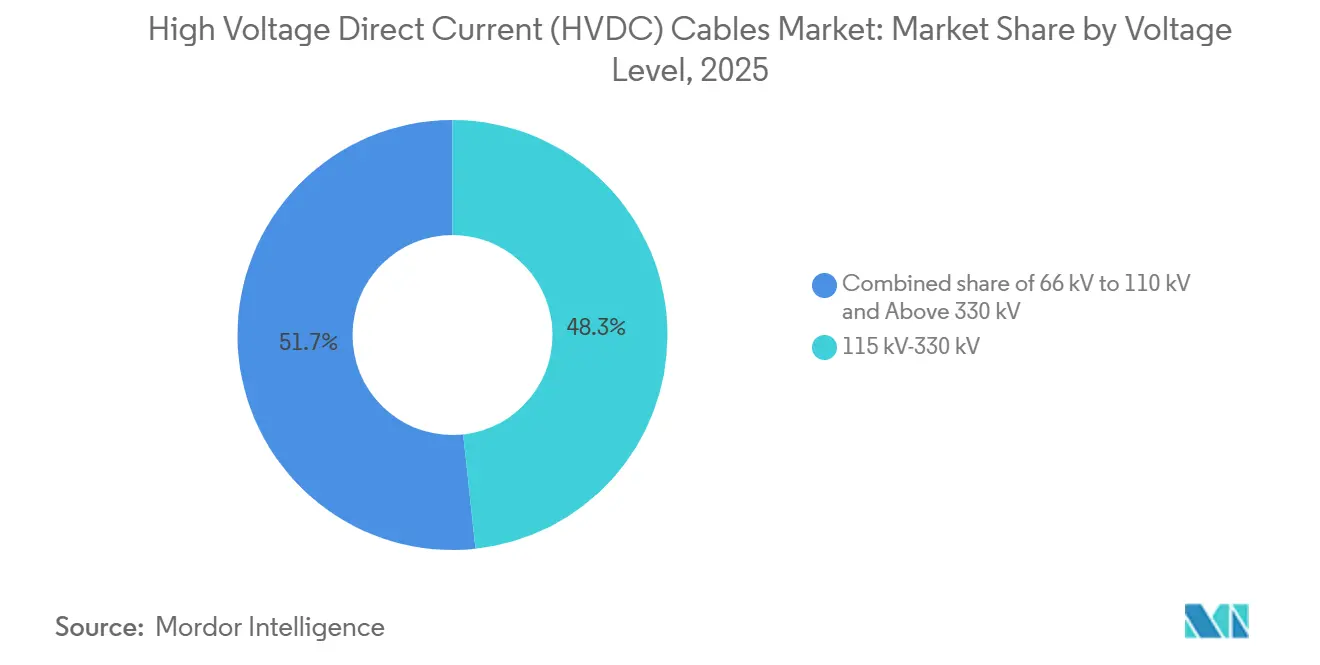
- By voltage level, the 115–330 kV band held 48.3% of the HVDC cables market size in 2025, while systems rated above 330 kV are expanding at a 9.0% CAGR to 2031.
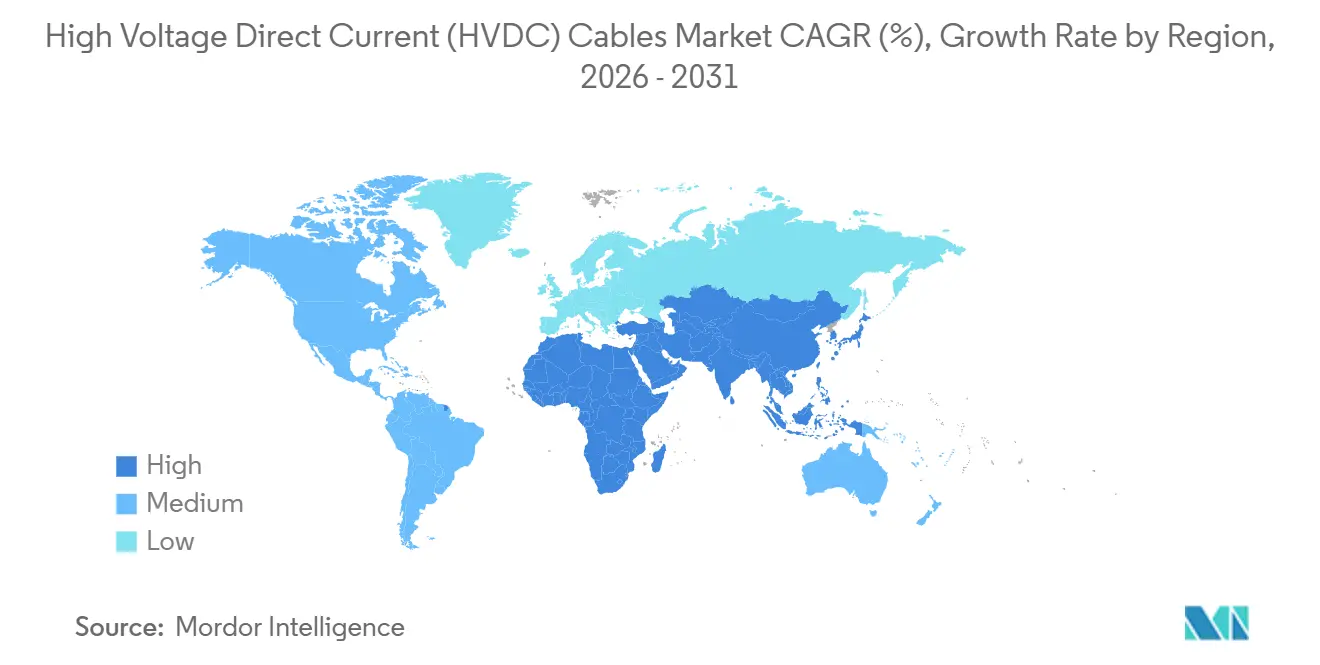
- By geography, Asia-Pacific captured 42.5% revenue in 2025 and is set to remain the largest regional pocket, projected to post a 9.8% CAGR over the outlook period.
Note: Market size and forecast figures in this report are generated using Mordor Intelligence’s proprietary estimation framework, updated with the latest available data and insights as of January 2026.
Market Trends and Insights
Drivers Impact Analysis of High Voltage Direct Current (HVDC) Cables Market*
| Driver | (~) % Impact on CAGR Forecast | Geographic Relevance | Impact Timeline |
|---|---|---|---|
| Accelerated offshore-wind interconnection projects | 2.3% | Europe (North Sea, Baltic), APAC (Taiwan, Japan, Australia) | Medium term (2–4 years) |
| Repowering of ageing AC interconnectors with HVDC links | 1.5% | Europe (UK-Continent, Nordics), North America (US-Canada) | Long term (≥ 4 years) |
| National super-grid initiatives in Asia & MENA | 2.8% | APAC (China, India, ASEAN), Middle East (GCC) | Long term (≥ 4 years) |
| Grid-forming converters enabling hybrid AC/DC grids | 1.2% | Global, early adoption in Europe & Australia | Medium term (2–4 years) |
| Copper price hedging driving aluminium-core HVDC cable demand | 0.9% | Global, concentrated in Asia-Pacific & Middle East | Short term (≤ 2 years) |
| Source: Mordor Intelligence | |||
Accelerated Offshore-Wind Interconnection Projects
Europe and Asia-Pacific are adding offshore wind capacity faster than onshore additions, creating a steady pull-through for submarine links that can move multi-gigawatt blocks over 100 km distances. Denmark’s Bornholm Energy Island hub will use a 3 GW HVDC backbone to export power to Denmark, Germany, and Poland by 2030.[1] In Australia, the 1.5 GW Marinus Link reached financial close in 2025 and will rely on ±500 kV extruded cable supplied by Prysmian. Ireland’s 700 MW Celtic Interconnector is under construction and will cut peaking fossil output on the island once active in 2027. Each of these projects demonstrates that offshore wind is no longer niche; it now determines vessel fleet sizing, cable-armoring standards, and even crew training.
Repowering of Ageing AC Interconnectors with HVDC Links
Many AC links built in the 1980s and 1990s are nearing end-of-life, and owners are opting for HVDC replacements that slash losses, add capacity, and allow asynchronous operation. National Grid confirmed in 2025 that it will scrap the 2 GW IFA link and replace it with a 3 GW voltage-source-converter system using Nexans 320 kV cables.[2] Norway’s Statnett is evaluating a similar upgrade for the NorNed link, which has faced insulation degradation outages. Repowering carries lower permitting risk as corridors already exist, yet it demands specialist decommissioning and marine coordination. The European Union’s 15% interconnection target for 2030 further accelerates this swap-out wave.
National Super-Grid Initiatives in Asia & MENA
China, India, and the Gulf states are rolling out ultra-high-voltage corridors that connect renewable resource zones with distant load centers. State Grid put three ±800 kV lines in service in 2025, adding 36 GW of transfer capacity.[3] India awarded a 6 GW Ladakh-Punjab link to a consortium in 2025, incorporating aluminium-core overhead conductors and underground entry sections. The Gulf Cooperation Council is progressing a 3 GW backbone that will eventually couple to South Asia and support synthetic-fuel exports. These corridors involve ticket sizes above USD 5 billion, pushing bidders to show balance-sheet strength, EPC depth, and local-content roadmaps.
Copper Price Hedging Driving Aluminium-Core HVDC Cable Demand
Copper futures averaged above USD 9,000 per tonne in late 2025, prompting cable firms to fast-track aluminium conductor lines. LS Cable qualified a ±320 kV aluminium-core cable and booked a 400 MW order for a wind collector in South Korea in 2025.[4] Taihan is piloting hybrid aluminium-copper conductors for harsh climates in the Middle East. Aluminium offers 60% weight savings and 40% cost advantage but raises losses and demands tighter manufacturing tolerances. Utilities in price-sensitive Asia-Pacific and Gulf markets are now specifying aluminium in tenders, creating a parallel supply chain.
Restraints Impact Analysis of High Voltage Direct Current (HVDC) Cables Market*
| Restraint | (~) % Impact on CAGR Forecast | Geographic Relevance | Impact Timeline |
|---|---|---|---|
| Complex cross-border permitting for submarine corridors | -1.4% | Europe (North Sea, Mediterranean), ASEAN | Medium term (2–4 years) |
| Volatility in XLPE insulation supply chain | -0.8% | Global, acute in Europe & North America | Short term (≤ 2 years) |
| Rising distributed generation reducing long-haul projects | -0.7% | North America, Western Europe | Long term (≥ 4 years) |
| Cyber-security requirements inflating project CAPEX | -0.5% | Global, stringent in North America & EU | Medium term (2–4 years) |
| Source: Mordor Intelligence | |||
Complex Cross-Border Permitting for Submarine Corridors
Subsea projects cross multiple economic zones and need clearances from maritime, environmental, defense, and fisheries bodies, often extending timelines by more than five years. The NeuConnect link from the UK to Germany was pushed to 2028 due to routing debates and fishing-industry objections. LionLink required environmental studies across 14 marine protected areas, which took 18 extra months. A European one-stop-shop concept exists on paper but is not yet harmonized, while the ASEAN Power Grid faces similar hold-ups over transit fees and fault liabilities. These delays raise financing costs and deter merchant-model sponsors.
Volatility in XLPE Insulation Supply Chain
Dow and Borealis dominate high-grade XLPE resin capacity, and each faced force-majeure events in 2024, stretching lead times to 26 weeks in early 2025. Resin prices rose 18% year-on-year, and NKT reported a four-month cable delivery delay for the Baltic Power project. With few qualified dielectric alternatives, cable makers are investing upstream; Prysmian bought into a European compounder in 2025 to lock in feedstock. Qualification for new materials can take up to two years, leaving little short-term relief.
*Our forecasts treat driver/restraint impacts as directional, not additive. The impact forecasts reflect baseline growth, mix effects, and variable interactions.
High Voltage Direct Current (HVDC) Cables Market Segment Analysis
By Location of Deployment:
Submarine Cables Emerge as the Fastest-Growing SegmentSubmarine cables accounted for the smallest share in 2025, yet are projected to post a 10.5% CAGR between 2026 and 2031, outpacing underground and overhead lines as offshore wind build-outs multiply. The HVDC cables market size for submarine projects is forecast to widen in tandem with Europe’s North Sea Wind Power Hub plan, which alone will need about 15,000 km of cabling. Prysmian’s new P-Laser vessel, operational since 2024, can lay 525 kV cables in 3,000 m water depths, allowing schemes in the Norwegian Sea and off Japan.
Underground cables retained a 50.1% share in 2025 thanks to urban feeders in Beijing, Shanghai, and Mumbai, where land constraints block overhead lines. Nexans delivered 320 kV cables for the 230 km Delhi–Agra line in 2025. Overhead networks dominate China’s interior ±800 kV backbone because per-kilometer costs run 40% to 60% lower. Growth here is slower as China’s core grid nears saturation, yet Africa and South America still rely on overhead links to unlock remote hydro and solar assets.

By Voltage Level:
Above 330 kV Systems Gain GroundThe ultra-high-voltage segment, defined as above 330 kV, is set to grow at 9.0% through 2031, fueled by China’s ±800 kV corridors and India’s planned ±1,100 kV pilot. Hitachi Energy’s modular multilevel converter on the North Sea Link has proven 99.5% availability at ±525 kV since 2024.
The 115–330 kV band still held 48.3% market share in 2025 and remains the workhorse for medium-distance interconnectors such as Germany–Norway’s NordLink. Industrial niches like semiconductor fabs use 66–110 kV point-to-point schemes; LS Cable shipped a ±80 kV system to a Korean fab in 2025. The bifurcation shows utilities embracing ultra-high-voltage for thousand-kilometer corridors while retaining mid-voltage links for incremental upgrades.
Geography Analysis
APAC High Voltage Direct Current (HVDC) Cables Market
Asia-Pacific led the HVDC cables market with 42.5% revenue in 2025 and is projected to grow at a 9.8% CAGR to 2031. China commissioned the 2,090 km Baihetan–Jiangsu ±800 kV line in 2025 and plans three more ultra-high-voltage projects by 2031. India’s green-energy corridor tendered 6 GW of capacity in 2025, drawing bids from Prysmian, ZTT, and Hengtong. Japan and South Korea are pushing subsea links to move offshore wind from Hokkaido and the Yellow Sea to demand centers; Sumitomo Electric and LS Cable are front-runners in these awards.
Europe High Voltage Direct Current (HVDC) Cables Market
Europe ranks second, driven by offshore wind hubs and repowering of legacy AC corridors. The Bornholm Energy Island, Viking Link, and LionLink schemes together top 10 GW of capacity and more than 2,000 km of cable. Germany’s regulator cleared four north-south HVDC corridors in 2024, with 80% underground routing to placate public resistance. The United Kingdom seeks to replace radial offshore connections with a meshed backbone, aiming for GBP 6 billion savings and 30% less cabling.
The Americas and MEA High Voltage Direct Current (HVDC) Cables Market
North America focuses on cross-border projects that tap Canadian hydro for U.S. load pockets. The 1.25 GW Champlain Hudson Power Express will start service in 2026, bringing power into New York City via a 545 km ±320 kV cable. In the Gulf, a 3 GW spine linking Saudi Arabia, the UAE, and Oman will smooth solar ramp rates and prepare for electricity exports to South Asia. South America and Africa remain early-stage but show proof points such as Brazil’s Belo Monte ±800 kV line and Egypt–Saudi Arabia’s 3 GW interconnection.
Regulatory Landscape
HVDC cable projects are increasingly influenced by interoperability and cybersecurity requirements, alongside permitting. In Europe, the European Commission Grid Action Plan and related grid policy work have focused on streamlining and harmonizing technical specifications for HVDC infrastructure. ACER has also advanced recommendations to amend the HVDC Network Code to cover newer connection points, including offshore demand facilities, power-to-gas units, and offshore storage.
ENTSO-E has been developing an assessment framework for 525 kV HVDC land and submarine cable systems, coordinated with CIGRE working groups to align prequalification and type-testing practices. This, in turn, affects which suppliers can qualify for high-capacity corridors. In the United States, the DOE HVDC CORE Initiative sets a 35% cost-reduction target by 2035 for the energy transmitted by HVDC systems, and the DOE Office of Electricity issued the draft National Transmission Needs Study for public comment on July 8, 2026. Across markets, industry testing guidance, such as CIGRE technical recommendations for DC cable systems up to 800 kV, continues to shape tender specifications before formal codification, reinforcing compliance-driven barriers for smaller or non-prequalified entrants.
Value Chain Analysis
The HVDC cable value chain begins with upstream inputs, including copper or aluminium rod, steel armoring wire, and high-grade XLPE insulation compounds, and then moves through conductor drawing and stranding, extrusion and curing, and factory and type testing. Downstream stages cover logistics, jointing and accessory supply, and installation. For submarine projects, these later steps are closely tied to specialized marine assets, such as cable-laying vessels and trenching and burial tools, and to a limited pool of qualified installers. As a result, procurement increasingly bundles manufacturing and installation under turnkey EPC-style delivery.
The supplier base for high-capacity extruded systems is concentrated among a small set of qualified producers, including Prysmian, Nexans, NKT, Sumitomo Electric, and leading Asian manufacturers such as ZTT and Hengtong, with the industry coalescing around the 525 kV class for many large subsea links. Bottlenecks remain most visible in manufacturing slots and insulation materials, where qualification cycles and limited high-grade compound supply extend lead times and reinforce long-term framework contracting. New manufacturing lines require multi-year build and qualification windows and large capital commitments, which has pushed both backward integration and public support to accelerate capacity. Furukawa Electric’s 2025 selection under Japan METI’s GX Supply Chain Construction Support Project aims to establish 500 kV-class HVDC cable production with a subsidy of up to JPY 30.7 billion. Collaboration is also increasing, including Taihan signing HVDC collaboration MOUs with Jan De Nul and Boskalis in June 2026 and Sumitomo Electric partnering with Van Oord under a 2026 framework for SSEN Transmission.
Competitive Landscape
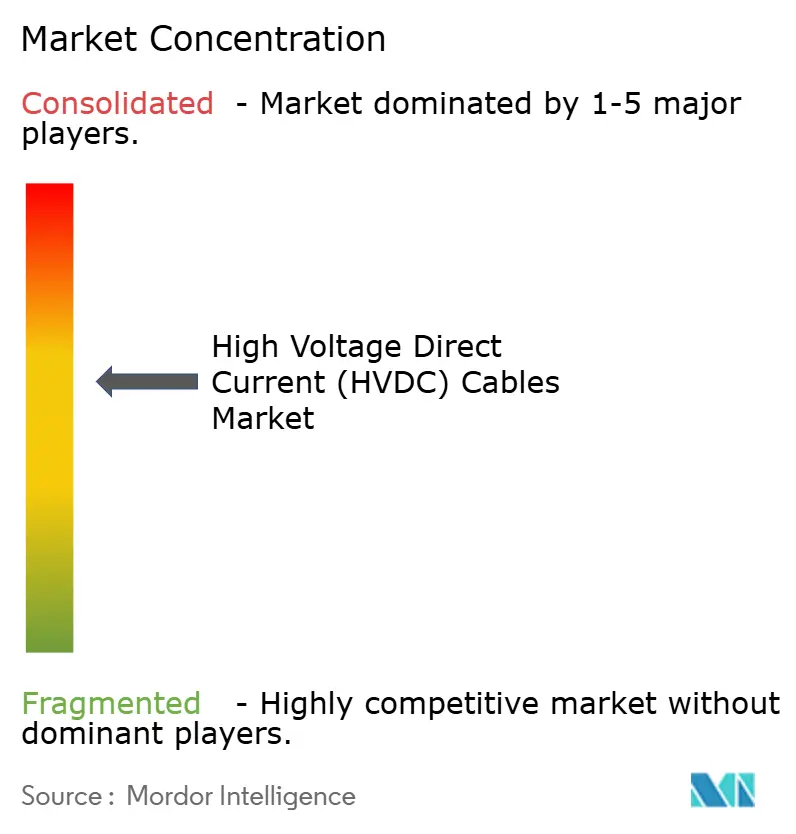
The HVDC cables market displays moderate concentration. The top five suppliers, Prysmian, Nexans, NKT, Sumitomo Electric, and Hitachi Energy, captured roughly 60% of submarine and underground revenue in 2025. Their edge lies in vertical integration that spans resin compounding, conductor fabrication, converter stations, and marine installation vessels. Prysmian’s 2025 purchase of a stake in a European XLPE producer secures feedstock and shortens lead times. NKT added a second cable-laying vessel in 2025, enabling multi-route installation on gigawatt-scale offshore hubs.
Asian firms leverage cost advantages and local demand. ZTT and Hengtong expanded ultra-high-voltage conductor capacity by 40% in 2025 and now target Middle East export bids. LS Cable and Taihan are early movers in aluminium-core and hybrid conductors, focusing on Gulf and Asia-Pacific projects sensitive to copper prices.
Technology differentiation centers on grid-forming control algorithms and new cable materials. Hitachi Energy filed a 2024 patent for a modular converter that integrates electrolyzer controls, positioning for corridors that co-locate HVDC cables with hydrogen pipelines. Compliance with IEC 62351 cybersecurity clauses adds cost and deters smaller entrants, pushing utilities toward established brands that can certify secure communication paths.
High Voltage Direct Current (HVDC) Cables Industry Leaders
-
Sumitomo Electric Industries Ltd
-
NKT AS
-
Nexans SA
-
Prysmian Group
-
Hitachi Energy Ltd
- *Disclaimer: Major Players sorted in no particular order
High Voltage Direct Current (HVDC) Cables Market Companies Covered in this Report
- Prysmian Group
- Nexans SA
- NKT A/S
- Sumitomo Electric Industries Ltd
- Hitachi Energy Ltd
- LS Cable & System Ltd
- Taihan Cable & Solution Co. Ltd
- ZTT Group
- Furukawa Electric Co. Ltd
- Hengtong HV Power System
- KEI Industries Ltd
- Polycab India Ltd
- Brugg Kabel AG
- Südkabel GmbH
- Jiangsu Zhongtian Technology
- TF Kable
- Dubai Cable Company (Ducab)
- Southwire Company
- General Cable (Prysmian)
- Gulf Cable & Electrical Ind.
Read Analysis of High Voltage Direct Current (HVDC) Cables Companies
Market Opportunities and Future Outlook
Large, multi-gigawatt interconnectors and reinforced offshore transmission backbones are creating clear whitespace for suppliers that can secure long-duration production slots, qualify at 525 kV, and deliver integrated design, manufacture, and installation. In the United Kingdom, the Eastern Green Link program shows how mega-project procurement and long-term capacity reservation are changing contracting behavior. National Grid awarded Prysmian a GBP 2 billion contract for the 2 GW Eastern Green Link 4 in February 2026, and NKT signed major agreements in 2026 tied to Eastern Green Link 3, indicating that TSOs are using large awards and frameworks to lock in supply across multi-year build programs.
Cross-border and cross-continent corridors also widen the addressable scope for HVDC cables and related accessories, particularly when public funding de-risks complex links. The 600 MW Elmed interconnection between Italy and Tunisia secured European Commission Connecting Europe Facility support of EUR 307 million, with Hitachi Energy receiving a EUR 770 million converter-station contract in June 2026 and Prysmian receiving a notice to proceed for the submarine interconnection portion (about EUR 460 million). In North America, modernization and urban infeed projects are adding demand beyond greenfield corridors, highlighted by Minnesota Power breaking ground on the USD 900 million Square Butte HVDC modernization in 2026, supported by USD 75 million in combined state and federal funding. Asia continues to anchor ultra-high-voltage build-outs, with State Grid bringing the Shaanbei-Anhui +-800 kV UHVDC project into operation in June 2026 (1,055 km, 8 million kW).
Recent Industry Developments in High Voltage Direct Current (HVDC) Cables Market
- July 2026: Sumitomo Electric and Van Oord signed a framework agreement with SSEN Transmission covering HVDC subsea cable systems for the 525 kV Shetland 2 HVDC link. The arrangement combines cable supply and marine delivery capabilities, strengthening consortium-based execution for multi-year UK transmission build-outs and helping reserve scarce manufacturing and installation capacity.
- June 2026: Hitachi Energy secured a EUR 770 million contract from Terna and STEG for converter stations for the 600 MW Elmed HVDC interconnector between Italy and Tunisia. The award advances a strategic Europe to North Africa power corridor and reinforces demand for matched converter and cable system integration on cross-border subsea links.
- March 2025: Nexans signed a framework agreement exceeding EUR 1 billion with France's RTE for the design, manufacture, and supply of HVDC cables supporting offshore wind connections. The deal highlights how TSOs are shifting to long-term frameworks to secure supply, improve delivery certainty, and standardize technical requirements across multiple projects.
High Voltage Direct Current (HVDC) Cables Market Report Scope and Research Methodology
Market Definition and Coverage
The HVDC cables market is defined as the value of cables used to transmit electricity using high voltage direct current, across land and sea routes, for utility and large power transmission needs.
Scope exclusions: Low and medium voltage cables, internal wiring inside equipment, and non-power signal cables are excluded from this sizing.
Segments Covered in This Report
- By Location of Deployment
- Overhead Cables
- Underground Cables
- Submarine Cables
- By Voltage Level
- 66 kV to 110 kV
- 115 kV to 330 kV
- Above 330 kV
- By Geography
- North America
- United States
- Canada
- Mexico
- Europe
- Germany
- United Kingdom
- France
- Italy
- Russia
- Rest of Europe
- Asia-Pacific
- China
- India
- Japan
- South Korea
- ASEAN Countries
- Rest of Asia-Pacific
- South America
- Brazil
- Argentina
- Rest of South America
- Middle East and Africa
- Saudi Arabia
- United Arab Emirates
- South Africa
- Egypt
- Rest of Middle East and Africa
- North America
Data Sources, Market Sizing, and Validation
Desk Research
Desk research was used to set the factual base for the model, especially on grid additions, renewable buildouts, and cross-border interconnector activity that drives HVDC demand. Public datasets and explainers from sources such as the International Energy Agency, the International Renewable Energy Agency, the World Bank, and energy ministries or regulators that publish grid and power statistics were used as references.
To keep assumptions grounded, technical and project cues were also taken from sources such as ENTSO-E planning documents, US EIA publications, and open literature that discusses HVDC links, voltage classes, and typical installation routes. Company annual reports, investor decks, and reputable press were reviewed for capacity expansions, order visibility, and mix shifts between submarine, underground, and overhead routes. Where needed, paid subscriptions were used for company financials and for tracking patents and major tenders, and this list is illustrative rather than exhaustive because additional sources were reviewed for validation and clarification.
Primary Interviews and Surveys
Primary interviews and surveys focused on validating what drives spend per kilometer, how quickly project pipelines convert to orders, and how voltage and route choices shift by region. Input was collected from cable makers, EPC participants, utilities, developers, and engineering advisers across APAC, EMEA, and the Americas, and we compared supply-side views with demand-side procurement patterns.
Distribution of primary research fieldwork respondents
| Company type | Respondent position | Region |
|---|---|---|
| Top tier: 26% | CXOs: 13% | APAC: 49% |
| Mid tier: 60% | Functional/Unit leaders: 35% | EMEA: 30% |
| Smaller Players: 14% | Managers: 52% | Americas: 21% |
Market-Sizing & Forecasting
Sizing starts from a top-down demand pool that is reconstructed using HVDC link announcements and build plans, grid investment signals, and the split of projects by route type, then translated into cable value using typical route lengths and spend per kilometer. The model is built around a small set of inputs that can be explained and updated, including the share of submarine versus underground links, the mix by voltage band (66 to 110 kV, 115 to 330 kV, and above 330 kV), average route length ranges, and the timing of large offshore wind and interconnector awards.
Results are corroborated with selective bottom-up approximations, such as supplier revenue exposure checks, sampled project values from public award notices, and reasonableness tests on implied installed kilometers. When project information is incomplete, gaps are filled using conservative proxy assumptions based on comparable projects in the same voltage and route category, and these are re-checked during interviews. For forecasting, scenario analysis is used so that optimistic and conservative cases can be built around permitting delays, supply-chain lead times, and the pace of renewable and grid integration, and the final path is chosen based on what experts consider most likely.
Data Validation & Update Cycle
Validation is done in layers so that obvious errors are caught early, while less visible issues are still identified before sign-off. We compare the implied market totals against independent signals like announced HVDC corridor kilometers, offshore wind connection timelines, and converter station build activity, and then investigate any large variances.
If a number looks off, assumptions are revisited, and respondents are re-contacted when a project schedule or a pricing point appears to have shifted. Before release, outputs go through a multi-step internal review that checks math consistency, currency handling, and year alignment across regions. Reports are refreshed annually, and interim updates are made when major policy changes, large project awards, or sudden cost movements materially change the outlook. A final update pass is done close to delivery so clients receive a current view.
Mordor Intelligence's Hvdc Cables Market Size Compared With Other Published Estimates
Published market sizes for HVDC cables do not always match because the included scope and timing choices are not the same across studies. Differences show up quickly when one estimate counts only the cable portion, while another folds in adjacent HVDC system components or uses a different project timing assumption.
Another common driver is how price is treated. Cable pricing moves with metals, installation complexity, and the share of submarine routes, and some estimates apply a single price trend across regions. The spread is often explained by whether submarine, underground, and overhead routes are priced separately and whether the voltage mix is updated as project pipelines change. This is explicitly modeled and refreshed in Mordor Intelligence.
Benchmark comparison
| Source | Market Size | Gaps in Research Methodology |
|---|---|---|
| Mordor Intelligence | USD 11.70 B (2026) | |
| Industry Publisher A | USD 13.80 B (2024) | Uses a different base year and may blend related HVDC equipment and services with cable value, which can lift the number when project pipelines are counted earlier than delivery. |
| Research Portal B | USD 11.10 B (2024) | Often applies a single global growth curve with limited clarity on route split and voltage mix, which can miss the premium from submarine projects and higher-voltage deployments. |
The table shows that the gap is less about arithmetic and more about what is counted and when it is counted. When route type, voltage band, and project timing are made explicit, the final value becomes easier to trace back to demand signals and to update as new awards and delays occur.
Key Questions Answered in the Report
What is the forecast value of the hvdc cables market by 2031?
The HVDC cables market is projected to reach USD 17.27 billion by 2031.
Which regional block will lead growth through 2031?
Asia-Pacific is expected to post the highest regional CAGR of 9.8% on the back of Chinese and Indian ultra-high-voltage build-outs.
Which deployment mode is expanding the fastest?
Submarine links, driven by offshore wind, show the quickest pace at a 10.5% CAGR between 2026 and 2031.
Which voltage segment is gaining the most traction?
Systems rated above 330 kV are expanding at a 9.0% CAGR as utilities pursue longer, higher-capacity corridors.
Who are the top suppliers by revenue?
Prysmian, Nexans, NKT, Sumitomo Electric, and Hitachi Energy together accounted for about 60% of submarine and underground sales in 2025.