
Market Overview
| Study Period | 2021 - 2031 |
|---|---|
| Market Size (2026) | USD 37.32 Billion |
| Market Size (2031) | USD 49.35 Billion |
| Growth Rate (2026 - 2031) | 5.74 % |
| Fastest Growing Market | Asia Pacific |
| Largest Market | Asia Pacific |
| Market Concentration | Medium |
Major Players *Disclaimer: Major Players sorted in no particular order Image © Mordor Intelligence. Reuse requires attribution under CC BY 4.0. | |
Backup Power Systems Market Analysis by Mordor Intelligence
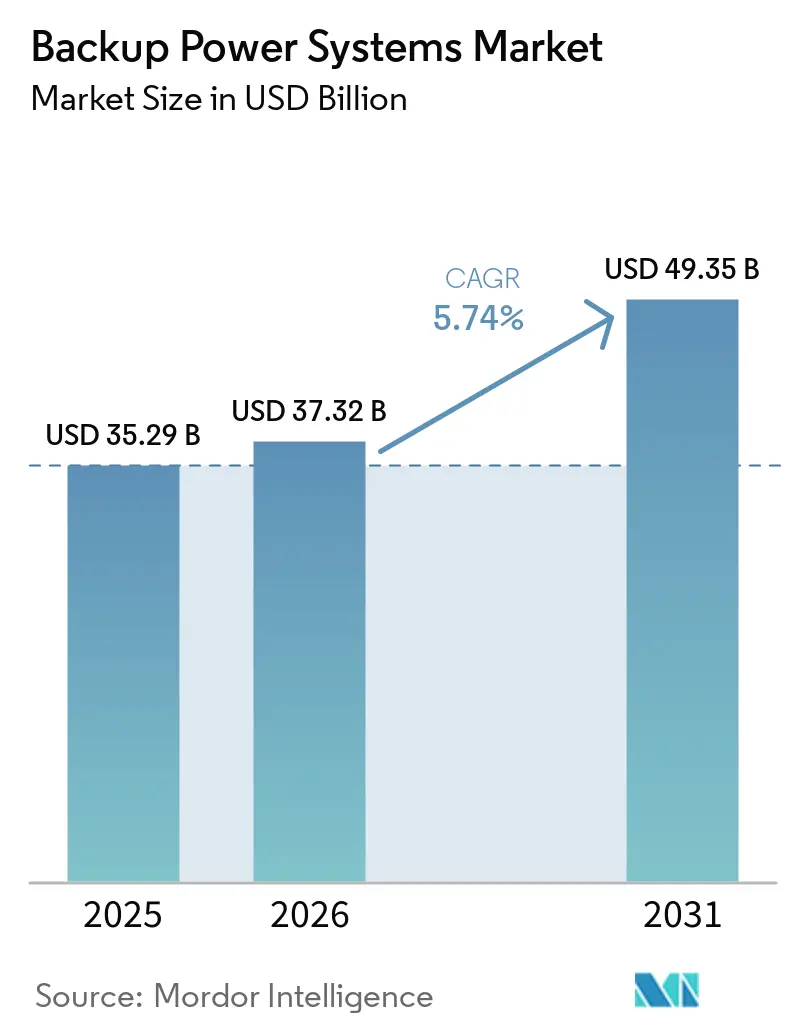
The Backup Power Systems Market size was valued at USD 35.29 billion in 2025 and estimated to grow from USD 37.32 billion in 2026 to reach USD 49.35 billion by 2031, at a CAGR of 5.74% during the forecast period (2026-2031).
Rapid data-center construction, weather-driven outage frequency, and automation in manufacturing combine to keep demand on an upward trajectory. Diesel generators remain the workhorses for remote and heavy-duty sites, yet battery energy storage systems (BESS) are accelerating as costs decline and environmental regulations reshape technology selection. Mid-range 501-2,000 kVA units are deployed the widest because their modular designs align with commercial buildings and edge facilities. Utilities’ peak-shaving tariffs and AI-enabled predictive maintenance create new value pools for vendors, while regulatory pressure on emissions splits the market between urban clean-tech solutions and rural diesel-centric projects.
Key Report Takeaways
- By technology, diesel generators held 39.74% revenue share in 2025, whereas BESS is projected to expand at a 13.1% CAGR through 2031.
- By power rating, the 501-2,000 kVA segment accounted for 31.28% of the backup power systems market share in 2025 and is set to grow at a 7.43% CAGR to 2031.
- By application, standby and emergency power represented 53.45% of demand in 2025, while peak-shaving and load-management applications are expected to advance at an 8.31% CAGR through 2031.
- By end-user, industrial and manufacturing facilities led with a 23.22% share in 2025; data centers are forecast to post the fastest growth rate of 10.62% CAGR over the outlook period.
- By geography, the Asia-Pacific region commanded 39.12% of revenue in 2025 and is growing at a 6.18% CAGR, driven by data-center expansion and automation investments across China, India, and Japan.
Note: Market size and forecast figures in this report are generated using Mordor Intelligence’s proprietary estimation framework, updated with the latest available data and insights as of 2026.
Global Backup Power Systems Market Trends and Insights
Drivers Impact Analysis*
| Driver | (~) % Impact on CAGR Forecast | Geographic Relevance | Impact Timeline |
|---|---|---|---|
| Grid-outage frequency & economic losses | +1.20% | North America & Asia-Pacific | Medium term (2-4 years) |
| Expansion of hyperscale & edge data-centres | +1.80% | Global | Long term (≥ 4 years) |
| 24 × 7 automated industrial operations | +0.90% | Asia-Pacific & North America | Medium term (2-4 years) |
| Regulatory mandates for critical facilities | +0.70% | North America & Europe | Short term (≤ 2 years) |
| Off-grid EV fast-charging corridors | +0.40% | North America & Europe | Long term (≥ 4 years) |
| AI-driven predictive maintenance adoption | +0.30% | Global | Medium term (2-4 years) |
| Source: Mordor Intelligence | |||
Grid-Outage Frequency & Economic Losses
Utilities are facing more frequent and severe-weather failures, and 80% of major U.S. outages between 2000 and 2023 were weather-related. Prolonged blackouts prompt enterprises to view backup capacity as operational insurance, particularly when downtime exceeds USD 100,000 per hour. Texas microgrid construction surged after the 2021 winter storm, with projects costing USD 2 million–USD 5 million per MW.(1)Federal Reserve Bank of Dallas, “Microgrid Investment After Winter Storm,” dallasfed.org Investments therefore favor higher-capacity systems that bridge multi-day disruptions. The modernization of aging grids trails behind reliability needs, so distributed assets remain a critical hedge through 2030. These conditions collectively drive the growth of the backup power systems market.
Expansion of Hyperscale & Edge Data-Centres
Global data-center power demand is on track to reach 35 GW in the United States alone by 2030, with hyperscalers accounting for 60% of that growth. Single campuses now request 1 GW or more of backup capacity, dwarfing previous facility norms. Edge roll-outs multiply the node count, each demanding 50-500 kW of standby supply to guarantee sub-10-millisecond latency. Battery systems gain favor for their silent operation and instantaneous switchover, a must in urban zones with strict noise limits. Renewable-energy power-purchase agreements introduce intermittency, prompting the development of hybrid diesel-battery stacks to protect AI workloads, thereby solidifying robust demand for the backup power systems market.
24 × 7 Automated Industrial Operations
Industry 4.0 adoption has compressed tolerance for power disturbances because robotics, sensors, and just-in-time flows leave no buffer for downtime. Semiconductor, pharmaceutical, and automotive plants can lose millions of dollars in scrap within minutes of an outage.(2)Energy Tech, “Industry 4.0 and Power Quality,” energytech.com Backup designs therefore target near-instantaneous transfer and extended duration. Smart-factory blueprints embed edge servers that also need UPS-grade protection to maintain closed-loop quality control. The manufacturing reshoring in North America and Europe amplifies these needs, ensuring stable growth for the backup power systems market.
Regulatory Mandates for Critical Facilities
Standards such as NFPA 110 oblige hospitals and telecom operators to meet strict runtime and start-up criteria. The U.S. Federal Communications Commission requires 72-hour backup in designated fire-risk regions, driving non-discretionary purchases. Cybersecurity and Infrastructure Security Agency guidance prioritizes redundancy, favoring dual-fuel and hybrid configurations. Urban air-quality rules are accelerating the shift toward batteries and fuel cells, as diesel emissions often breach local codes. These rules collectively anchor steady procurement and reinforce the outlook for the backup power systems market size.
Restraints Impact Analysis*
| Restraint | (~) % Impact on CAGR Forecast | Geographic Relevance | Impact Timeline |
|---|---|---|---|
| Volatile diesel-fuel costs & high OPEX | -0.80% | Global | Short term (≤ 2 years) |
| Substitution by long-duration BESS | -1.10% | North America & Europe | Medium term (2-4 years) |
| Capital-intensive large-scale installs | -0.60% | Global | Medium term (2-4 years) |
| Urban low-noise / ultra-low-emission zoning | -0.40% | North America & Europe | Long term (≥ 4 years) |
| Source: Mordor Intelligence | |||
Volatile Diesel-Fuel Costs & High OPEX
Fuel accounts for up to 70% of a diesel set's lifetime operating expense, and price swings erode budgeting certainty. The Japan Data Center Council cautioned that simultaneous generator runs could strain regional diesel supply chains during lengthy emergencies.(3)Data Center Knowledge, “Diesel Supply Chains Under Stress,” datacenterknowledge.comCarbon levies inflate delivered fuel prices, raising the total cost of ownership relative to batteries. Storage regulations in city centers often cap on-site volumes, forcing more frequent deliveries that raise logistics risk. These factors temper diesel uptake and moderate the growth rate of the backup power systems market.
Substitution by Long-Duration BESS
Four-hour-plus battery systems now land in the USD 232-293 per kWh range, undercutting diesel for many standby duties. They avoid fuel, noise, and emissions compliance, and top technology firms have publicly shifted procurement in this direction. Global BESS capacity reached 150 GW, helped by 40% year-over-year cost declines. Hybrid diesel-plus-battery installs still proliferate, yet every new order chips away at the diesel share of the backup power systems market.
*Our forecasts treat driver/restraint impacts as directional, not additive. The impact forecasts reflect baseline growth, mix effects, and variable interactions.
Segment Analysis
By Technology: Battery systems narrow the gap with diesel dominance
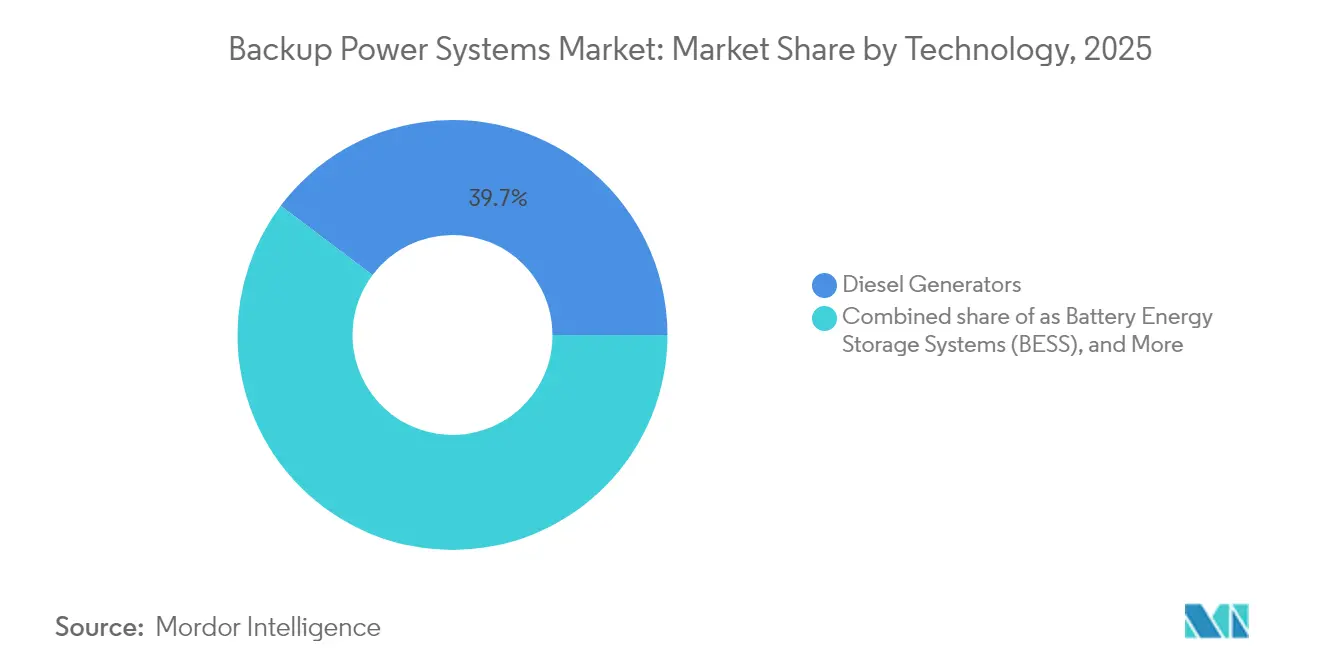
The backup power systems market size for diesel generators accounted for a 39.74% share, whereas BESS captured USD 5.76 billion and is projected to advance at a 13.1% CAGR through 2031. Diesel’s entrenched fuel logistics keep it essential for remote mines and heavy industry, yet emissions caps motivate data-center and healthcare operators to pivot toward battery backup solutions using lithium-ion and emerging sodium-ion packs. The backup power systems market share for gas generators remains resilient because natural-gas pipelines offer extended runtimes during grid failures. UPS platforms keep IT racks online for seconds to minutes, bridging the gap until larger assets engage. Hybrid sets that blend PV, batteries, and diesel cut fuel consumption by 35% on islanded microgrids, improving project economics while satisfying carbon-reduction pledges. Fuel-cell pilots in California data centers illustrate future pathways if hydrogen supply chains mature.
A widening supplier base is reducing BESS system costs by 8-10% annually, and installations above 2 MWh now meet four-hour autonomy targets for edge campuses. Technology vendors embed AI controllers to cycle batteries for peak shaving, thereby monetizing the same hardware outside outage events. That dual-value model lifts return on investment and accelerates adoption across the backup power systems market.



By Power Rating: Mid-range modules head mainstream adoption
Units rated 501-2,000 kVA captured 31.28% of the backup power systems market share in 2025, due to their suitability for mid-tier data halls, hospitals, and light-industrial campuses. Their 7.43% CAGR outlook exceeds that for smaller residential classes, where portable power stations satisfy only critical loads for a few hours. Standardized 1 MW blocks enable operators to scale in 1 MW increments, reducing engineering lead times by 25% compared to bespoke builds. Above-2,000 kVA packages dominate utility-scale stations and petrochemical complexes; however, order cycles are lumpy and tied to the approval of megaprojects.
Segments below 280 kVA serve telecom towers and retail stores, with lithium-iron-phosphate batteries replacing lead-acid banks to curb field maintenance. Vendors integrate remote diagnostics, allowing a single technician to oversee hundreds of dispersed installations, thereby lowering operating costs and supporting volume growth in the backup power systems market.
By Application: Peak shaving turns backup into a revenue asset
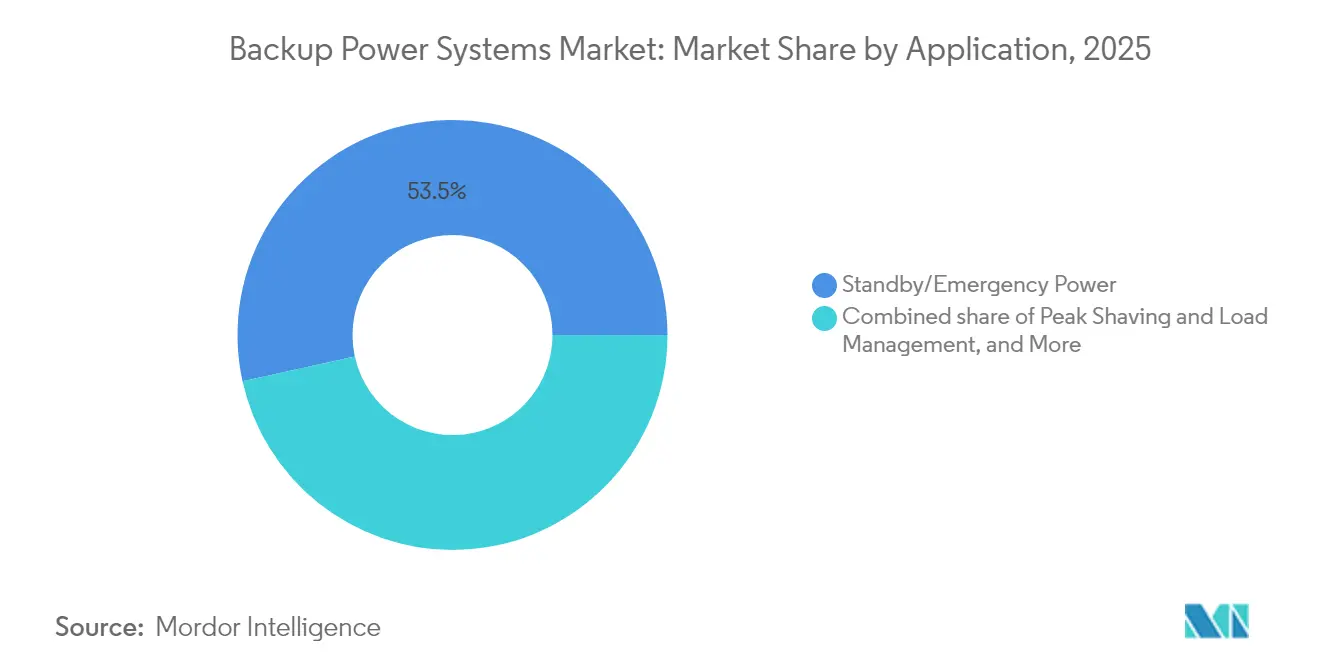
Standby and emergency duty held 53.45% of demand in 2025 as compliance rules oblige hospitals and telecom hubs to install life-safety power. Utilities’ rising demand charges, sometimes topping USD 20/kW per month, spur commercial users to invest in assets that shave peaks and store cheap off-peak energy. That function underpins an 8.31% CAGR for peak-shaving systems through 2031, boosting their market share in backup power systems. Prime-power sets remain indispensable for off-grid oil, gas, and mining sites; however, these markets are growing modestly as fuel costs and ESG scrutiny increase operating hurdles. Remote microgrids that combine solar and battery energy storage systems lengthen generator maintenance intervals from 500 to 1,000 hours, reducing lifetime OPEX.
By End-User: Data centers sprint ahead of industrial stalwarts
Industrial and manufacturing facilities accounted for 23.22% of revenue in 2025, primarily relying on diesel and gas engines to secure automated lines against costly downtime. Yet hyperscale data-center operators are signing multi-year purchase agreements that propel an 10.62% CAGR for their segment. Each 100 MW cloud campus now budgets upward of USD 300 million on dedicated backup assets, often split between engines and megawatt-scale BESS. The healthcare and telecom sectors maintain steady replacement cycles, while the residential niche expands, where wildfires and storms increase outage duration. Government and defense buyers specify redundant N+2 architectures that favor dual-fuel machines, thereby sustaining specialized demand within the backup power systems industry.
Geography Analysis
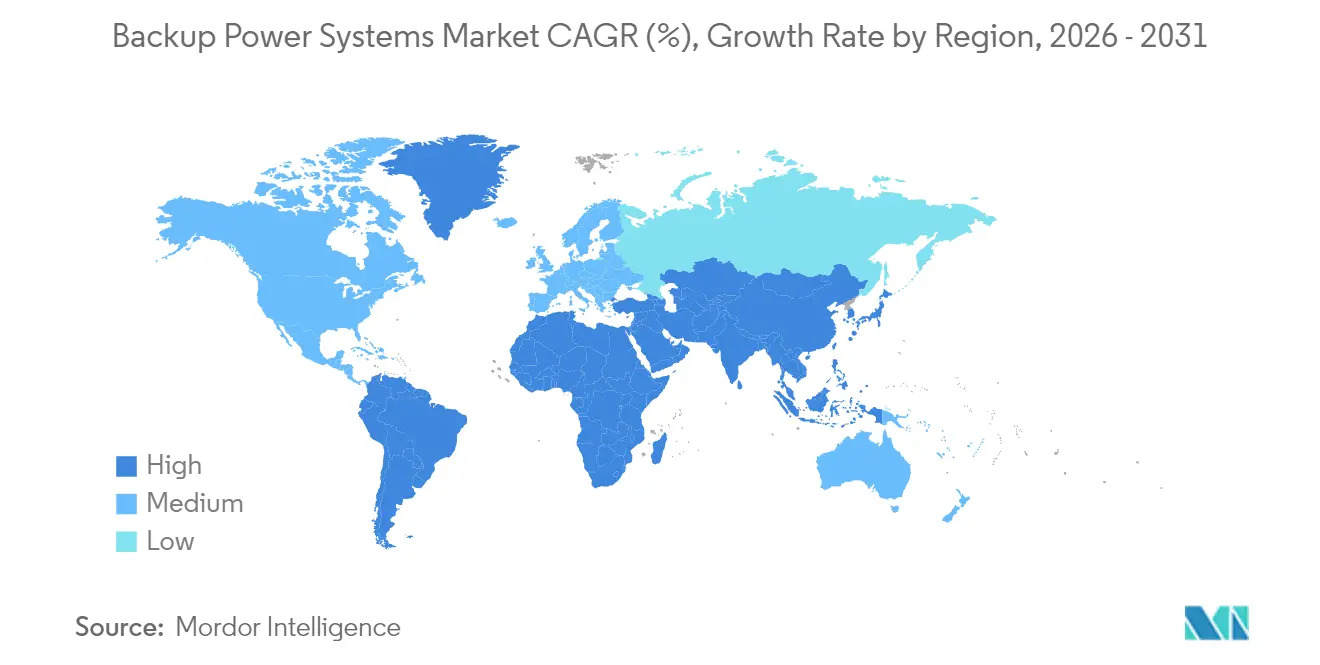
Asia-Pacific captured 39.12% of 2025 revenue, and its 6.18% CAGR remains the highest among regions as China, India, and Japan add both hyperscale data halls and smart-factory capacity CBRE.COM. Chinese policy drives local battery suppliers to ramp production, which lowers regional costs and fuels further adoption. India’s Production-Linked Incentive scheme for electronics stimulates the construction of new fabs, all of which require high-reliability backup. Japan’s utilities pledge JPY 150 billion (USD 1.04 billion) in grid reinforcements tied to data-center clusters, spurring parallel backup system orders.
North America ranks second, driven by US cloud-provider spending and weather-related outage exposure that averages over 7 hours per customer annually. The backup power systems market size for the region benefits from tax credits on battery storage under the Inflation Reduction Act, tipping procurement toward lithium packs for peak shaving. Canada’s remote mining belts still favor diesel, but pilot hydrogen-diesel dual-fuel rigs aim to cut emissions 15%.
Europe advances steadily as renewable penetration lifts intermittency risks. Germany’s grid had 6.4 TWh of curtailed wind power in 2024, prompting factories to adopt combined heat-and-power engines that also serve as standby units. Ultra-Low-Emission Zones in London and Paris ban older diesel sets during smog alerts, catalyzing BESS retrofits. Southern Europe’s wildfire seasons are lengthening, prompting telecoms to deploy containerized solar-battery solutions that meet silent-operation bylaws.
The Middle East and Africa benefit from data localization mandates that seed new Tier III colocation sites in Riyadh, Dubai, and Nairobi. High ambient temperatures shorten battery life, so hybrid gas-plus-battery solutions are often the preferred choice in initial builds. South America’s grid investments trail demand growth, and diesel imports swell during drought-linked hydro-power deficits, keeping generator orders brisk. Together, these dynamics distribute growth widely across the backup power systems market.

Regulatory Landscape
Backup-power procurement for critical facilities is anchored by safety and performance standards that specify response time, runtime, testing, and maintenance regimes. NFPA 110 remains a core reference point for emergency and standby power systems in facilities such as hospitals and telecom sites, while NFPA 111 (2025 edition, effective May 12, 2024) updated requirements for stored electrical energy emergency and standby power systems. The updates reinforce a clearer compliance pathway for battery-based backup architectures alongside engine-based sets.
In the United States, federal agencies are also sharpening attention on resilience and testing of onsite emergency power sources. In June 2026, the U.S. Nuclear Regulatory Commission issued Draft Regulatory Guide DG-1477 for public comment on the application and testing of onsite emergency AC power sources in production and utilization facilities, which adds weight to standardized verification practices for mission-critical backup. Grid and infrastructure resilience themes also show up in reliability and policy forums, including NERC Reliability Standard PRC-029-1 becoming effective in August 2025 for inverter-based resource ride-through and an IEA high-level roundtable in September 2025 focused on extreme weather and natural hazards. These inputs influence how backup systems are specified, integrated, and validated at site level.
Competitive Landscape
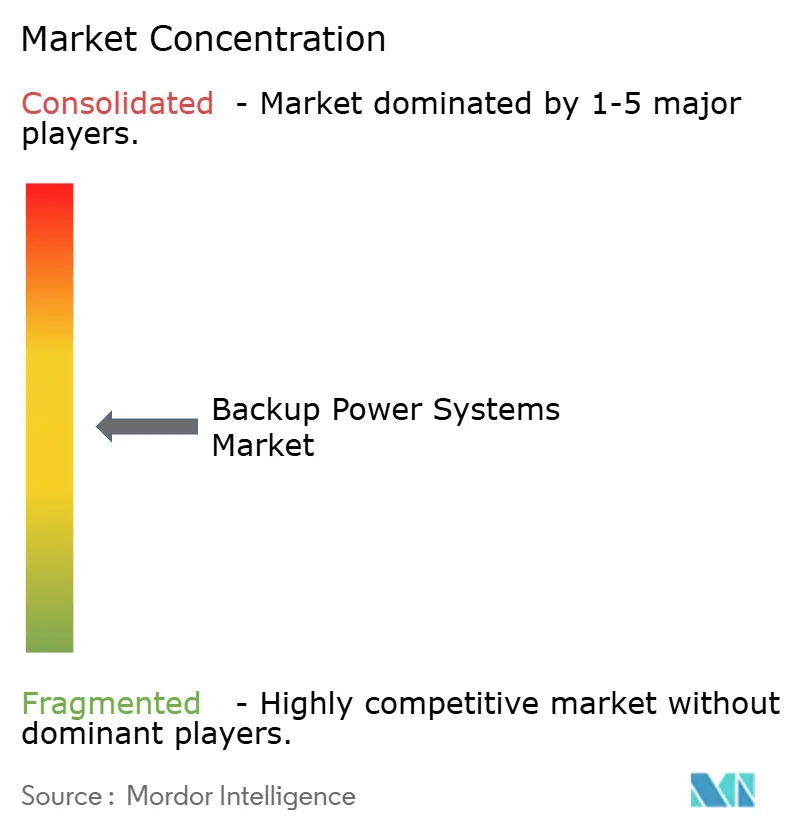
Market competition remains moderate, with the top five suppliers controlling roughly 45% of the revenue, leaving room for niche innovators. Caterpillar and Cummins rely on their global service footprints and introduce HVO-compatible engines that reduce lifecycle CO₂ emissions by 90%. Generac bought Off Grid Energy and Ageto in 2025 to fold mobile BESS and microgrid controllers into a bundled offer. Eaton entered solid-state transformer tech via Resilient Power Systems to improve DC architecture efficiency in EV hubs. Battery pure-plays such as Fluence and Tesla challenge incumbents by pairing 4-hour packs with software that monetizes utility demand-response programs.
Deal flow highlights the pivot: 227 battery-storage M&A transactions worth USD 24.1 billion were closed in 2023, representing a 180% year-over-year increase. Fuel-cell partnerships are on the rise, with Honda testing 500 kW hydrogen stacks at California data centers. Competitive differentiation is shifting from raw kVA ratings to lifecycle costs, emissions profiles, and digital service layers, reshaping how buyers evaluate offerings in the backup power systems market.
Backup Power Systems Industry Leaders
Kohler Co.
Atlas Copco AB
Generac Holdings Inc.
Caterpillar Inc.
Eaton Corporation
- *Disclaimer: Major Players sorted in no particular order

Market Opportunities and Future Outlook
White space is expanding where buyers need backup systems that also operate as grid-interactive assets, particularly in peak shaving and load management and in programs that aggregate distributed energy resources. California legislation such as SB-913, which directs the California Public Utilities Commission to develop new participation models (by June 30, 2027) for aggregated DER to qualify for resource adequacy, provides a practical entry point for vendors that can bundle UPS, BESS, generators, and controls into dispatchable site-level capacity for commercial and industrial customers.
Data center-led electrification constraints are also pushing behind-the-meter build-outs that change equipment mix and procurement pathways for backup power vendors. In March 2026, Babcock & Wilcox received notice to proceed on a large design-build agreement for natural gas-fired generation capacity intended to serve AI data centers, and in July 2026 Cypress Creek Energy broke ground on a solar-plus-storage megaprojec in Arkansas (2.5 GWdc solar paired with 2.9 GWh of battery storage). These moves highlight how large buyers are sourcing firm capacity beyond traditional utility connection. On the supply side, capacity and delivery lead times remain a differentiator for large-engine and packaged systems, illustrated by Rolls-Royce opening a USD 24 million logistics operations center in Mankato, Minnesota in July 2026 to support increased generator production for data centers, hospitals, and airports. That expansion supports faster fulfillment for mission-critical projects and strengthens vendor positioning in multi-site rollouts.
Recent Industry Developments
- June 2026: Generac acquired a facility in Belvidere, Illinois to expand packaging capacity for large-megawatt generators. The acquisition increases near-term throughput for mission-critical projects and adds manufacturing flexibility as data center and industrial buyers place larger, more time-sensitive orders.
- April 2026: Rehlko (formerly Kohler Energy) reported securing 1.7 GW of new backup power awards tied to North American hyperscale data center projects. The scale of the awards points to continued concentration of demand in multi-campus data center builds and reinforces the importance of supplier execution, service coverage, and delivery schedules for large standby fleets.
- July 2024: Rehlko introduced KD-series updates positioned around more sustainable and future-proofed engine design for the 60-600 kW class. The product refresh targets common standby applications across commercial facilities and smaller data halls, supporting buyers that need compliance-oriented upgrades without redesigning entire onsite power architectures.


Research Methodology Framework and Report Scope
Market Definition and Coverage
For this study, the backup power systems market is defined as the revenue generated from equipment and solutions that provide temporary or continuous electricity when grid power is unavailable or unstable, across residential, commercial, and industrial users.
Scope exclusions: We exclude routine building electrical work, standard utility grid investments, and fuel spend as a standalone item when it is not bundled into an equipment or service contract.
Segmentation Overview
- By Technology
- Diesel Generators
- Gas Generators
- Uninterruptible Power Supply (UPS)
- Battery Energy Storage Systems (BESS)
- Hybrid Power Solutions
- Fuel-Cell Backup Systems
- Portable Power Stations
- By Power Rating
- Up to 50 kVA
- 51 to 280 kVA
- 281 to 500 kVA
- 501 to 2,000 kVA
- Above 2,000 kVA
- By Application
- Standby/Emergency Power
- Prime/Continuous Power
- Peak Shaving and Load Management
- Off-Grid and Remote Power
- By End-User
- Residential
- Commercial (Retail, Offices, Hospitality)
- Industrial and Manufacturing
- Data Centres and IT
- Healthcare Facilities
- Telecom Towers
- Utilities and Energy
- Government and Defence
- By Geography
- North America
- United States
- Canada
- Mexico
- Europe
- Germany
- United Kingdom
- France
- Italy
- NORDIC Countries
- Russia
- Rest of Europe
- Asia-Pacific
- China
- India
- Japan
- South Korea
- ASEAN Countries
- Rest of Asia-Pacific
- South America
- Brazil
- Argentina
- Rest of South America
- Middle East and Africa
- Saudi Arabia
- United Arab Emirates
- South Africa
- Egypt
- Rest of Middle East and Africa
- North America
Data Sources, Market Sizing, and Validation
Desk Research
Desk research was used to set the fact base around electricity reliability, installed power assets, and end user demand triggers for backup power. We reviewed public sources such as the International Energy Agency (IEA) for power sector indicators, the US Energy Information Administration (EIA) for generation and fuel data, the World Bank for electrification and macro indicators, and the US Census Bureau for construction and manufacturing signals.
To cross-check how demand moves across user groups, we also referenced sources such as national grid outage reporting and energy regulator outage dashboards, customs statistics for relevant equipment trade flows, and peer reviewed energy resilience studies. Company annual reports, investor presentations, and press releases were used to validate product mix changes and regional expansion signals, while a paid subscription for company financials and a shipment-level import export database helped confirm directionality where public detail was limited. These examples are not exhaustive, and many other public and paid sources were also used for data collection, validation, and research clarification.
Primary Interviews and Surveys
Primary work was used to pressure-test the desk assumptions and translate broad power reliability signals into practical buying behavior. We spoke with a mix of equipment manufacturers, distributors and installers, engineering and facility teams, and large end users such as data centers, healthcare facilities, and process industries. Inputs were then compared across APAC, EMEA, and the Americas so regional patterns were not averaged away.
Distribution of primary research fieldwork respondents
| Company type | Respondent position | Region |
|---|---|---|
| Top tier: 28% | CXOs: 14% | APAC: 51% |
| Mid tier: 56% | Functional/Unit leaders: 42% | EMEA: 31% |
| Smaller Players: 16% | Managers: 44% | Americas: 18% |
Market-Sizing & Forecasting
Sizing starts with a top-down build that reconstructs the addressable demand pool using power reliability and electrification indicators, and then allocates spend into backup power based on adoption patterns by end user. Key inputs tracked and updated include outage frequency and duration (where available), new floor space additions and critical facility builds, data center capacity additions, industrial production trends that signal downtime sensitivity, and generator and UPS replacement cycles tied to typical service life.
Once the totals are formed, they are corroborated with selective bottom-up approximations, including sampled average selling price bands matched with observed shipment and installation activity, and channel checks that clarify how much demand is fulfilled through distributors versus direct projects. Where coverage gaps exist, for example in smaller installations or informal service networks, the model uses conservative penetration assumptions that are later adjusted after interview feedback.
Forecasting uses scenario analysis supported by a simple multivariate regression. The strongest explanatory variables are the construction pipeline for critical facilities, grid reliability signals, and macro activity indicators. Assumptions on price progression are kept explicit by linking them to component cost direction and mix shift between generators and UPS, before the final forecast is normalized into one consistent USD time series.
Data Validation & Update Cycle
Model outputs are checked against independent signals such as related equipment production and trade direction, order commentary in public filings, and changes in installed base indicators, then differences are investigated before sign-off. If a region shows a sudden swing that is not supported by outages, construction activity, or pricing logic, the assumptions are reworked and the relevant experts are re-contacted.
A multi-step review is followed so the arithmetic, scope logic, and trend story are consistent, and the full set of segment totals reconciles back to the global number. Reports are refreshed annually, and interim updates are made when material events occur, such as major grid disruptions, policy shifts on emissions for generators, or large demand shocks from infrastructure spending. Before delivery, an analyst completes a fresh verification pass so clients receive the latest updated view.
Mordor Intelligence's Backup Power Systems Market Market Estimate Compared With Other Published Estimates
Published market sizes for backup power systems often differ because the scope line is drawn differently and the same demand can be counted under separate equipment labels. The base year used, the way pricing is converted into USD, and how quickly assumptions are refreshed after major outage events also tend to move the final number.
In this market, the biggest gap drivers usually come from whether estimates fold in adjacent power quality hardware, whether they treat fuel and maintenance as part of the market by default, and whether they assume higher adoption in residential standby without validating actual installation constraints. The spread also widens when price paths are assumed from broad inflation instead of being tied to generator and UPS mix and the replacement cycle timing. For that reason, the count here stays focused on equipment and related services priced in a consistent year, which is a modeling choice applied by Mordor Intelligence.
Benchmark comparison
| Source | Market Size | Gaps in Research Methodology |
|---|---|---|
| Mordor Intelligence | USD 35.29 B (2025) | |
| Industry Publisher A | USD 41.35 B (2024) | Uses a different base year and a broader coverage set that can bundle multiple backup power categories together, which can lift totals when cross-checks are not normalized to the same USD timing. |
| Industry Publisher B | USD 33.37 B (2024) | Often emphasizes application based splits and may apply a narrower equipment boundary or more conservative adoption assumptions, especially in residential and small commercial installs where visibility is uneven. |
Overall, the table shows that base year choice and what gets counted as a backup power system explain most of the spread, followed by how pricing and adoption are projected forward. By keeping the inputs tied to observable outage, build activity, and replacement cycle signals, the estimate is easier to reconcile and repeat when new information comes in.


Key Questions Answered in the Report
What is the projected CAGR for the backup power systems market to 2031?
The market is forecast to advance at a 5.74% CAGR from 2026 to 2031.
Which technology segment is growing the fastest?
Battery energy storage systems lead with a 13.1% CAGR through 2031, narrowing the gap with diesel.
Why are 501-2,000 kVA units so popular?
They match typical load profiles for data halls, hospitals, and light-industrial plants and allow modular scalability.
How are emissions regulations influencing technology choices?
Urban noise and air-quality rules drive buyers toward batteries and fuel cells, especially in Europe and North America.
What role do data centers play in market growth?
Hyperscale data-center construction propels an 10.62% CAGR for that end-user segment because AI workloads demand 24 × 7 power.
Are battery systems replacing diesel generators entirely?
Not yet; hybrids are common. However, long-duration batteries now reach cost parity for many standby and peak-shaving duties, eroding diesel’s future share.
Page last updated on:


 Your data is secure and never sold or shared.


