
Power Plant Control System Market Size and Share
Market Overview
| Study Period | 2021 - 2031 |
|---|---|
| Market Size (2026) | USD 10.11 Billion |
| Market Size (2031) | USD 14.04 Billion |
| Growth Rate (2026 - 2031) | 6.79 % |
| Fastest Growing Market | Asia Pacific |
| Largest Market | Asia Pacific |
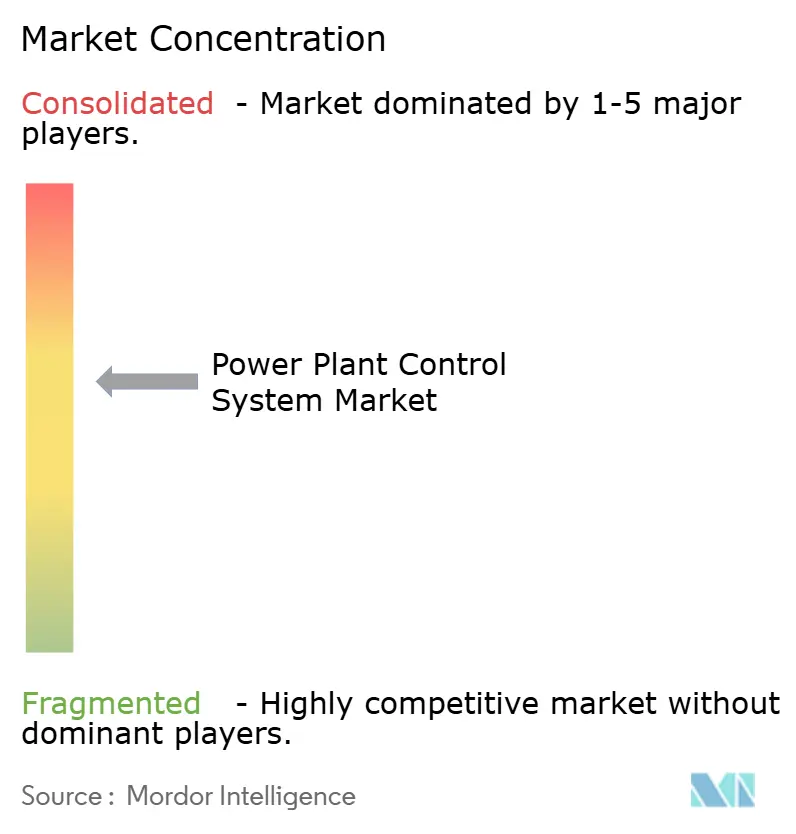
| Market Concentration | Medium |
Major Players *Disclaimer: Major Players sorted in no particular order Image © Mordor Intelligence. Reuse requires attribution under CC BY 4.0. | |
Power Plant Control System Market Analysis by Mordor Intelligence
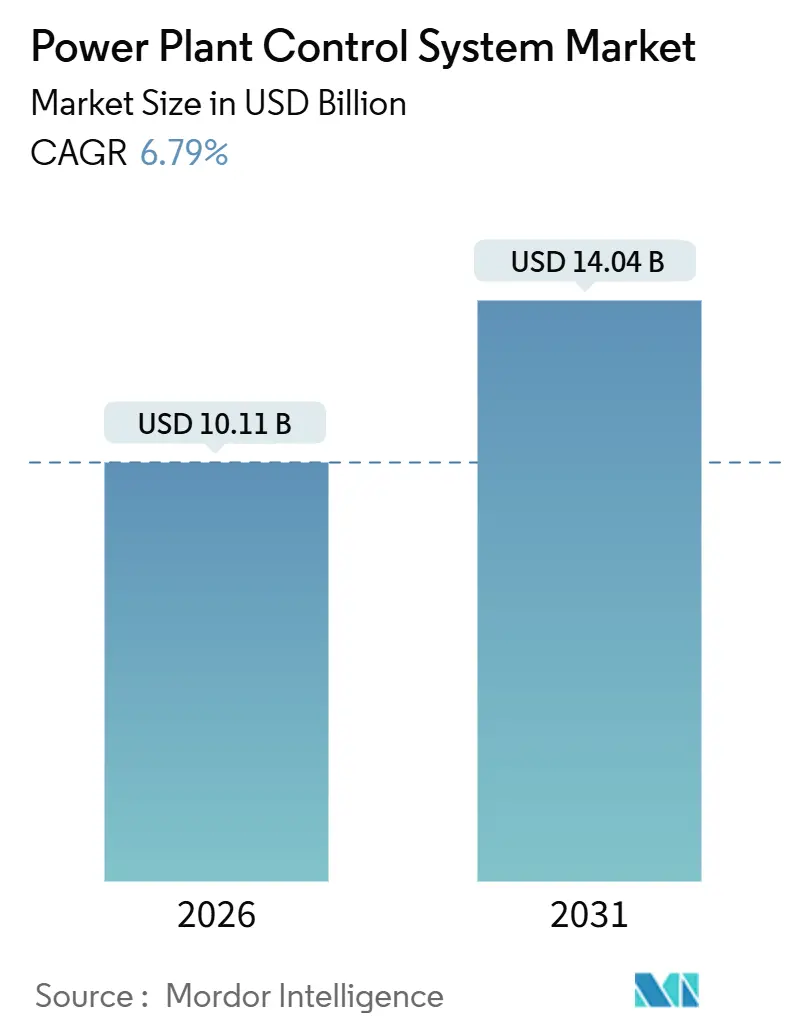
The Power Plant Control System Market size is estimated at USD 10.11 billion in 2026, and is expected to reach USD 14.04 billion by 2031, at a CAGR of 6.79% during the forecast period (2026-2031).
Growing renewable penetration, mandatory cybersecurity compliance, and the need to extend the life of aging thermal and nuclear fleets are jointly reshaping procurement priorities. Utilities are no longer purchasing incremental automation add-ons; they are replacing legacy architectures with sub-second, analytics-ready platforms that can orchestrate hybrid generation portfolios. The pivot toward wide-area supervisory control increases demand for IEC 61850-compliant Ethernet networks, cloud-native historian databases, and AI modules that predict component fatigue weeks before on-site teams could detect wear. Semiconductor shortages and a limited pool of digitally fluent operators remain short-term hurdles, yet deferred maintenance backlogs and government incentives keep modernization programs on track across all regions.
Key Report Takeaways
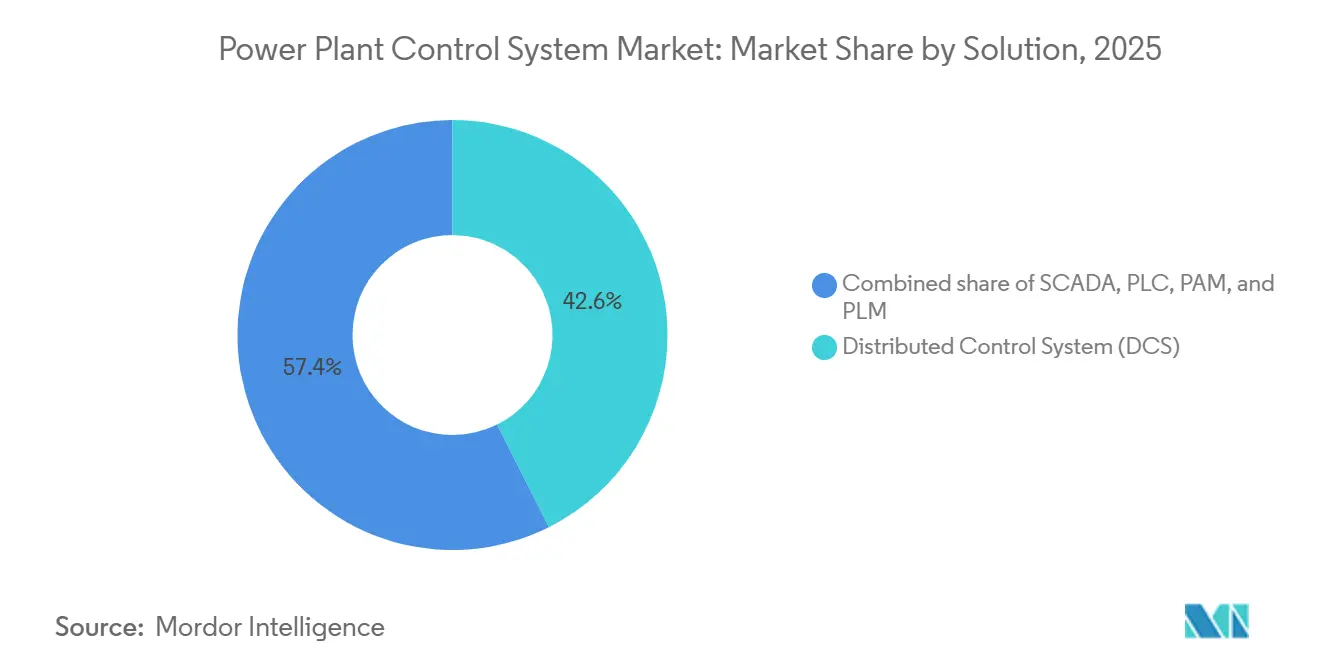
- By solution, Distributed Control Systems led with 42.6% of the Power Plant Control System market share in 2025; Supervisory Control and Data Acquisition is projected to expand at an 8.1% CAGR through 2031.
- By component, hardware contributed 66.9% of 2025 revenue, while software is forecast to record an 8.5% CAGR between 2026 and 2031.
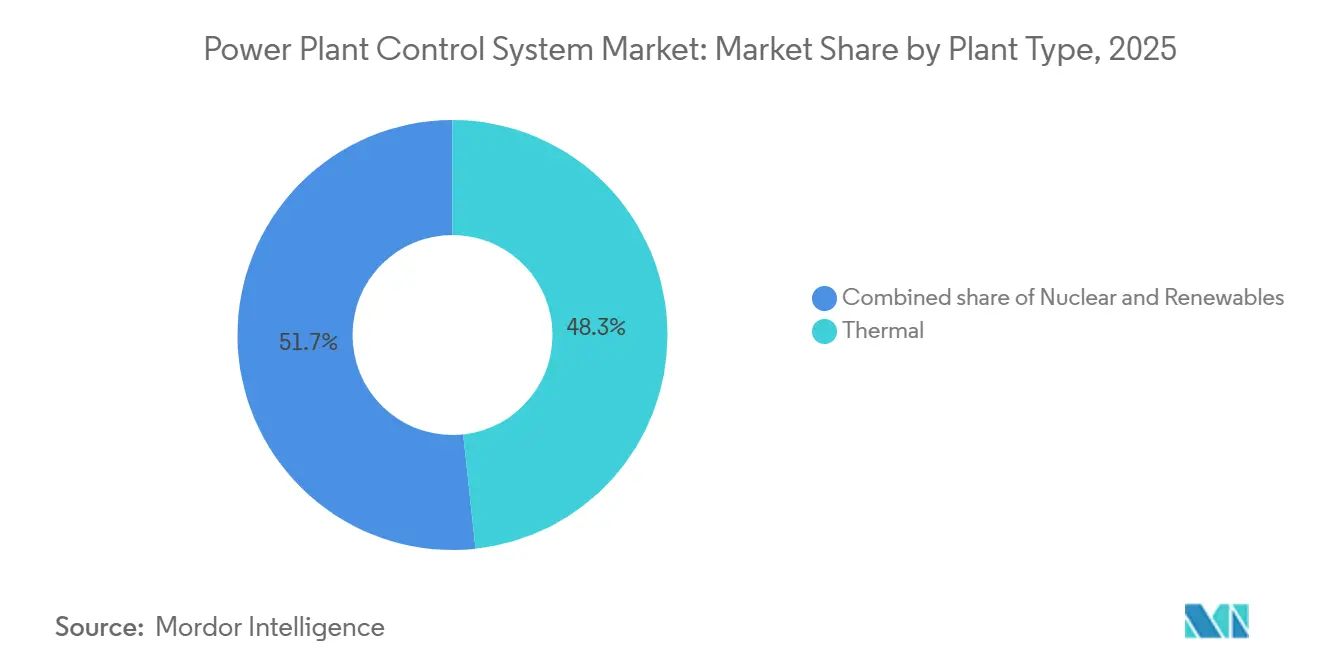
- By plant type, thermal facilities accounted for 48.3% of the 2025 value, whereas renewables represent the fastest-growing segment with a 10.3% CAGR through 2031.
- By geography, Asia-Pacific led with 37.1% in 2025; the region is set to advance at a 7.9% CAGR to 2031.
Note: Market size and forecast figures in this report are generated using Mordor Intelligence’s proprietary estimation framework, updated with the latest available data and insights as of January 2026.
Global Power Plant Control System Market Trends and Insights
Drivers Impact Analysis*
| Driver | (~) % Impact on CAGR Forecast | Geographic Relevance | Impact Timeline |
|---|---|---|---|
| Rising integration of renewables in energy-mix | 1.8% | Global, with APAC and Europe leading deployment | Medium term (2-4 years) |
| L10: Upgrade & modernization of aging power plants | 1.5% | North America & Europe core, spillover to APAC thermal fleet | Long term (≥ 4 years) |
| Digitalization & IIoT adoption across utilities | 1.3% | Global, accelerated in North America, Europe, and urban APAC hubs | Medium term (2-4 years) |
| Government incentives for grid stability & emissions cuts | 1.0% | North America (IRA), EU (Green Deal), India (PLI schemes) | Short term (≤ 2 years) |
| L13: Mandatory cybersecurity standards for critical infrastructure | 0.7% | North America (NERC CIP), Europe (NIS2 Directive), emerging in MEA | Medium term (2-4 years) |
| AI-driven predictive maintenance analytics | 0.9% | Global, early adoption in North America and Europe | Medium term (2-4 years) |
| Source: Mordor Intelligence | |||
Rising Integration of Renewables in Energy Mix
Variable renewables already provide more than 30% of installed capacity across OECD countries, exposing grid operators to 15-minute solar ramps of up to 40% that legacy governors cannot counteract.[1]Renewables 2026,” International Energy Agency, iea.org New SCADA deployments aggregate distributed solar, wind, and battery assets into dispatchable blocks, allowing control centers to issue ramp commands without on-site intervention. Utilities are migrating from serial links to IEC 61850 Ethernet backbones so that substations and generation units exchange data within sub-cycle intervals.[2]IEC 61850 Standard,” International Electrotechnical Commission, iec.ch The driver influence peaks between 2027 and 2029 as offshore wind in the North Sea and solar parks in Rajasthan adopt centralized control rooms.
Upgrade and Modernization of Aging Power Plants
Roughly 60% of coal-fired capacity in the United States and Europe exceeded 40 years in service by 2025, steering owners toward digital retrofits that extend life by up to two decades while achieving tighter emissions limits. Constellation Energy earmarked USD 167 million in January 2026 to replace analog panels with digital instrumentation at its Limerick nuclear station, enabling remote coolant monitoring and automated load following. The economic argument is compelling: retrofits that cost USD 50 million per 500 MW unit defer the USD 1 billion replacement expense.
Digitalization and IIoT Adoption Across Utilities
Terabytes of vibration, temperature, and pressure data now stream daily from turbines and boilers, yet fewer than one-fifth of utilities process these feeds at the edge. Siemens Energy’s Omnivise embeds machine-learning in DCS controllers to adjust gas-turbine combustion within milliseconds, cutting unplanned outages by 18% during pilots in Germany and Texas. ABB’s Ability Genix suite, deployed at ENGIE’s Dutch combined-cycle plant in 2025, uses digital twins to model steam-drum stress and optimize ramp rates.
AI-Driven Predictive Maintenance Analytics
Algorithms trained on historical failure modes forecast rotor-bearing degradation up to eight weeks in advance, shifting maintenance to condition-based schedules that cut forced outages by 25–30%. Siemens’ integration of Senseye analytics enabled a 2,000 MW coal fleet in Poland to save USD 4 million per year on maintenance. GE Vernova’s Asset Performance Management software improved thermal efficiency by 1.2 percentage points at Saudi plants by linking sensor data with weather forecasts.
Restraints Impact Analysis*
| Restraint | (~) % Impact on CAGR Forecast | Geographic Relevance | Impact Timeline |
|---|---|---|---|
| Growing shift toward distributed energy resources | -0.8% | Global, most pronounced in California, Germany, Australia | Medium term (2-4 years) |
| High capex & complex integration | -1.2% | Global, acute in emerging markets with limited engineering capacity | Short term (≤ 2 years) |
| Semiconductor supply-chain constraints | -0.6% | Global, with Asia-Pacific manufacturing dependencies | Short term (≤ 2 years) |
| Shortage of skilled digital-control operators | -0.5% | Global, severe in North America and Europe due to aging workforce | Long term (≥ 4 years) |
| Source: Mordor Intelligence | |||
High Capex and Complex Integration
Retrofitting a 500 MW coal unit typically costs USD 40–60 million, an outlay competing with cheaper renewable additions. Integrating new SCADA with 1990s-era PLCs requires custom middleware that adds 6–12 months to commissioning, as seen at Poland’s Belchatów power station, where phased cutovers kept half the units on analog controls through 2025.
Semiconductor Supply-Chain Constraints
Lead times for industrial microcontrollers exceeded 52 weeks in 2026 after automotive and consumer electronics swallowed foundry capacity at TSMC and Samsung. Rockwell Automation reported nine-month shipment delays for ControlLogix PLCs in 2025, pushing utilities to postpone renewable integrations. Schneider Electric rewrote its EcoStruxure platform around automotive-grade chips from NXP, achieving IEC 61508 approval after 18 months of testing.
*Our forecasts treat driver/restraint impacts as directional, not additive. The impact forecasts reflect baseline growth, mix effects, and variable interactions.
Segment Analysis
By Solution: SCADA Outpaces Legacy DCS
SCADA captured only 27.5% in 2025 but is forecast to grow at an 8.1% CAGR, the fastest among solutions, as utilities pursue wide-area visibility that balances renewables across portfolios. Distributed Control Systems retained 42.6% and remain indispensable for sub-second loop control in thermal and nuclear units. The Power Plant Control System market size for SCADA solutions is projected to reach USD 5.1 billion by 2031, reflecting the escalating need for virtual power plant coordination. Vendors such as GE Vernova now embed mixed-integer optimization in dispatch centers, enabling operators to adjust setpoints every five minutes. SCADA growth illustrates the market’s shift from plant-centric automation to fleet-level orchestration.
The acceleration has strategic consequences. Utilities once focused on boiler or turbine efficiency; now they assemble 50–100 assets into a single dispatchable block. GE Vernova’s 2025 installation in Saudi Arabia aggregated 12 GW of capacity, slashing peak-period fuel consumption by 7%. Such use cases were out of reach for traditional DCS that lacked the networking and compute muscle required for geographically dispersed assets. Consequently, SCADA is set to narrow the gap with DCS in the Power Plant Control System market through 2031.



By Component: Software Gains on Hardware Incumbency
Hardware provided 66.9% of 2025 revenue, yet software is advancing at an 8.5% CAGR. The Power Plant Control System market size for software is expected to climb from USD 3.35 billion in 2026 to USD 5.46 billion by 2031. Subscription-based historian databases and edge-computing suites now deliver fast returns without rip-and-replace capital. Siemens Energy’s SaaS upgrade to Omnivise lets mid-tier plant owners license advanced combustion algorithms without buying new controllers. ABB’s Edgenius shifts analytics to industrial PCs, breaking hardware lock-in and aligning with procurement policies that favor open standards.
Hardware remains critical, but commoditization looms. Honeywell’s Forge Energy Optimization operates atop any OPC UA-compliant infrastructure, allowing utilities to overlay reinforcement learning on existing assets. Cybersecurity compliance further tilts spending toward software, as monthly patch cycles are easier to deliver via cloud subscriptions than through firmware flashes tied to multi-year hardware refreshes.
By Plant Type: Renewables Surge Past Thermal Baseline
Thermal units commanded 48.3% in 2025, but renewables will expand at a 10.3% CAGR. The Power Plant Control System market share for thermal facilities is expected to dip below 40% by 2031 as wind and solar farms adopt centralized SCADA to manage thousands of inverters across large footprints. Nuclear remains niche yet stable, with upgrades driven by license extension rules demanding digital instrumentation.
Renewable integration brings new complexity. ACWA Power’s Sudair solar park runs a three-tier SCADA hierarchy, executing curtailment within two seconds of frequency deviations. Thermal assets, once base-load staples, now cycle daily to offset solar variability, accelerating stress on boiler tubes and elevating demand for predictive-maintenance software. Utilities are adopting wide-area coordination for thermal fleets, mirroring renewable control philosophies, thereby keeping thermal investment alive despite decarbonization goals.
Geography Analysis
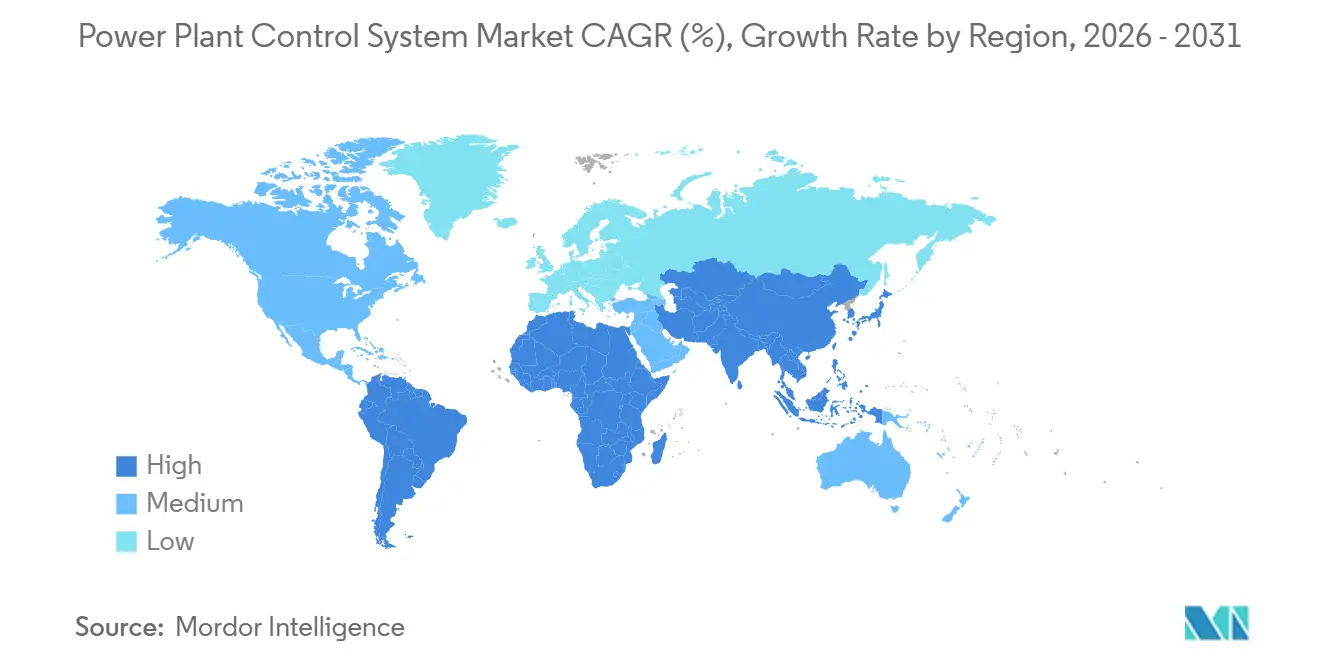
Asia-Pacific led with a 37.1% share in 2025 and is projected to grow at a 7.9% CAGR. India’s 500 GW renewable target and China’s ultra-high-voltage backbone require millisecond coordination between provincial dispatch centers and plant-level controllers.[3]500 GW Mission,” Ministry of Power, India, powermin.gov.in NTPC’s USD 180 million order for Bharat Heavy Electricals in 2025 retrofits six coal units with digital emissions monitors, showing that thermal modernization accompanies renewable additions.[4]BHEL-NTPC Contract Release,” Bharat Heavy Electricals Limited, bhel.com China’s State Grid invested USD 4.5 billion to network 120 GW of distributed solar via Huawei’s FusionSolar, enabling centralized curtailment during congestion.
North America leverages Infrastructure Investment and Jobs Act funds and DOE Grid Resilience grants to harden control layers against cyber threats under NERC CIP-013. Tennessee Valley Authority’s 2025 Emerson deal integrates IEC 62443 segmentation and real-time intrusion detection. Europe mandates similar rigor; Germany requires digital automation for all >100 MW plants by 2027, and Siemens Energy secured EUR 1.5 billion in Middle East contracts by exporting European best practices. The emphasis across both regions is on lifecycle-management software and continuous patching.
The Middle East and Africa register high-single-digit growth as Saudi Arabia and the UAE diversify energy portfolios. South America trails due to policy volatility, yet Brazil’s Eletrobras privatization unlocks capital for hydro-control upgrades. Mature economies prioritize cybersecurity and analytics, while emerging markets focus on hardware reliability paired with vendor financing, illustrating divergent regional procurement paths within the Power Plant Control System market.

Regulatory Landscape
Cybersecurity and critical-infrastructure rules are tightening around generation and control-room communications, shaping specifications for SCADA, DCS, PLC, and associated software. In the United States, the Federal Energy Regulatory Commission (FERC) approved updates to NERC Critical Infrastructure Protection (CIP) Reliability Standards in March 2026, including CIP-003-11 to extend security management controls to low-impact BES Cyber Systems, raising requirements for measures such as authenticated remote access and monitoring for malicious communications. NERC also flagged CIP-012-2 (communications between control centers) for enforcement effectiveness from July 1, 2026, reinforcing segmentation, secure communications, and governance for control-center-to-control-center data flows.
In Europe, cybersecurity governance is being formalized for cross-border electricity system coordination. The EU Delegated Regulation (EU) 2024/1366 required transmission system operators, supported by ENTSO for Electricity, to submit proposals for cybersecurity risk assessment methodologies by March 13, 2025, increasing alignment pressure across operational technology environments and supplier documentation. Alongside this, public-sector guidance such as the US Department of Energy Energy Modernization Cybersecurity Implementation Plan (December 2024) reinforces secure-by-design approaches and supply-chain risk management expectations, which are increasingly reflected as audit artifacts in utility tenders.
Competitive Landscape
ABB, Siemens Energy, Emerson, Schneider Electric, and GE Vernova jointly control about 58% of global revenue, indicating moderate concentration. Local champions such as Bharat Heavy Electricals and Doosan Enerbility win contracts under domestic content mandates. Siemens Energy’s 2024 purchase of Pixii adds microgrid orchestration, signaling a pivot toward distributed resource control. Competitors respond by wrapping lifecycle services around hardware to defend margins. Software-centric entrants, including C3.ai and WAGO, undercut incumbents by offering analytics that ride on open-standard protocols and commodity edge hardware.
Patent activity in IEC 62443 security has grown 40% since 2023, with Honeywell and Rockwell Automation leading in anomaly-detection algorithms that monitor command streams for malicious payloads. Utilities now stipulate continuous vulnerability patching in tenders, favoring vendors with DevOps-style release cycles. The competitive axis is shifting from proprietary controllers to software ecosystems with open APIs, subscription pricing, and agile security updates, fundamentally redefining vendor differentiation in the Power Plant Control System market.
Power Plant Control System Industry Leaders
ABB Ltd
General Electric Company
Emerson Electric Co.
Siemens AG
Schneider Electric SE
- *Disclaimer: Major Players sorted in no particular order

Market Opportunities and Future Outlook
Modernization programs that pair cybersecurity-driven controller refreshes with fleet-level visibility and orchestration are starting to stand out, especially for owners seeking to operate thermal assets more flexibly alongside renewables. Active spending provides a concrete signal, with ABB's July 2026 contract to modernize the distributed control system at ENGIE Australias Pelican Point Power Station, replacing legacy Advant controllers with AC 800M and tying lifecycle modernization to cybersecurity and real-time monitoring requirements. Similar modernization work is moving beyond large utilities to municipal and district-energy operators, as Valmet delivered Valmet DNAe DCS for a Finnish district heating plant in June 2026, followed by phased commissioning at a Finnish CHP plant. This broadens the base for DCS upgrades and lifecycle services.
Another demand pocket is emerging for control architectures built for cloud-enabled operations, virtualization readiness, and integrated monitoring across multi-site renewable portfolios, where secure wide-area control and standardized data handling become procurement differentiators. Siemens began deploying cloud-based SCADA to manage 1 GW of renewables across eight sites in Australia (February 2026), showing pull for centralized control-room capabilities using modern SCADA platforms. On the compliance side, FERC's March 2026 approvals of modified CIP standards, including CIP-003-11 and related updates supporting secure use of shared cyber infrastructure, are pushing utilities to treat software-centric capabilities like identity, logging, patching, and secure remote operations as part of the control-system scope rather than standalone IT add-ons.
Recent Industry Developments
- July 2026: ABB won a contract from ENGIE Australia to modernize the distributed control system at the Pelican Point Power Station, upgrading legacy Advant controllers to AC 800M for the gas and steam turbines. The project emphasizes cybersecurity and enhanced real-time monitoring, accelerating replacement cycles for older installed bases and increasing demand for migration engineering and lifecycle services.
- October 2025: Toshiba Energy Systems and Solutions, via its Indian subsidiary Toshiba JSW, announced an AI-driven centralized monitoring system covering 165 thermal and renewable plants owned or operated by NTPC and its joint ventures. The rollout reflects a shift toward fleet-level operations, where multi-plant monitoring platforms expand the control-system scope beyond single-site DCS into centralized analytics and supervisory layers.
- April 2024: China National Nuclear Corporation announced the start of digital control system installation for the ACP100 small modular reactor demonstration project at the Changjiang site in Hainan. The milestone highlights continued conversion from analog to digital instrumentation and control in nuclear projects, supporting demand for high-integrity control platforms and specialized integration services.


Research Methodology Framework and Report Scope
Market Definition and Coverage
For this study, the market covers power plant control and automation systems used to monitor, regulate, and optimize power plant operations, including core hardware, software, and related system-level integration value.
Scope exclusions: We exclude grid-level transmission and distribution control rooms, standalone building automation, and generic IT tools that are not designed for power generation control.
Segmentation Overview
- By Solution
- Supervisory Control and Data Acquisition (SCADA)
- Programmable Logic Controller (PLC)
- Distributed Control System (DCS)
- Plant Asset Management (PAM)
- Plant Lifecycle Management (PLM)
- By Component
- Hardware
- Software
- By Plant Type
- Thermal
- Nuclear
- Renewables
- By Geography
- North America
- United States
- Canada
- Mexico
- Europe
- Germany
- United Kingdom
- France
- Italy
- Spain
- NORDIC Countries
- Russia
- Rest of Europe
- Asia-Pacific
- China
- India
- Japan
- South Korea
- ASEAN Countries
- Australia and New Zealand
- Rest of Asia-Pacific
- South America
- Brazil
- Argentina
- Colombia
- Rest of South America
- Middle East and Africa
- Saudi Arabia
- United Arab Emirates
- South Africa
- Egypt
- Rest of Middle East and Africa
- North America
Data Sources, Market Sizing, and Validation
Desk Research
To build a clean starting point, we first mapped the demand side through public energy and industrial statistics, and then aligned it with how control systems are typically specified in power projects. Sources we used include non-paywalled references such as the International Energy Agency (IEA), U.S. Energy Information Administration (EIA), Eurostat, the International Renewable Energy Agency (IRENA), and the World Bank. These references help anchor generation capacity additions, fuel mix shifts, and commissioning trends.
We also reviewed supporting materials such as company annual reports, investor presentations, technical papers in relevant engineering journals, and updates shared by utilities and plant operators. Where needed, paid subscriptions for company financial intelligence, news and financials, and patent databases were used to cross-check product positioning and investment signals. The desk sources listed here are illustrative, and many other public references were also used for collection, clarification, and validation.
Primary Interviews and Surveys
Primary work was used to validate what gets purchased in real projects, how pricing moves across upgrades versus greenfield builds, and how modernization cycles differ by plant type. We spoke with a mix of equipment suppliers, EPC-facing engineers, plant operators, and independent domain experts across major power generation regions to pressure-test assumptions and close data gaps.
Distribution of primary research fieldwork respondents
| Company type | Respondent position | Region |
|---|---|---|
| Top tier: 29% | CXOs: 20% | APAC: 46% |
| Mid tier: 49% | Functional/Unit leaders: 33% | EMEA: 33% |
| Smaller Players: 22% | Managers: 47% | Americas: 21% |
Market-Sizing & Forecasting
Sizing starts from a top-down build that reconstructs demand from power generation additions and retrofit activity, and then ties that demand pool to typical control system spend per plant and per upgrade cycle. Results are subsequently cross-checked using selective bottom-up approximations, such as sampled project awards, supplier revenue exposure to power control systems, and reasonableness checks on average selling prices times expected unit volumes.
Inputs used in the model include annual generation capacity additions by plant type, the share of brownfield modernization versus new builds, typical control system content by solution type, hardware versus software mix, and timing of commissioning and outages that influence purchase cycles. Because pricing in this space can shift with cybersecurity requirements and digital upgrade bundles, we also track average selling price movement signals and adoption of integrated plant management tools as an adjustment layer. For forecasting, we rely mainly on scenario analysis, where base, conservative, and accelerated modernization pathways are built and then aligned to expert expectations shared during interviews.
Data Validation & Update Cycle
Outputs are checked against independent signals like regional power capex trends, tender activity direction, and the implied control spend per MW, which helps highlight values that look too high or too low. When variances appear, assumptions are re-checked, and follow-up conversations are triggered with relevant respondents to confirm whether the shift is real or a modeling artifact.
Before publication, the work goes through a multi-step analyst review where key inputs, currency handling, and growth drivers are re-tested for internal consistency. Reports are refreshed annually, and interim updates are made when material events occur, such as sharp changes in fuel mix policy, major plant retirement waves, or large project pipeline revisions. Right before delivery, a final pass is completed so clients receive the latest updated view.
Mordor Intelligence's Power Plant Control System Market Size Measured Against Other Published Estimates
Published market values for power plant control systems can vary because the boundaries are set differently, and because some estimates lean more on supplier commentary while others lean more on project pipelines. Differences also show up when upgrades are counted differently than new-build installs, and when software and services are treated as a separate market versus included in the same total.
By tracking commissioning schedules, retrofit intensity, and solution-level spend, Mordor Intelligence places upgrades and greenfield projects into one consistent value model, which reduces double counting between plant automation layers and adjacent grid controls.
Benchmark comparison
| Source | Market Size | Gaps in Research Methodology |
|---|---|---|
| Mordor Intelligence | USD 10.11 B (2026) | |
| Trade Journal A | USD 7.82 B (2024) | Uses an earlier base year and appears to blend a broader automation narrative with limited clarity on how much plant-only control scope is included, which can compress the 2026 comparable value. |
| Regional Consultancy B | USD 8.70 B (2025) | Lower total is consistent with a narrower inclusion of software and upgrade-related services, and a more conservative treatment of modernization cycles across mature thermal fleets. |
The spread in the table mainly comes from year alignment and what gets counted inside plant boundaries, especially for upgrade programs and software-heavy bundles. Once scope is normalized to plant control solutions and the same timing is applied, the range tightens and the remaining gap typically reflects different upgrade-rate and pricing assumptions.


Key Questions Answered in the Report
How large is the Power Plant Control System market in 2026?
The market is valued at USD 10.11 billion in 2026 and is projected to reach USD 14.04 billion by 2031.
What is the expected CAGR for Power Plant Control System solutions through 2031?
The overall CAGR is forecast at 6.79% from 2026 to 2031.
Which solution segment is growing the fastest?
SCADA solutions are expanding at an 8.1% CAGR as utilities seek wide-area visibility for renewable integration.
Which region leads the market today?
Asia-Pacific holds 37.1% of 2025 revenue and is poised to grow at a 7.9% CAGR through 2031.
What impact do semiconductor shortages have on deployment?
Component lead times exceeding 52 weeks have delayed new installs and shaved 0.6 percentage points from forecast CAGR.
Page last updated on:


 Your data is secure and never sold or shared.


