Market Overview
| Study Period | 2020 - 2030 |
|---|---|
| Forecast Data Period | 2025 - 2030 |
| Historical Data Period | 2020 - 2023 |
| Market Volume (2025) | 111.48 gigawatt |
| Market Volume (2030) | 150.25 gigawatt |
| Growth Rate (2025 - 2030) | 6.15% CAGR |
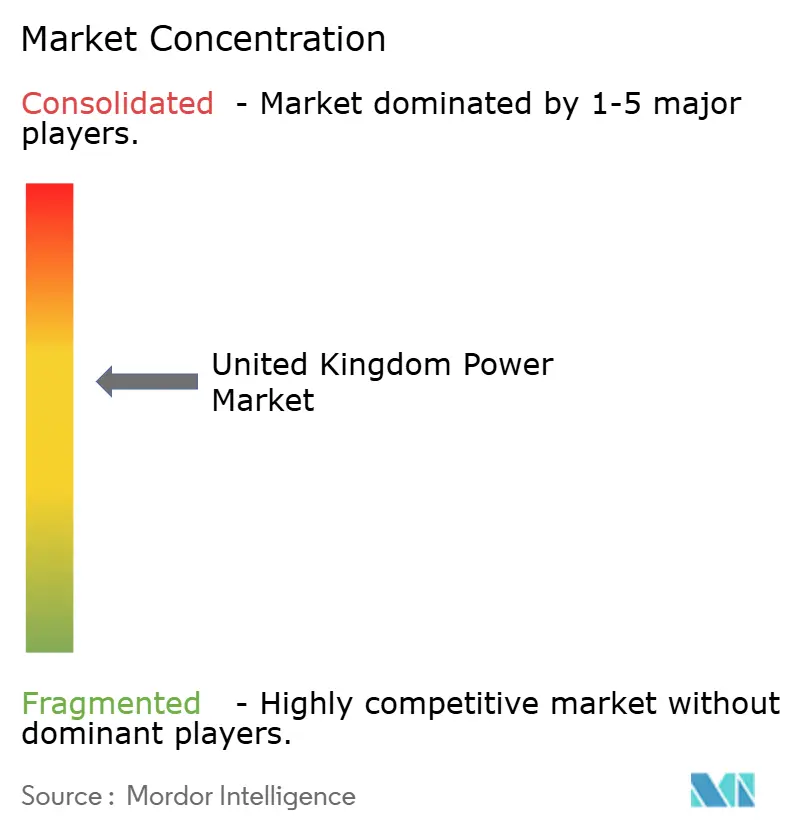
| Market Concentration | Medium |
Major Players
*Disclaimer: Major Players sorted in no particular order Image © Mordor Intelligence. Reuse requires attribution under CC BY 4.0. |
|

United Kingdom Power Market Analysis by Mordor Intelligence
The United Kingdom Power Market size in terms of installed base is expected to grow from 111.48 gigawatt in 2025 to 150.25 gigawatt by 2030, at a CAGR of 6.15% during the forecast period (2025-2030).
Accelerated coal retirement, mandatory rooftop solar for new homes, and zero-emission-vehicle targets combine to deepen electrification across end users, while cost declines in wind and solar mean new renewables beat incumbent gas on levelized cost. Policy clarity, anchored in the net-zero 2050 pledge, secures long-horizon financing even as price-cap volatility challenges retail margins, and robust private capital inflows demonstrate investor confidence in the UK power market, despite short-term grid bottlenecks. Nuclear retirements tighten reserve margins, yet hydrogen-ready turbines, utility-scale batteries, and interconnectors converge to preserve reliability. Across the board, the UK power market continues to rank among Europe’s fastest-growing electricity systems, driven by technology leadership in offshore wind and a regulatory framework that encourages low-carbon development.
Key Report Takeaways
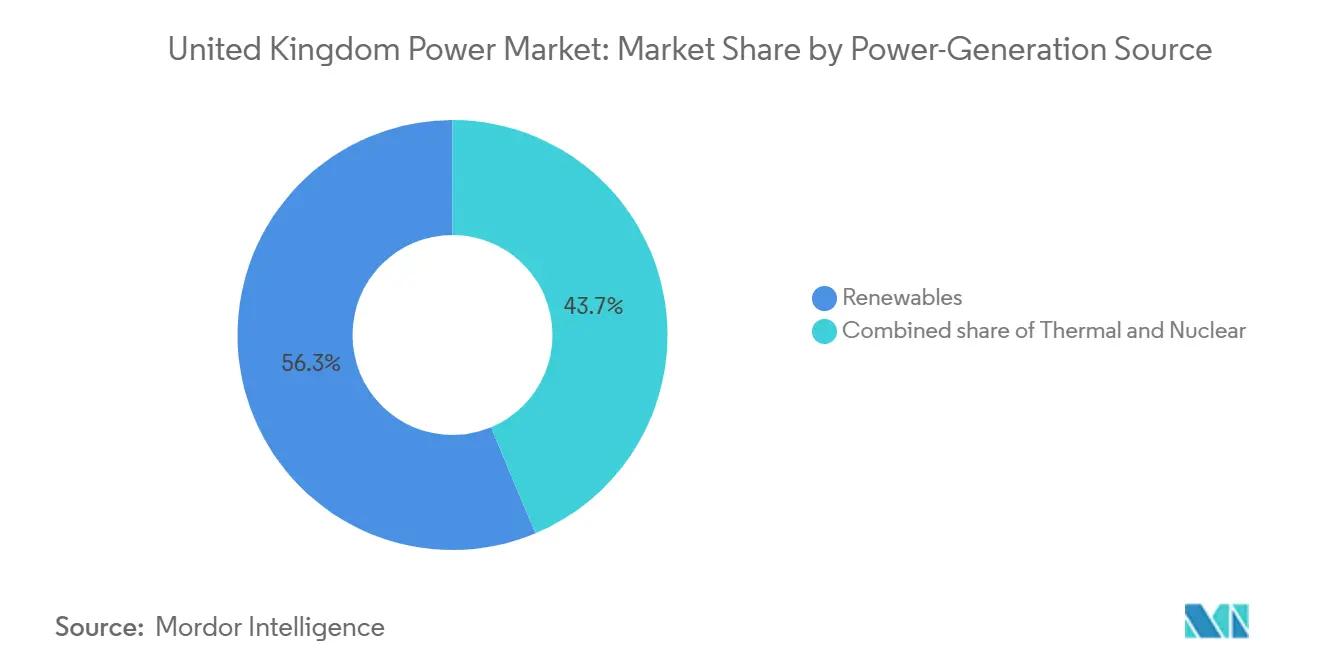
- By generation source, renewables held a 56.3% share of the UK power market in 2024 and are projected to grow at a 12.5% CAGR through 2030.
- By end user, utilities accounted for 72.6% of consumption in 2024, while residential demand is projected to rise at a 16.8% CAGR through 2030.
- By company positioning, EDF Energy, SSE, and National Grid together managed the bulk of large-asset development pipelines in 2024 and are extending scale advantages through vertical integration strategies.
United Kingdom Power Market Trends and Insights
Drivers Impact Analysis*
| Driver | (~) % Impact on CAGR Forecast | Geographic Relevance | Impact Timeline |
|---|---|---|---|
| Offshore wind CfD expansion | +1.5% | Scotland and North-Sea coast | Medium term (2–4 years) |
| Coal phase-out and gas-to-renewable shift | +1.0% | England and Wales | Short term (≤ 2 years) |
| Net-zero 2050 legal mandate | +0.8% | National | Long term (≥ 4 years) |
| Rapid wind and solar cost decline | +0.6% | Coastal and rural zones | Medium term (2–4 years) |
| Hydrogen-ready CCGT retrofits | +0.4% | Industrial clusters | Long term (≥ 4 years) |
| Surge in corporate PPAs by data centers | +0.5% | Data-center hubs | Short term (≤ 2 years) |
| Source: Mordor Intelligence | |||
Offshore Wind CfD Expansion Drives Capacity Acceleration
Allocation Round 6 awarded 5.3 GW of offshore projects at roughly £50/MWh, restoring confidence after the prior auction lapse and signaling supply-chain stabilization that keeps new assets competitive with wholesale prices.[1]UK Government, “Contracts for Difference Round 6 Results,” gov.uk The 15-year revenue certainty underpins private investment, producing a pipeline effect that is expected to add 15 GW of cumulative offshore wind by 2030. Scotland’s shallow-water geography and established fabrication yards speed installation, while the 5 GW floating-wind target unlocks deeper resources and widens the UK power market for future growth.
Coal Phase-Out Creates Immediate Baseload Replacement Demand
Coal’s final 2 GW closed in October 2024, eliminating a fast-responding fossil source and forcing system operators to lean on gas turbines and batteries during wind lulls. Although gas usage is expected to rise in the near term, over 17 GWh of new battery capacity slated for 2025 will step in for frequency response, reducing reliance on imported LNG and aligning with the UK power market’s decarbonization trajectory.
Net-Zero 2050 Legal Mandate Reshapes Investment Priorities
The Climate Change Act provides long-term certainty, prompting utilities to integrate decarbonization into capital expenditure decisions to secure low-cost financing.[2]National Grid Group, “Grid for Growth,” nationalgrid.com Interim milestones, such as a clean grid by 2030, tip funding toward ready-to-scale options, including offshore wind, batteries, and grid reinforcement, while experimental tidal trials remain niche.
Rapid Renewable Cost Decline Accelerates Grid Parity Achievement
Offshore wind costs have fallen 70% since 2010, now tracking £50/MWh, with solar similarly dropping below £40/MWh for utility arrays. Absent fuel-price risk, these assets lock in stable long-term costs, winning favor from corporate offtakers that expand demand beyond public auctions.
Restraints Impact Analysis*
| Restraint | (~) % Impact on CAGR Forecast | Geographic Relevance | Impact Timeline |
|---|---|---|---|
| Ageing nuclear fleet retirement wave | -1.2% | Scotland and England reactor sites | Short term (≤ 2 years) |
| Grid congestion and renewable curtailment costs | -0.8% | Scotland–England corridor | Medium term (2–4 years) |
| Slow planning consent for on-shore grid upgrades | -0.6% | England and Wales routes | Long term (≥ 4 years) |
| Volatile price-cap regime undermining revenue certainty | -0.5% | Great Britain retail markets | Short term (≤ 2 years) |
| Source: Mordor Intelligence | |||
Ageing Nuclear Fleet Retirement Wave Threatens Baseload Capacity
Hunterston B wrapped up its defueling in April 2025, marking the first of multiple retirements that will remove roughly 8 GW of consistent, low-carbon output.[3]Energy Global, "Clearstone Energy secures consent for UK battery storage projects," energyglobal.com Winter peaks rise as heat pumps and EV charging expand, so batteries, demand response, and hydrogen-ready peakers become critical stopgaps until Sizewell C’s 3.2 GW addition arrives in the early 2030s.
Grid Congestion Creates £1 Billion Annual Renewable Waste
Transfer limits between Scottish wind hubs and English load centers resulted in £1 billion of curtailment payments in 2024, undermining project returns and increasing consumer costs. The £58 billion “Beyond 2030” upgrade tackles the bottleneck, yet local opposition prolongs construction lead times.
*Our forecasts treat driver/restraint impacts as directional, not additive. The impact forecasts reflect baseline growth, mix effects, and variable interactions.
Segment Analysis
By Power Generation Source: Renewables Lead New Capacity
Renewables captured 56.3% capacity share in 2024 and are advancing at a 12.5% CAGR, underpinned by 882 MW Moray West and 9.6 GW of new CfD awards. Offshore wind drives bulk additions, but mandated rooftop solar and behind-the-meter batteries anchor distributed growth. Thermal assets decline as coal exits and gas shifts to peaking roles; hydrogen-ready turbines bridge the gap, while nuclear capacity contracts until Sizewell C. Collectively, renewables are poised to top 60% of the UK power market size by decade-end.
Operational data confirm that battery storage is on the rise, with more than 17 GWh scheduled for grid connection in 2025 to enhance frequency response and arbitrage intraday spreads. As newer 15-MW wind turbines increase capacity factors, curtailment risks also rise, underscoring the need for flexible assets and inter-regional trade.


By End User: Utilities Dominate Volume, Residential Demand Surges
Utilities are expected to command 72.6% of delivered power through 2024, given their role in bulk procurement, balancing, and distribution infrastructure. However, residential consumption is rising at a 16.8% CAGR as heat pumps, EVs, and rooftop solar feed the prosumer trend. The Zero Emission Vehicle mandate, targeting 80% of new sales by 2030, makes evening charging the new load hot spot, prompting time-of-use tariffs and vehicle-to-grid pilots led by agile retailers.
Commercial and industrial customers hedge volatility through corporate PPAs and on-site generation, chipping away at standard retail volumes. Data-center clusters around London and the M4 corridor request dedicated 400-kV feeds, accelerating substation upgrades under National Grid’s £60 billion network program. Integrated utilities respond by bundling green tariffs with flexibility services, balancing revenue against volatile wholesale spreads.

Geography Analysis
Scotland generated 61.8% of its electricity from clean sources in 2024 and exported 37% to the south, making the region the renewable backbone of the UK power market.[4]Office for National Statistics, “Regional Generation 2024,” ons.gov.uk Private capital aligns: Zenobē’s £750 million storage portfolio scales local batteries to harvest discounted wind and cut curtailment. Yet bottlenecks in the Scotland–England spine delay full monetization until the Great Grid Upgrade delivers new 400-kV paths.
England remains the demand center, hosting most gas and nuclear assets to supply inertia and backup during periods of low wind. London’s expanding data-center belt raises concentrated megawatt needs that pressure distribution circuits, triggering smart-grid pilots and demand-response aggregation. Northern counties are repurposing legacy industrial sites for hydrogen production and carbon capture hubs, leveraging existing pipelines and deep-water ports.
Wales and Northern Ireland hold smaller loads but significant strategic assets, including Celtic Sea wind farms, Snowdonia pumped-hydro proposals, and the all-island market interconnector, which offers bidirectional trade flexibility. RWE’s 350 MW Welsh battery project under community review signals sustained interest in grid services, while Northern Ireland targets higher onshore wind penetration facilitated by cross-border balancing.
Competitive Landscape
The UK power market exhibits moderate concentration; small supplier attrition transfers market share to integrated incumbents that own generation, networks, and retail businesses. EDF Energy, SSE, and National Grid channel scale economies into offshore wind equity stakes, battery partnerships, and digital customer platforms, while challenger brands pivot toward app-based switching and green tariffs. National Grid’s £60 billion capital expenditure (capex) envelope underscores its system operator dominance but also invites regulatory scrutiny over allowed returns.[5]National Grid Group, “Full-Year Results 2025,” nationalgrid.com
Oil majors such as TotalEnergies and Ørsted leverage balance-sheet strength to acquire pipelines, integrating wind and storage to secure fixed-price PPAs with hyperscalers. Retail competition is shifting toward service layering, home energy management, EV charging bundles, and heat pump leasing, where data analytics outweigh commodity supply. Market-design debates over zonal pricing and capacity-market reform keep strategy fluid, but scale, digital reach, and renewable portfolios remain the comparative advantages shaping future share.
United Kingdom Power Industry Leaders
-
Electricite de France SA
-
Vestas Wind Systems A/S
-
Siemens Gamesa Renewable Energy, S.A.
-
Ecotricity Group Ltd.
-
Engie SA
- *Disclaimer: Major Players sorted in no particular order

Recent Industry Developments
- June 2025: The UK government has approved the construction of the Sizewell C nuclear power plant, marking the first majority British-owned reactor in three decades. This new plant will add 3.2 GW of baseload capacity, sufficient to power 6 million homes and contribute to the UK's energy security and net-zero goals.
- June 2025: TotalEnergies has acquired a portfolio of UK solar and battery projects with a combined capacity of 435 MW from Low Carbon. This acquisition includes 350 MW of solar and 85 MW of battery storage projects.
- April 2025: EDF Renewables has energized its first operational UK solar farm, the Sutton Bridge site, marking a significant step in its expansion beyond nuclear power. The 49.9 MW solar farm, located near Spalding in Lincolnshire, is capable of powering over 9,000 households annually and reducing carbon dioxide emissions by approximately 21,000 tonnes per year.
- March 2025: Ørsted has broken ground on a grid-scale battery energy storage system (BESS) in the UK, specifically alongside its Hornsea 3 offshore wind farm. This project, named Iceni, will be one of the largest battery storage systems in Europe, with a capacity of 600 MWh and a power rating of 300 MW.


United Kingdom Power Market Report Scope
The UK power market report includes:
By Power Generation Source
| Thermal |
| Nuclear |
| Renewables |
By End-User
| Utilities |
| Commercial and Industrial |
| Residential |
| By Power Generation Source | Thermal |
| Nuclear | |
| Renewables | |
| By End-User | Utilities |
| Commercial and Industrial | |
| Residential |


Key Questions Answered in the Report
What is the projected capacity of the UK power system in 2030?
Forecasts place capacity at 150.25 GW by 2030, up from 111.48 GW in 2025, reflecting a 6.15% CAGR.
Which technology adds the most new capacity?
Offshore wind leads additions, helped by 5.3 GW of CfD awards in Allocation Round 6 and favorable shallow-water sites.
How fast is residential demand growing?
Residential electricity usage is advancing at a 16.8% CAGR through 2030, driven by heat pumps, EV charging, and rooftop solar.
What challenges hinder renewable growth?
Grid congestion between Scotland and England, slow planning approvals for new lines, and nuclear retirements weigh on near-term growth.
Who are the dominant market players?
EDF Energy, SSE, and National Grid hold leading positions, strengthened by vertical integration across generation, networks, and retail.
How much renewable energy does Scotland export?
Scotland exported 37% of its 2024 generation to England, underscoring its role as the UK’s primary clean-power supplier.
Page last updated on:


