
Market Overview
| Study Period | 2021 - 2031 |
|---|---|
| Forecast Data Period | 2026 - 2031 |
| Base Year Market Size (2025) | 9.18 gigawatt |
| Market Volume (2026) | 9.51 gigawatt |
| Market Volume (2031) | 11.34 gigawatt |
| Growth Rate (2026 - 2031) | 3.62 % |
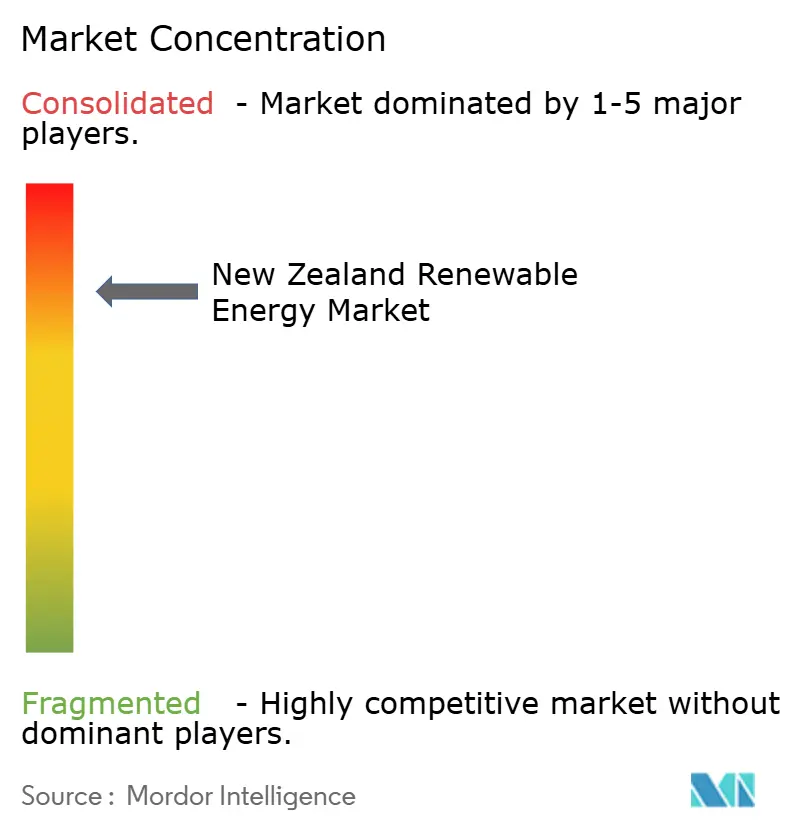
| Market Concentration | High |
Major Players *Disclaimer: Major Players sorted in no particular order Image © Mordor Intelligence. Reuse requires attribution under CC BY 4.0. | |
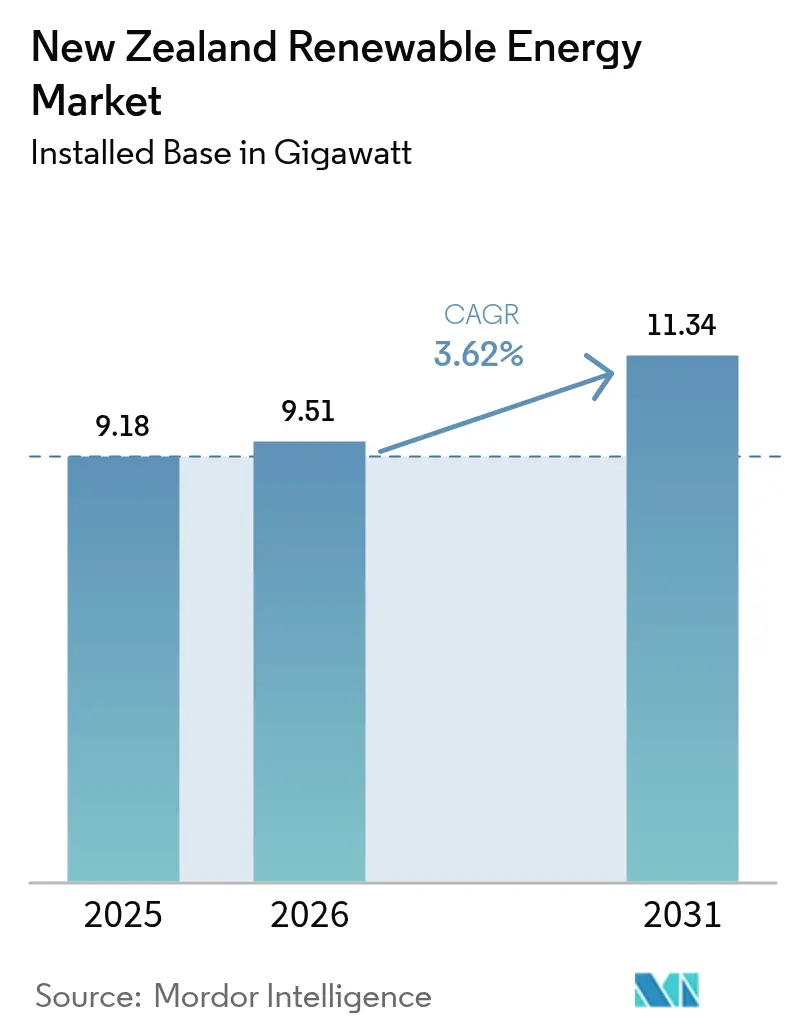
New Zealand Renewable Energy Market Analysis by Mordor Intelligence
New Zealand Renewable Energy Market size in 2026 is estimated at 9.51 gigawatt, growing from 2025 value of 9.18 gigawatt with 2031 projections showing 11.34 gigawatt, growing at 3.62% CAGR over 2026-2031.
Robust policy signals, abundant indigenous resources, and steady demand for clean electricity combine to underpin this modest yet reliable growth trajectory. Utilities accelerate construction schedules to meet the legislated 100% renewable electricity goal, while falling solar PV and battery prices unlock distributed generation opportunities. Transmission reinforcement programs, particularly the proposed USD 1.4 billion Cook Strait upgrade, indicate convergence between the need for generation expansion and grid reliability. Rising corporate power purchase agreements (PPAs) further strengthen project bankability, and early-stage green hydrogen pilots open a pathway for export-oriented capacity additions.
Key Report Takeaways
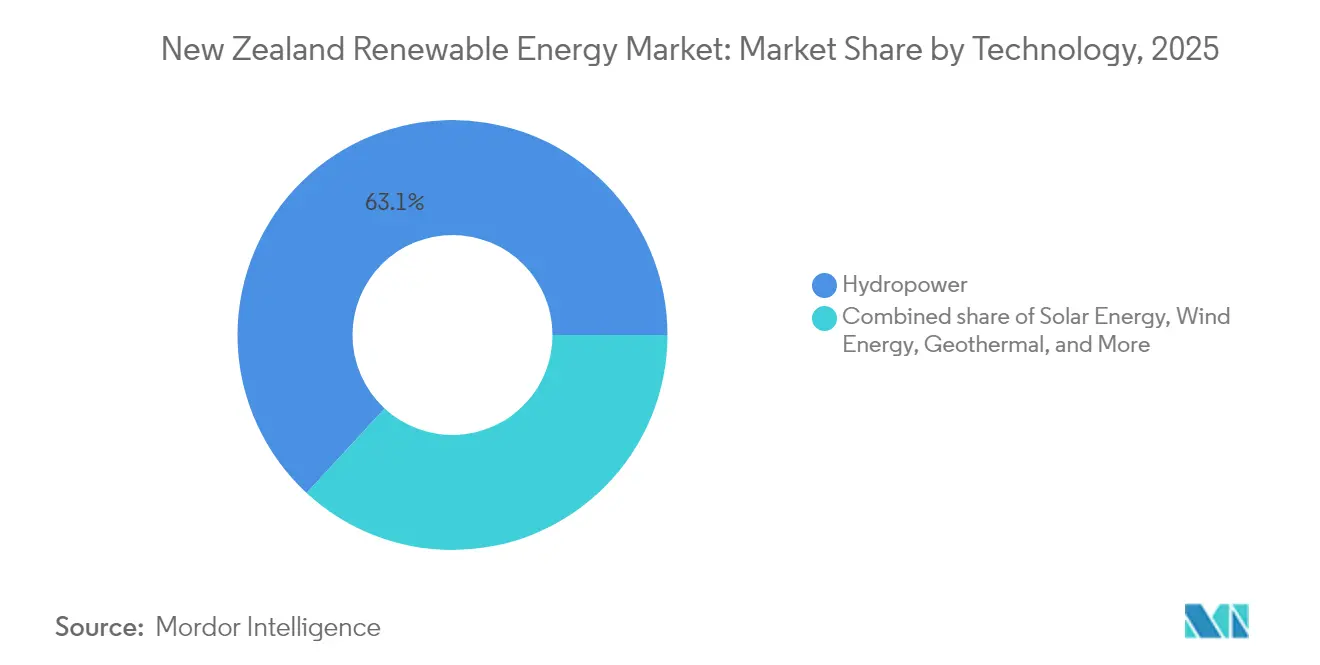
- By technology, hydropower led with a 63.13% market share in 2025; solar power is forecast to expand at a 19.67% CAGR through 2031.
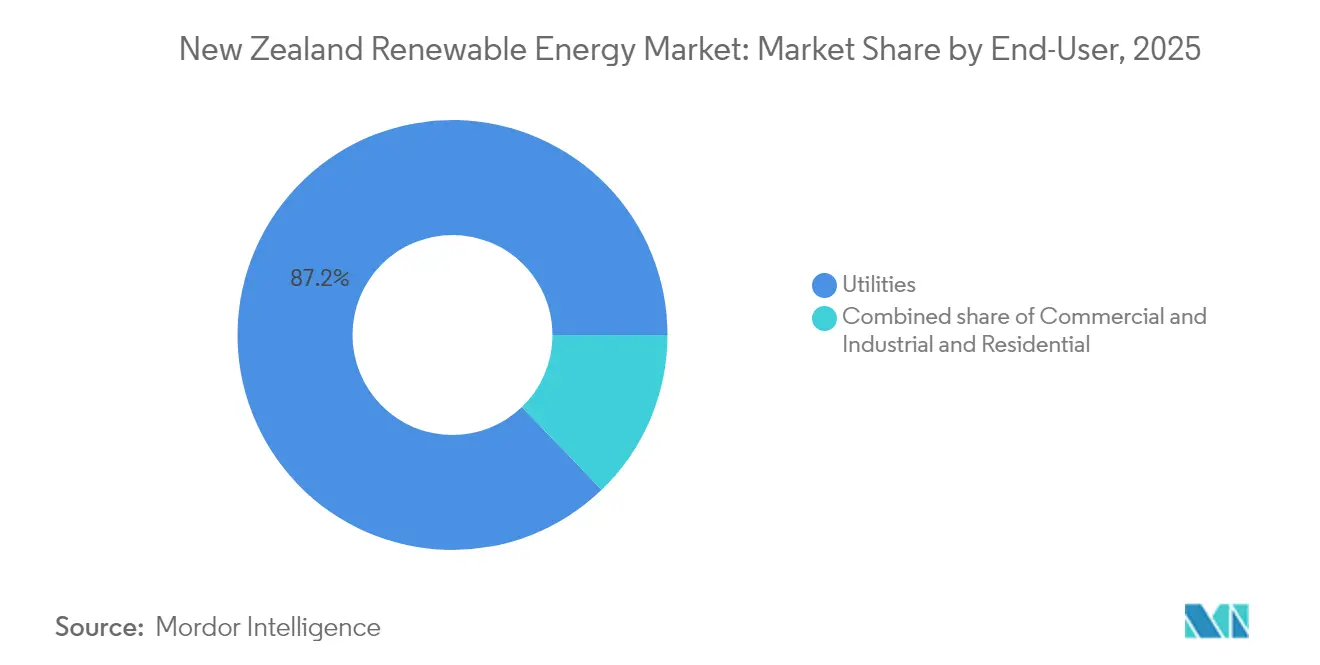
- By end-user, the utilities segment held 87.20% of the New Zealand renewable energy market share in 2025, while commercial and industrial installations were projected to record the highest CAGR of 11.56% from 2026 to 2031.
Note: Market size and forecast figures in this report are generated using Mordor Intelligence’s proprietary estimation framework, updated with the latest available data and insights as of 2026.
New Zealand Renewable Energy Market Trends and Insights
Drivers Impact Analysis*
| Driver | (~) % Impact on CAGR Forecast | Geographic Relevance | Impact Timeline |
|---|---|---|---|
| 100% renewable-electricity target accelerates utility build-out | +0.80% | National | Medium term (2-4 years) |
| Competitive LCOE from abundant hydro & geothermal resources | +0.60% | South Island and central North Island | Long term (≥ 4 years) |
| Corporate PPAs & industrial decarbonisation commitments | +0.40% | Auckland and industrial centers | Medium term (2-4 years) |
| Rapid cost decline in solar-PV & battery storage | +0.70% | Higher adoption in North Island | Short term (≤ 2 years) |
| Fast-track consenting under Spatial Planning Act | +0.30% | National | Short term (≤ 2 years) |
| Green-hydrogen export pilots triggering new capacity | +0.20% | Renewable-rich regions | Long term (≥ 4 years) |
| Source: Mordor Intelligence | |||
100% Renewable-Electricity Target Accelerates Utility Build-Out
A government statute mandating 100% renewable electricity by 2030 drives a decisive shift in capital allocation from thermal to clean energy assets. Utilities respond by front-loading wind, solar, and geothermal projects to avoid non-compliance penalties.(1)New Zealand Government, “Regional Infrastructure Fund: Supercritical Geothermal Exploration,” beehive.govt.nzCarbon pricing under the Emissions Trading Scheme further tilts project economics in favor of low-carbon technologies. Funding for supercritical geothermal exploration demonstrates the state’s commitment to supporting next-generation resource development. Gentailers now align their corporate strategies with the national decarbonization pathway, as evidenced by Genesis Energy’s multi-year USD 1 billion renewable investment program. As the penetration level approaches 100%, system balancing costs rise, highlighting the complementary value of storage and demand-response assets.
Competitive LCOE from Abundant Hydro & Geothermal Resources
Legacy hydro schemes in the South Island and high-capacity-factor geothermal plants in the central North Island combine to deliver some of the world’s most affordable renewable electricity.(2)Sumitomo Corporation, “Tauhara Geothermal Project Commissioning,” sumitomocorp.com The stable low marginal cost provides industrial customers with predictable energy bills and attracts inward investment from energy-intensive sectors. The recent 184 MW Tauhara geothermal project exemplifies the ability to deliver baseload renewables at scale, and its 3.5% contribution to national output underscores the strategic role of geothermal energy. A cost-competitive baseline also enables green-hydrogen developers to model export economics that hinge on inexpensive electricity. Consequently, hydro and geothermal resources serve as the financial backbone for the broader New Zealand renewable energy market.
Corporate PPAs & Industrial Decarbonisation Commitments
Major corporations pursue long-term PPAs to secure price certainty and establish brand credibility, stimulating the development of new utility-scale renewable capacity. Amazon’s agreement with Mercury Energy for output from the Turitea wind farm typifies this trend. The New Zealand Energy Certificate System provides traceability, enabling firms to demonstrate 100% renewable energy consumption. Industrial decarbonisation targets from sectors such as food processing and healthcare encourage sleeved PPAs and on-site generation, diversifying the customer base for power producers. PPAs reduce revenue volatility for developers, lowering financing costs and expanding the investable universe within the New Zealand renewable energy market.
Green-Hydrogen Export Pilots Triggering New Capacity
Government-backed pilots in Taranaki and Southland are exploring large-scale electrolysis fueled by surplus renewable energy generation. Hiringa Energy has launched the nation’s first hydrogen refueling network, creating an anchor demand segment.(3)Hiringa Energy, “National Hydrogen Refueling Network Overview,” hiringaenergy.co.nzProspective ammonia and synthetic-fuel ventures increase future electricity demand forecasts, encouraging utilities to underwrite additional wind and solar projects. Successful pilots could help New Zealand transition from a renewable electricity exporter to a renewable fuels supplier in Asia-Pacific shipping corridors, thereby extending the growth prospects for the New Zealand renewable energy market beyond domestic consumption.
Restraints Impact Analysis*
| Restraint | (~) % Impact on CAGR Forecast | Geographic Relevance | Impact Timeline |
|---|---|---|---|
| Transmission congestion & South-to-North bottlenecks | -0.40% | Cook Strait link | Medium term (2-4 years) |
| Dry-year risk & intermittency balancing costs | -0.30% | South Island hydro regions | Short term (≤ 2 years) |
| Iwi social-licence challenges for wind developments | -0.20% | Rural areas | Medium term (2-4 years) |
| Wholesale-price volatility deterring electrification CAPEX | -0.30% | Industrial customers | Short term (≤ 2 years) |
| Source: Mordor Intelligence | |||
Transmission Congestion & South-to-North Bottlenecks
A mismatch between resource-rich generation zones in the South Island and demand hubs in the North Island causes persistent congestion on the aging HVDC link. Transpower proposes replacing 1991-vintage cables and adding a fourth conductor for USD 1.4 billion. Until upgrades are completed, locational price disparities erode revenue for South Island wind and hydro plants, lengthening payback periods. Grid charges required to finance transmission reinforce upward pressure on retail tariffs, complicating political support for rapid capacity additions in the New Zealand renewable energy market.
Dry-Year Risk & Intermittency Balancing Costs
Hydrological variability periodically reduces hydroelectric output, necessitating thermal generation and imported coal to maintain the security of supply. Dry conditions in 2024 pushed spot prices to NZD 1,000/MWh and cut Mercury’s output by 295 GWh. Thermal dispatch not only increases emissions but also undermines investor confidence in electrification projects that rely on predictable, low-cost supply. Pumped-hydro proposals and grid-scale batteries are under evaluation but face challenges related to land use, cost, and engineering.
*Our forecasts treat driver/restraint impacts as directional, not additive. The impact forecasts reflect baseline growth, mix effects, and variable interactions.
Segment Analysis
By Type: Hydro Dominance Faces Diversification Pressure
Hydro accounted for 63.13% of New Zealand's generation in 2025, anchoring the country's renewable energy market with a cost-competitive baseload supply. Limited scope for new dam construction and environmental safeguards, however, caps further hydro expansion. Existing stations pursue efficiency upgrades rather than new reservoirs, keeping hydro output relatively flat across the forecast period. Wind is the principal growth vector, enabled by high-quality resource zones and proven development experience. Mercury's NZD 287 million Kaiwaikawe project signals continued scaling of wind portfolios, while Vestas has logged multiple turbine orders since 2024. Solar power, although contributing a smaller absolute share, posts the highest 19.67% CAGR through 2031, its distributed nature easing dependence on long-distance transmission. Geothermal retains its niche as a steady baseload contributor with the 184 MW Tauhara station and a further 101 MW expansion under EPC by Ormat Technologies. Marine and bioenergy remain experimental, representing optionality rather than material near-term volumes.
The evolving mix drives grid-integration challenges but also diversifies risk, mitigating exposure to hydrological variability. Investments in utility-scale batteries, synchronous condensers, and flexible demand programs complement the rising share of variable renewables. Overall, the New Zealand renewable energy market size for emerging technologies grows faster than that of legacy assets, internalizing innovation while leveraging the stability of hydro-geothermal assets.



By End-User: Utilities Remain on Top While Commercial and Industrial Gains Speed
New Zealand’s factories, food processors, and large warehouse operators are quietly transforming how they buy and use electricity. Between 2026 and 2031, the power drawn by this commercial and industrial group is on track to rise at an impressive 11.56% per year. The main reason is simple: large companies now view long-term renewable contracts as both a hedge against price fluctuations and a means to achieve their carbon reduction goals. Amazon’s multi-year deal with Mercury Energy for output from the Turitea wind farm is one well-publicized example, and local food manufacturers are following the same playbook. A national certificate system allows these firms to prove—line by line—that the electrons they consume come from wind, hydro, or geothermal stations, which keeps investors and customers satisfied. At the same time, plants are replacing gas boilers with industrial heat pumps and converting their fleets to electric vehicles, so electricity demand is spreading far beyond the production line. Smarter energy-management tools are also helping engineers time their usage to coincide with when renewable power is plentiful and wholesale prices are low.
Utilities still supplied roughly 87.20% of the country’s electricity in 2025, but that dominance is beginning to fray. The four “gentailers” - Meridian, Contact, Genesis, and Mercury - own most of the generation assets and retail brands, yet smaller retailers and new regulations are nibbling at their market share. On the household side, rooftop solar is gaining momentum as rule changes remove building-consent red tape and enable networks to handle a wider voltage range. In response, the big utilities are doubling down on scale: Mercury alone has earmarked more than USD 1 billion for new renewable projects, while Meridian has already switched on the country’s first grid-level battery system. Together, these moves indicate an electricity market that is becoming more democratic, with customers of all sizes playing a direct role in the transition to clean power.
Geography Analysis
Generation capacity skews southward where rivers and alpine lakes fuel extensive hydro schemes such as the Waitaki cascade. This regional surplus necessitates the HVDC link to ferry power northward into the Auckland and Waikato load centers. Transmission limits restrict transfer volumes during high-demand periods, illustrating the interconnected nature of generation, grid, and market outcomes within the New Zealand renewable energy market. South Island wind projects enjoy superior capacity factors but contend with grid congestion and lower nodal prices. The proposed Cook Strait cable reinforcement will partially relieve this constraint, improving price signals for new builds.
The North Island hosts the bulk of New Zealand's geothermal resources, with Taupo Volcanic Zone projects delivering stable base-load energy and offering black-start capabilities. Residential solar clusters around Auckland, where retail tariffs are higher, provide stronger economic paybacks. Valuable for grid recovery. Residential solar clusters around Auckland where retail tariffs are higher, providing stronger economic paybacks. Regional development programs support renewable clusters in Taranaki and the West Coast, aiming to transition traditional resource economies toward sustainable growth. Demand response from energy-intensive facilities, such as the Tiwai Point smelter, provides crucial system flexibility; however, uncertaintysmelter's smelter’s post-2027 power contract influences long-term generation investment decisions in the New Zealand renewable energy market.
Environmental permitting sensitivity varies geographically. Coastal wind farms face avian and marine-mammal impact assessments, whereas inland geothermal projects undergo iwi cultural consultation. These regional nuances necessitate tailored engagement strategies, but collectively sustain national momentum for renewable growth.
Regulatory Landscape
New Zealand's electricity market is regulated primarily by the Electricity Authority (Te Mana Hiko), an independent Crown entity established under the Electricity Industry Act 2010, with responsibilities spanning market rules, competition, and security of supply. A refreshed Government Policy Statement (GPS) updated in October 2024 took effect on 9 June 2026, providing updated directives and expectations for the Electricity Authority as New Zealand advances toward its renewable electricity objectives.
Policy and legislative settings also emphasize faster delivery of renewable generation and firming capacity. Government work led by MBIE includes initiatives framed under the Electrify NZ program to support private investment in generation and networks, alongside reforms aimed at strengthening the Electricity Authority's enforcement tools (including higher pecuniary penalties for code breaches) and improving market performance and consumer outcomes.
Competitive Landscape
Four gentailers—Meridian, Contact, Genesis, and Mercury—control 85% of electricity generation, giving the New Zealand renewable energy market a highly concentrated structure. Meridian leads in hydro output and has pioneered the first grid-scale battery at Ruakaka, signposting diversification beyond generation into storage services. Contact Energy’s USD 1.9 billion purchase of Manawa Energy in July 2025 creates the country’s largest renewable portfolio, balancing hydro and geothermal risk profiles and enabling dispatch optimisation across multiple basins. Genesis Energy invests in firming capacity through its 200 MWh battery initiative while divesting coal units ahead of the 2030 fossil phase-out. Mercury extends its wind pipeline with the Kaiwaikawe project and secures high-credit PPAs, reflecting a strategy of long-dated cash-flow visibility.
Competitive edges increasingly rest on technology partnerships. Contact’s EPC engagement with Ormat for a 101 MW geothermal unit leverages global know-how, while Meridian collaborates with battery OEMs to exploit grid-support service revenues. Independent retailers target niche customer groups with 100% renewable claims, but revenue margins remain thin due to wholesale price spikes. Innovation momentum spills into storage, hydrogen, and marine prototypes, where small players like ArcActive and Sustainable Seas Challenge carve out intellectual-property niches valuable for future scaling.
New Zealand Renewable Energy Industry Leaders
Contact Energy Limited
Genesis Energy L.P.
General Electric Company
Meridian Energy Limited
Vestas Wind Systems A/S
- *Disclaimer: Major Players sorted in no particular order

Market Opportunities and Future Outlook
A clear near-term whitespace is forming around diversification away from hydro-only risk, with developers and gentailers progressing utility-scale solar, hybrid projects (wind, solar, and BESS), and firming assets that address dry-year price volatility and congestion constraints. Recent project activity underscores this shift: Meridian's Waiinu Energy Park (622 MW, combining wind, solar, and storage) has been referred into the Fast-track Approvals pathway, while multiple large solar builds have reached construction milestones, including Contact Energy's 150 MW Kowhai Park module installation and first-module progress at the 400 MW Te Rahui solar farm involving Nova Energy and Meridian.
Consenting and system-access settings remain central to unlock build pipelines, making transmission and market-rule reforms an investable opportunity area alongside generation. Transpower's proposed up to USD 1.4 billion Cook Strait HVDC reinforcement anchors the grid-side need to move South Island renewable surplus toward North Island load, while government measures to accelerate residential solar adoption (including voltage-range changes and building-consent exemptions targeting 507 GWh of added generation) expand distributed generation and behind-the-meter storage opportunities. Corporate procurement and traceability tools (for example, the New Zealand Energy Certificate System supporting PPAs such as Amazon's arrangement with Mercury Energy tied to Turitea) continue to widen the bankable offtake base beyond utilities.
Recent Industry Developments
- July 2026: Meridian Energy received final approval via the government's Fast-track process to access contingent hydro storage at Lake Pukaki for a three-year period. The approval supports operational flexibility during dry-year conditions and strengthens the role of hydro as firming for expanding wind and solar build-outs.
- April 2026: Genesis Energy reached final investment decision for Stage 2 of the Huntly battery energy storage system (100 MW/200 MWh). Advancing a large utility-scale battery at a major site supports peak management and system balancing as variable renewables increase their share of generation.
- July 2025: Contact Energy completed its NZD 1.9 billion acquisition of Manawa Energy, creating one of the largest renewable generation portfolios in the country. The consolidation strengthens scale advantages in dispatch optimization across hydro and geothermal assets and increases competitive intensity for new project development and offtake contracting.


Research Methodology Framework and Report Scope
Market Definition and Coverage
This market covers renewable energy deployment in New Zealand, measured as installed power capacity, across grid and behind-the-meter projects that add renewable generation capability over time.
Scope exclusions: We exclude non-renewable generation, fossil fuel hybrid output that is not renewable-sourced, and pure electricity retailing activity that does not create renewable capacity.
Segmentation Overview
- By Type
- Solar Energy (PV and CSP)
- Wind Energy (Onshore and Offshore)
- Hydropower (Small, Large, PSH)
- Bioenergy
- Geothermal
- Ocean Energy (Tidal and Wave)
- By End-User
- Utilities
- Commercial and Industrial
- Residential
Data Sources, Market Sizing, and Validation
Desk Research
Desk research was used to map the installed base, recent additions, and the policy and grid context that drives project timing. We relied on public and official sources such as MBIE energy statistics, New Zealand government policy and permitting releases, the Electricity Authority and Transpower grid publications, and IEA and IRENA renewable indicators for cross-checking directionally.
Along with these, we reviewed investor presentations, annual reports, and project announcements to understand commissioning schedules and technology mix changes. Patent databases were scanned to see where equipment and control innovations were being adopted in local projects, and we used a paid subscription for company financials and news to cross-check ownership changes and project status updates. The sources listed here are illustrative only, and we used additional references to collect data, validate totals, and clarify open questions.
Primary Interviews and Surveys
Primary work was done through expert interviews and structured surveys with developers, utilities, engineering and project services participants, equipment channel contacts, and large electricity users who procure renewable supply. The respondent input helped confirm which capacity additions were expected to actually connect, how repowering and life-extension were being counted, and what the realistic timing looked like across New Zealand.
Because this is a single-country market, the interview coverage focused on covering the main customer groups and supply-side roles rather than splitting fieldwork by region, and then we re-contacted respondents when desk findings and model outputs did not match project reality.
Distribution of primary research fieldwork respondents
| Company type | Respondent position |
|---|---|
| Top tier: 35% | CXOs: 19% |
| Mid tier: 43% | Functional/Unit leaders: 31% |
| Smaller Players: 22% | Managers: 50% |
Market-Sizing & Forecasting
Sizing was built using a top-down approach where New Zealand renewable installed capacity is reconstructed from technology-wise additions, retirements, and commissioning schedules, and then carried forward year by year. The output was checked with selective bottom-up approximations, such as sampling active project pipelines, applying typical capacity ranges by technology, and validating totals through supplier and channel checks, before final adjustments were made.
Practical inputs that shaped the model included announced and consented project capacity, grid connection and curtailment signals, commissioning lead times by technology, repowering activity in wind assets, and the annual renewable generation share signals that help explain build urgency. Where project details were incomplete, gaps were handled through conservative capacity banding and timing scenarios agreed during interviews, and the assumptions were documented so they can be repeated.
For forecasting, we used scenario analysis, supported by short trend fits on capacity addition run-rates and interview-backed views on permitting speed and grid readiness. The final forecast reflects a base case that stays consistent with observable pipeline health and the step-by-step capacity math, rather than assuming smooth growth in every year.
Data Validation & Update Cycle
Outputs were validated by comparing modeled capacity totals against independent signals, including official energy statistics, grid operator publications, and observed technology mix direction. When a variance was found, we traced the drivers back to specific projects, retirement assumptions, or timing choices that caused the shift, and then re-ran the model.
Before sign-off, the work goes through multi-step analyst review so calculation logic, units, and carry-forward assumptions are consistent across years. The report is refreshed annually, and interim updates are made when material events happen, such as major project cancellations, commissioning slippage, or policy changes. Right before delivery, a fresh review pass is completed so clients receive the latest updated view.
Mordor Intelligence's New Zealand Renewable Energy Market Sizing Compared With Other Published Estimates
Published estimates for New Zealand renewable energy can look far apart because the term renewable energy is not always measured the same way, and because some sources mix capacity with revenue-based market value. Differences also show up when forecasts assume faster grid connections or count project pipelines that have not reached a realistic execution stage.
The main gap comes from unit and scope mixing, where Mordor Intelligence keeps the market in installed capacity (GW) and only counts additions that are supported by commissioning and connection reality, instead of converting electricity output into USD using wholesale price assumptions.
Benchmark comparison
| Source | Market Size | Gaps in Research Methodology |
|---|---|---|
| Mordor Intelligence | USD 9.18 B (2025) | |
| Industry Data Publisher A | USD 2.30 B (2025) | This figure reflects electricity generation market value for selected renewable generation types, which can exclude hydro and solar capacity and uses price-linked revenue, not installed GW. |
| Online Research Outlet B | USD 75.00 B (2025) | This estimate appears to report a broad value pool with unclear conversion logic, likely combining energy value and infrastructure spend, which can inflate totals when capacity, output, and investment are blended. |
The spread in the table mainly comes from whether the market is treated as capacity, electricity value, or a wider investment pool. By keeping inputs tied to project additions, retirements, and connection timing, the result stays easier to audit and to reconcile with real-world build activity year to year.


Key Questions Answered in the Report
What is the current size of the New Zealand renewable energy market?
The New Zealand renewable energy market size is 9.51 GW in 2026.
How fast is the market expected to grow?
Capacity is projected to reach 11.34 GW by 2031, reflecting a 3.62% CAGR.
Which technology segment is growing the quickest?
Solar records the fastest expansion, advancing at a 19.67% CAGR through 2031.
Who are the leading companies in New Zealand’s renewable sector?
Meridian, Contact, Genesis, and Mercury collectively hold 85% of generation capacity.
What infrastructure upgrades are planned to support further growth?
Transpower plans a USD 1.4 billion upgrade of the Cook Strait HVDC link to ease South-North transmission constraints.
How is the government supporting residential solar uptake?
Policy changes to voltage limits and building-consent exemptions aim to add 507 GWh of rooftop solar generation.
Page last updated on:





