
Market Overview
| Study Period | 2021 - 2031 |
|---|---|
| Forecast Data Period | 2026 - 2031 |
| Historical Data Period | 2021 - 2024 |
| Growth Rate | 3.02 % |
| Market Concentration | Low |
Major Players *Disclaimer: Major Players sorted in no particular order Image © Mordor Intelligence. Reuse requires attribution under CC BY 4.0. | |
United Kingdom Smart Grid Network Market Analysis by Mordor Intelligence
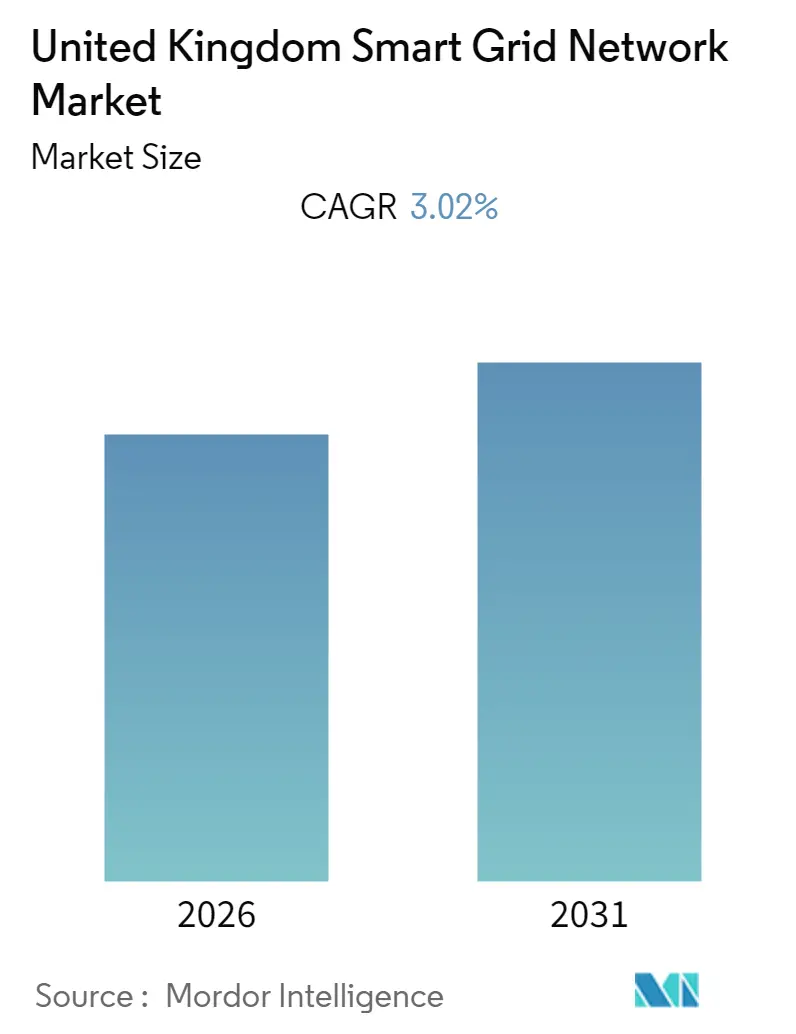
The United Kingdom Smart Grid Network Market size is expected to register a CAGR of 3.02% during the forecast period.
- Advanced Metering Infrastructure (AMI) is expected to witness significant growth during the forecast period due to the increasing deployment of smart grid technologies.
- The UK government is increasingly viewing smart grid technology as a strategic infrastructural investment that will sustain their long-term economic prosperity and help them achieve their carbon emission reduction targets. This, in turn, is expected to provide an ample amount of opportunities to the companies involved in the smart grid network market in the near future.
- Increasing investments in smart grid networks are expected to drive the market during the forecast period.
Note: Market size and forecast figures in this report are generated using Mordor Intelligence’s proprietary estimation framework, updated with the latest available data and insights as of 2026.
United Kingdom Smart Grid Network Market Trends and Insights
Advanced Metering Infrastructure (AMI) to Witness Significant Growth
- Advanced metering infrastructure (AMI) or smart metering is an integrated system of smart meters, communications networks, and data management systems that enables two-way communication between utilities and customers.
- The metering industry has taken rapid strides in the recent past few years by traversing from automated meter reading (AMR) to smart metering, using bi-directional communication, thereby enabling greater benefits to electricity distribution companies (DISCOMs), customers, and society.
- AMI provides significant operational benefits, which leads to cost savings for utility companies and convenience for customers. AMI can significantly reduce operating costs of utility companies by remotely reading meters, connecting/disconnecting service, identifying outages, generating more accurate bills in a faster manner, and enabling utilities to provide customers digital access to their usage information.
- The UK government committed to a USD 18 billion nationwide AMI roll-out, with energy suppliers responsible for the roll-out (both in terms of implementation and ownership as well as financing). The official national smart meter roll-out began in 2016 and was originally planned to finish in 2020. However, suppliers have received an extra four years (i.e., till 2024) to keep installing meters.
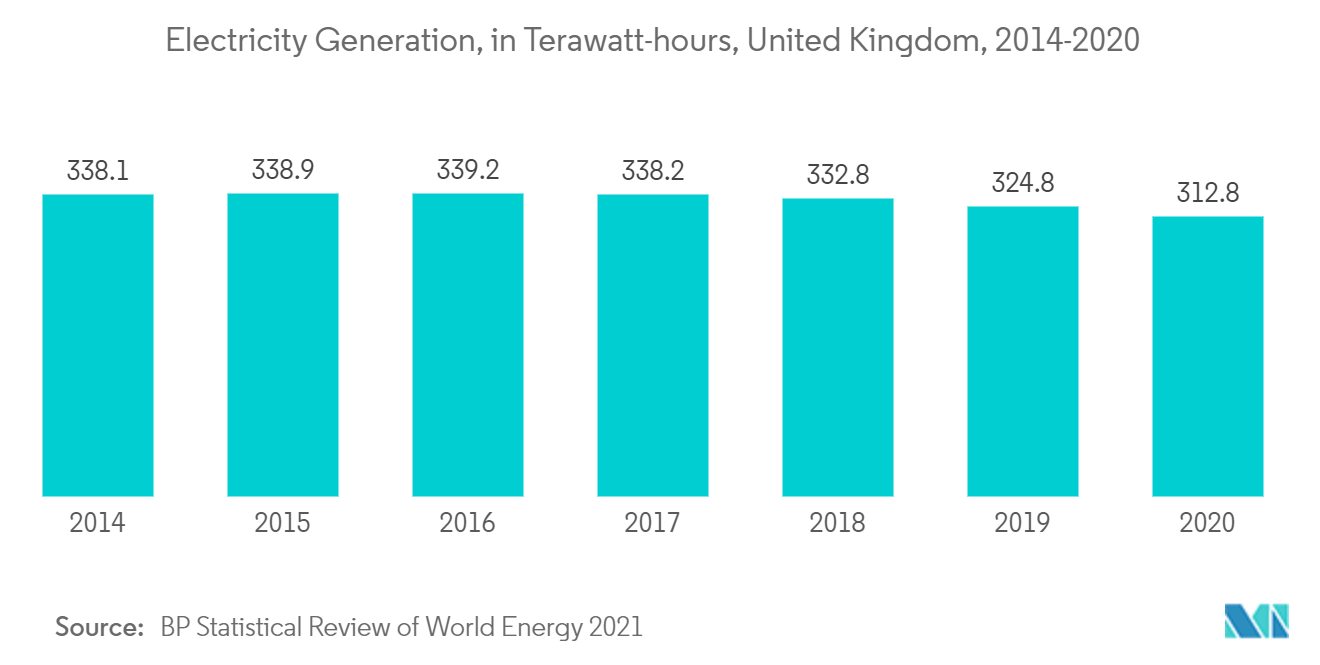
- The electricity generation in the country has been decreasing over the years, especially due to the phasing out of fossil fuels for cleaner fuels. In 2020, the country generated around 312.8 Terawatt-hours of energy which is around 4% lower than in 2019. This trend is expected to change, especially due to the rising renewable energy sector and uptick after the pandemic.
- Therefore, with the increasing efforts to modernize the electricity grid and reduce T&D losses, governments across the world are investing in advanced metering infrastructure. This, in turn, is expected to drive the AMI market during the forecast period.
Increasing Investments in Smart Grids Drive the Market Demand
- Public and private organizations in the United Kingdom are investing in smart electric grid upgrades, working as a driver for developed innovative products, services, or technologies related to the smart grids.
- In 2021, United Kingdom's Northern Powergrid started its investment into the pilot smart grid network technology to increase the resilience of 'micro' areas of the grid. The EUR 2.5 million program Microresilience uses energy storage systems and innovative communications technology to maintain power supplies to critical infrastructure and isolated communities. New innovations and investments are expected to make the technology more accessible in different parts of the world, thereby aiding the growth of the market.
- In July 2021, a major smart grid trial took place in the country, which was funded by Ofgem's Annual Network Innovation Competition. It was conducted by Vodafone, which kickstarted a trial with UK Power Networks to connect the country's electricity network on a dedicated slice of its national 5G network. The initiative is part of the grid operator's new Constellation project to compute resources into its substation network, connected over 5G. Investments in the 5G smart grid network are likely to aid the growth of the market in the coming years.
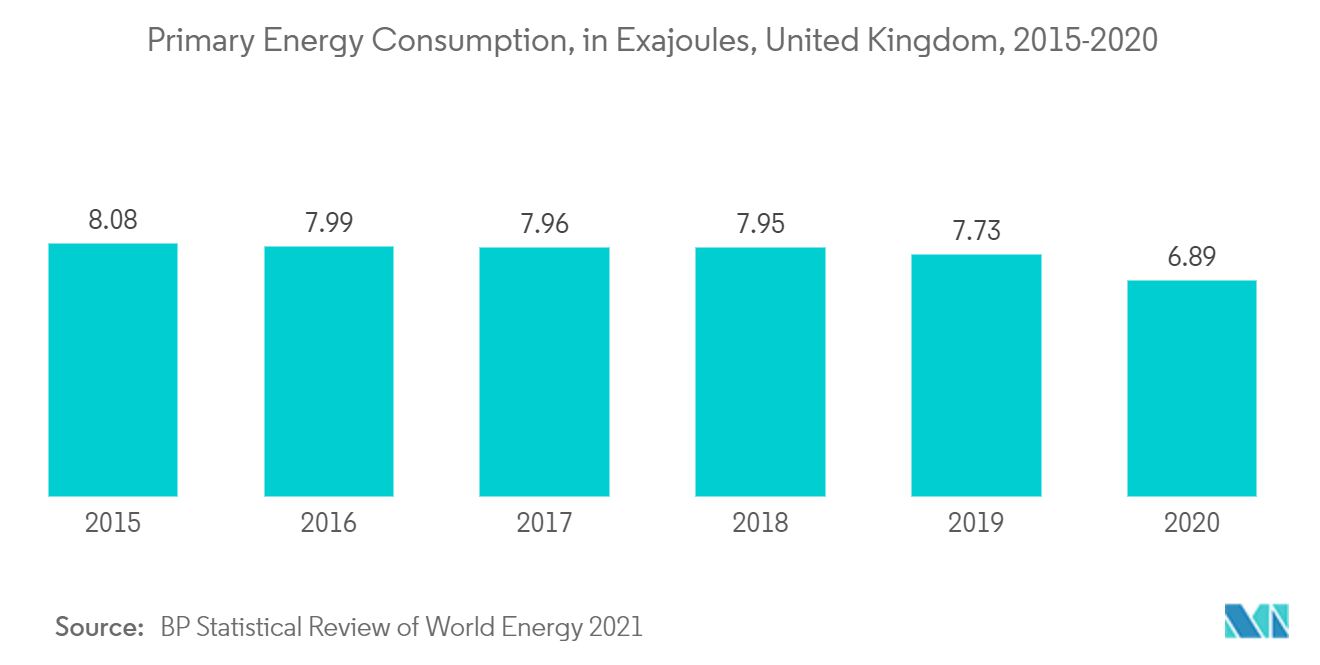
- The most important trend to ascertain the growth of the smart grid is the rising demand for energy in the country, which saw some setbacks due to COVID-19 but is expected to grow significantly after 2021. In 2020, the primary energy consumption of the United Kingdom was around 6.89 Exajoules, a decrease from 7.73 exajoules in 2019.
- Increasing demand, constrained supply, emphasis on energy security, and challenging carbon reduction targets are driving transformation in the energy sector, utilities, and smart grid technologies, thus, playing a key role in coming years.
- Hence, the increasing investments are expected to drive the United Kingdom smart grid market in the coming years.
Regulatory Landscape
The United Kingdom smart grid network market operates under a tightening framework led by Ofgem and the Department for Energy Security and Net Zero (DESNZ), covering smart metering communications, network price controls, and connected-device governance. In April 2026, Ofgem awarded the Successor Smart Meter Communication Licence (DCC) to DCC2 Ltd, supporting continuity of nationwide smart meter communications and reinforcing oversight of core digital energy infrastructure.
Network investment and operational digitalization obligations are being formalized for the next planning cycle. Ofgem published its ED3 Sector Specific Methodology Decision in May 2026 for the 2028 to 2033 electricity distribution price control period, embedding integrated network development planning into allowed investments. In parallel, the Smart Secure Electricity Systems (SSES) programme is advancing regulatory requirements for Energy Smart Appliances (ESAs), including cybersecurity alignment with ETSI EN 303 645 and compliance with tariff data specifications within the Retail Energy Code, which sharpens compliance checkpoints for device makers, suppliers, and flexibility-enablement platforms.
Value Chain Analysis
The UK smart grid network value chain runs from device and software OEMs (smart meters, sensors, communications, substation automation, ADMS/DERMS) through telecom and data platforms, system integrators and EPCs, to regulated network operators and suppliers that procure and deploy solutions under Ofgem frameworks. Upstream manufacturing and specialist component supply (for example, metering, power electronics, HVDC converter technology, cables, and communications gear) feeds into integrators and tiered delivery partners supporting major transmission and distribution programs, while downstream work includes installation, commissioning, managed services, cybersecurity, and operations analytics that connect field assets to control rooms and market platforms.
Delivery is increasingly organized around portfolio partnerships and large program contracting as grid reinforcement and digitalization scale. National Grid has used collaborative enterprise models such as the Great Grid Partnership to coordinate design and construction capacity across multiple partners, while major Scotland to England subsea transmission projects have awarded multi billion pound packages, including converter stations and cable supply involving Siemens Energy, Hitachi Energy, Prysmian, NKT, and others (EGL3 and EGL4 contracts signed in March 2026). On the market and data side, reforms such as Ofgem-led connections changes (TMO4+) and Elexon’s role in flexibility market asset registration infrastructure reinforce the need for interoperable data flows linking distributed assets, aggregators, and network operations.
Competitive Landscape
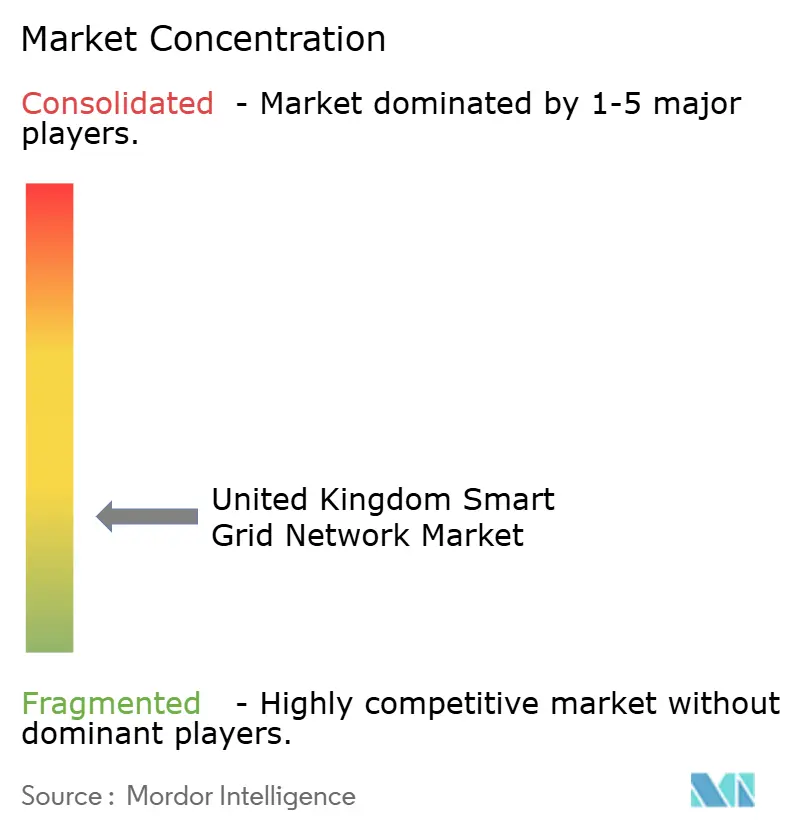
The UK smart grid network market is fragmented. Some of the major companies in the market include EdF Energy, E.ON SE, SSE PLC, Schneider Electric SE, and Renault Group.
United Kingdom Smart Grid Network Industry Leaders
-
EdF Energy
-
SSE PLC
-
Schneider Electric SE
-
Renault Group
-
E.ON SE
- *Disclaimer: Major Players sorted in no particular order
Market Opportunities and Future Outlook
Opportunities in the UK smart grid network market center on regulated investment cycles, digital network planning, and the operationalization of flexibility and controllable demand. Ofgem’s RIIO-3 final determinations for electricity transmission and gas networks, running from 1 April 2026 to 31 March 2031, include GBP 28.7 billion of approved upfront investment across affected sectors, supporting programs that depend on grid monitoring, automation, communications, and digital substations. Alongside this capex backbone, Ofgem issued Digitalisation Strategy and Action Plan (DSAP) guidance on 1 April 2026 that requires network companies to keep action plans updated on a six-month cadence, which creates ongoing procurement needs for data governance, interoperability tooling, and cyber-resilient OT/IT architectures.
The SSES programme also creates an opportunity lane by defining how Energy Smart Appliances, such as smart heating, EV charging, and battery systems, connect and respond to grid needs, with cybersecurity requirements aligned to ETSI EN 303 645 and movement toward a load control licensing regime. Evidence of the shift is visible in utility-led digital tools and innovation funding: National Grid and Atos launched Triton as a digital twin and data visualization tool for network planning, and National Grid with Keen AI secured Ofgem Strategic Innovation Fund Alpha support for the FoSMo platform to standardize visual inspection and asset management workflows. These initiatives raise demand for sensors, data platforms, analytics, and secure device management, while making compliance-ready product design for connected appliances and field communications more significant for vendor positioning.
Recent Industry Developments
- July 2026: EDF Energy and Duracell Energy launched a three-month residential home battery trial across England using 50 systems to test participation in local flexibility markets. The initiative operationalizes behind-the-meter storage as a grid service and supports the commercial case for aggregators, smart inverters, and control platforms that interface with DNO flexibility mechanisms.
- May 2026: SP Energy Networks and Keen AI launched the IConn digital tool to automate transmission grid connection constraint analysis for energy developers. By digitizing and accelerating constraint assessment, the tool supports faster connection decisions and increases demand for interoperable data models that link planning, network operations, and connection processes.
- April 2026: National Grid initiated a five-year, 900 km dynamic line rating rollout on 275 kV transmission routes in North East England, Humber, and East Anglia, using sensor technology from LineVision, Ampacimon, and Heimdall. The deployment expands real-time asset monitoring to release more capacity from existing corridors, increasing demand for grid-edge sensing, communications, and analytics integrated into operational decision-making.
Research Methodology Framework and Report Scope
Market Definition and Coverage
For this study, the United Kingdom smart grid network market covers spending on technologies and related services that make the power network more automated, observable, and responsive, across transmission and distribution, including data, communications, and control layers that support smarter grid operations.
Scope exclusions: We exclude downstream customer energy devices and retail energy services that sit outside electricity network operations and grid control.
Segmentation Overview
- Technology Application Area
- Transmission
- Demand Response
- Advanced Metering Infrastructure (AMI)
- Other Technology Application Areas
Data Sources, Market Sizing, and Validation
Desk Research
Desk research starts with building a UK grid context using public sources that explain network structure, regulation, and rollout timelines. We typically refer to sources such as government and regulator publications (for example, energy system plans and price control documentation), national statistics, and electricity system operator updates to understand investment cycles and demand-side programs.
To quantify and cross-check inputs, we also use sources such as utilities and network operator annual reports, investor presentations, tender notices, and reputable press coverage for project timing and technology focus. Where company-level numbers are not detailed, paid subscriptions supporting company financials and news intelligence, along with patent databases and contract and tender tracking, are used to validate participation and direction of spend. These desk sources are not exhaustive, and many other public and paid references are also used for data collection, validation, and clarification.
Primary Interviews and Surveys
Primary work is used to pressure-test the desk assumptions with people who plan, sell, deploy, or operate smart grid network solutions in the UK. We cover a mix of network-side stakeholders and solution providers, and then the inputs are used to confirm adoption rates, typical project scope, and how pricing changes as deployments move from pilots to scaled rollouts.
Distribution of primary research fieldwork respondents
| Company type | Respondent position |
|---|---|
| Top tier: 31% | CXOs: 14% |
| Mid tier: 47% | Functional/Unit leaders: 40% |
| Smaller Players: 22% | Managers: 46% |
Market-Sizing & Forecasting
Market sizing is built using a top-down approach where UK network investment pools and program rollouts are reconstructed and then filtered into smart grid network relevant spend. This is then corroborated using selective bottom-up approximations, such as sampled project values from public awards, channel checks on typical solution bundles, and pricing per deployed unit where it is consistently referenced.
Key model inputs include indicators such as smart meter and AMI rollout pace, planned digitalization and automation spend under price control periods, demand response enablement activity, and substation and feeder automation upgrades. We also track the timing of grid reinforcement needs linked to renewable integration and EV charging growth, because these often pull forward monitoring, communications, and control investments. Where a bottom-up view has gaps, we use conservative ranges guided by interview feedback and keep assumptions traceable to a small set of drivers.
For forecasting, scenario analysis is used around policy and investment timing, followed by smoothing of the resulting series to avoid unrealistic step-changes between years. The final forecast path is kept aligned with interview consensus on procurement cadence, implementation lead times, and expected pricing movement as deployments scale.
Data Validation & Update Cycle
Outputs are validated through multiple checks so that single-source bias is avoided. We compare the model against independent signals such as known program timelines, tender activity patterns, and the implied spending intensity per rollout milestone, and then outliers are reviewed and corrected before sign-off.
If variances remain material, re-contact is triggered with relevant respondents to clarify definitions, timing, or pricing, and then assumptions are updated and documented. Reports are refreshed annually, with interim updates when major policy, funding, or delivery changes occur. Right before delivery, a final pass is completed so the view reflects the latest available public updates and market feedback.
Mordor Intelligence's United Kingdom Smart Grid Network Market Market Sizing Compared With Other Published Estimates
Published market values for UK smart grid networks can look far apart because each source draws the line differently on what counts as a grid-network spend, and they also assume different rollout speeds and price paths. Differences typically show up in whether broader smart grid hardware and services are counted together, and in how fast demand response and AMI programs are expected to scale.
In practice, the gaps usually come from scope choices (network-focused programs versus wider smart grid ecosystems), the year used for currency conversion and inflation treatment, and how the model handles lumpy multi-year utility capex cycles. Some estimates also lean on aggressive growth cases without re-checking them against procurement cadence and the time it takes to commission network upgrades, which tends to move the forecast curve upward quickly.
Benchmark comparison
| Source | Market Size | Gaps in Research Methodology |
|---|---|---|
| Mordor Intelligence | USD 2.66 B (2025) | |
| Industry Publisher A | USD 2.79 B (2025) | This figure is closer to a broader smart grid view that can fold in more end-user and regional coverage layers, which can lift totals even when network deployment timing is unchanged. |
| Market Catalog B | USD 4.20 B (2025) | This estimate appears to include a wider basket of software, services, and adjacent enablement items (including items sometimes budgeted under cybersecurity and analytics), which increases the 2025 total compared to a tighter network program spend view. |
The table shows that the biggest spread is explained by what gets counted as network-only spending versus a wider smart grid technology bundle, which is why the UK market number can move quickly between sources. By tying the 2025 value to UK rollouts across transmission, demand response, AMI, and related network programs, and then stress-testing the timing and pricing with interviews, the scope stays tighter and more repeatable, a choice applied by Mordor Intelligence.
Key Questions Answered in the Report
What is the current United Kingdom Smart Grid Market size?
The United Kingdom Smart Grid Market is projected to register a CAGR of 3.02% during the forecast period (2026-2031)
Who are the key players in United Kingdom Smart Grid Market?
EdF Energy, SSE PLC, Schneider Electric SE, Renault Group and E.ON SE are the major companies operating in the United Kingdom Smart Grid Market.
What years does this United Kingdom Smart Grid Market cover?
The report covers the United Kingdom Smart Grid Market historical market size for years: 2020, 2021, 2022, 2023 and 2024. The report also forecasts the United Kingdom Smart Grid Market size for years: 2026, 2027, 2028, 2029, 2030 and 2031.