Market Overview
| Study Period | 2018 - 2031 |
|---|---|
| Forecast Data Period | 2026 - 2031 |
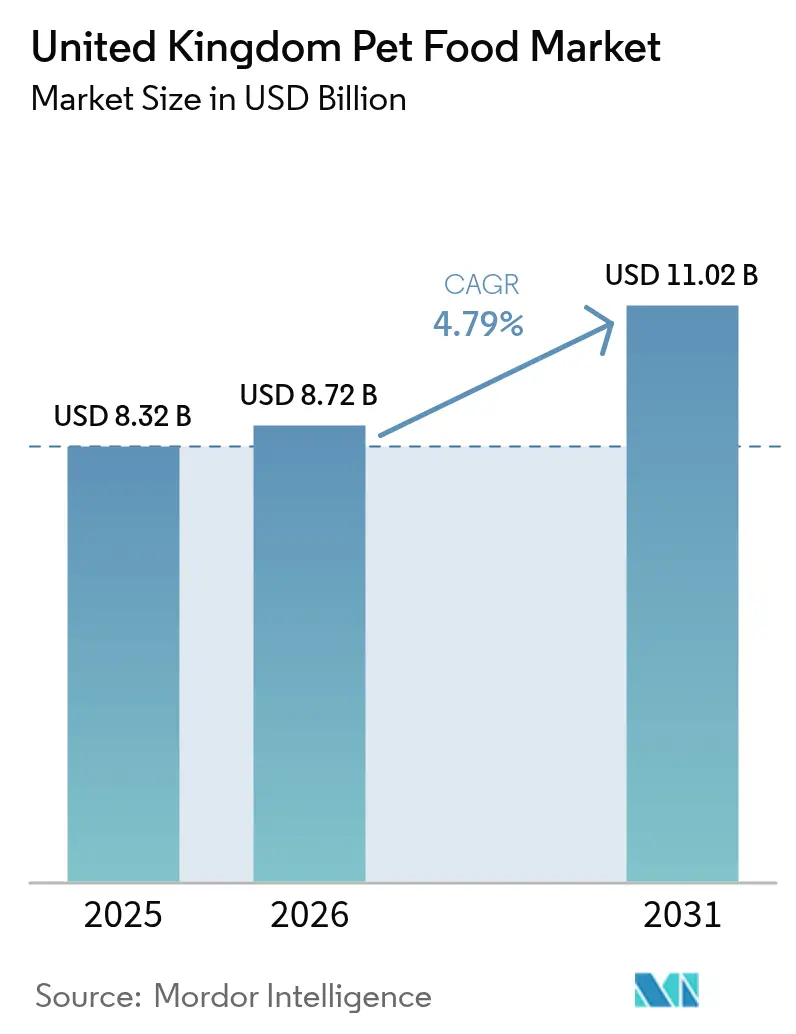
| Base Year Market Size (2025) | USD 8.32 Billion |
| Market Size (2026) | USD 8.72 Billion |
| Market Size (2031) | USD 11.02 Billion |
| Growth Rate (2026 - 2031) | 4.79% CAGR |
| Market Concentration | Low |
Major Players *Disclaimer: Major Players sorted in no particular order Image © Mordor Intelligence. Reuse requires attribution under CC BY 4.0. | |
United Kingdom Pet Food Market Analysis by Mordor Intelligence
The United Kingdom pet food market size was valued at USD 8.32 billion in 2025 and estimated to grow from USD 8.72 billion in 2026 to reach USD 11.02 billion by 2031, at a CAGR of 4.79% during the forecast period (2026-2031). Rising premiumization, digital commerce adoption, and demographic shifts that favor single-person and senior households reinforce the market’s resilience. Companies continue to widen functional portfolios, integrate supply chains, and invest in domestic capacity to offset post-Brexit frictions and currency swings. Sustainability scrutiny accelerates interest in alternative proteins, recycled inputs, and recyclable packaging, encouraging innovation and brand differentiation. Cost-of-living pressures do temper trading‐up, yet premium categories hold ground as owners prioritize perceived health benefits for companion animals.
Key Report Takeaways
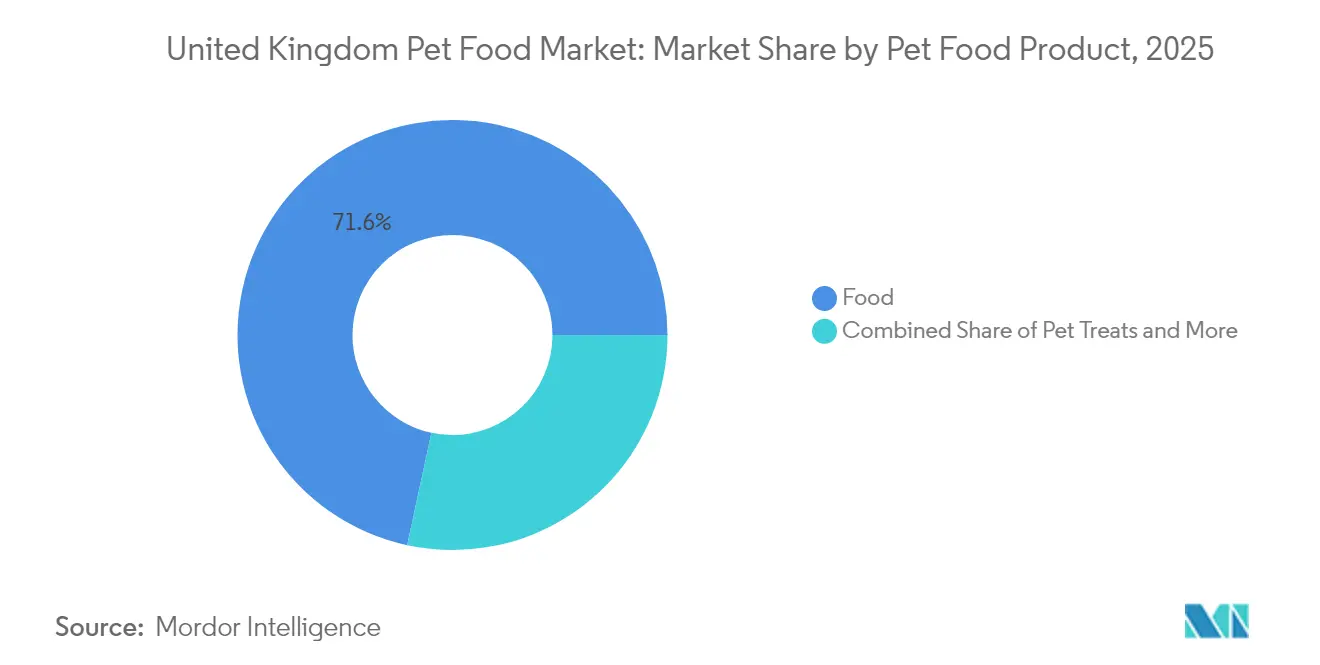
- By pet food product, food held 71.62% of the United Kingdom pet food market share in 2025, while pet treats lead future growth at a 5.55% CAGR through 2031.
- By pets, dogs captured 43.62% revenue share of the United Kingdom pet food market size in 2025 and will expand at a 5.32% CAGR to 2031.
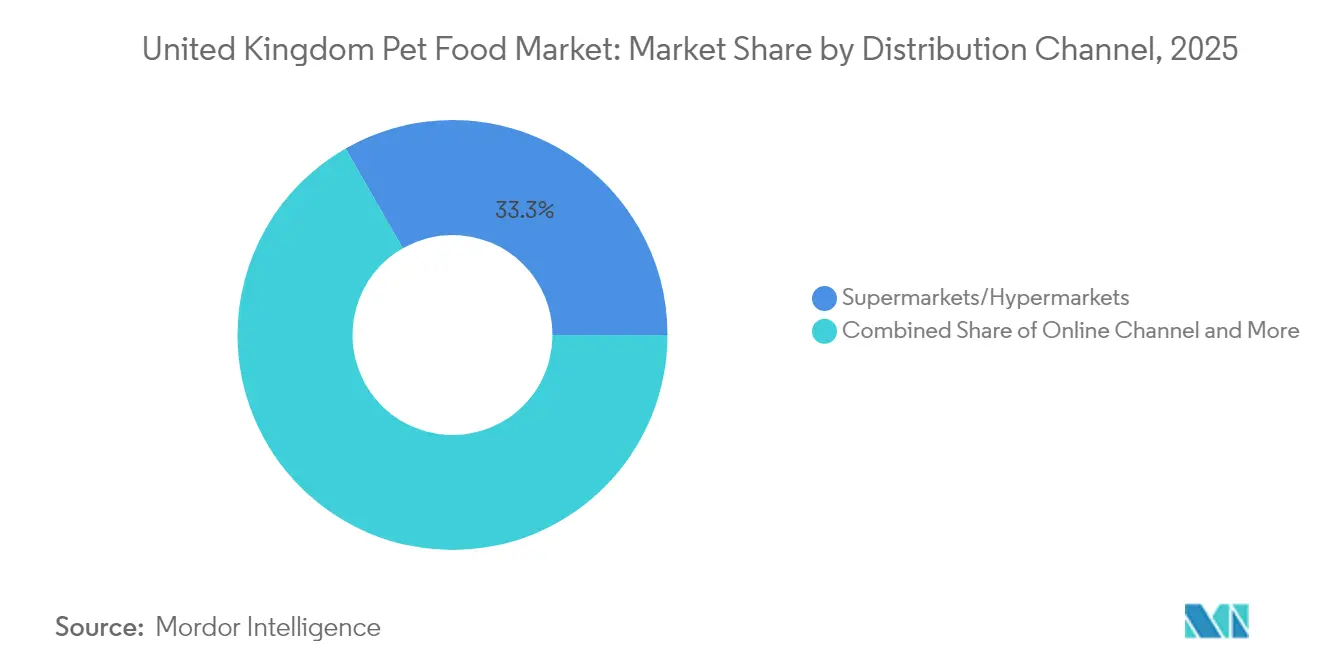
- By distribution channel, supermarkets and hypermarkets controlled a 33.28% share in 2025, whereas online channel are projected to post the fastest 6.12% CAGR to 2031.
Note: Market size and forecast figures in this report are generated using Mordor Intelligence’s proprietary estimation framework, updated with the latest available data and insights as of 2026.
United Kingdom Pet Food Market Trends and Insights
Drivers Impact Analysis*
| Driver | (~) % Impact on CAGR Forecast | Geographic Relevance | Impact Timeline |
|---|---|---|---|
| Humanization of pets elevating demand for premium food | +1.2% | National, with higher impact in urban areas | Long term (≥ 4 years) |
| Growth in single-person and senior households adopting companion animals | +0.8% | National, concentrated in metropolitan areas | Medium term (2-4 years) |
| E-commerce expansion enabling direct-to-consumer brands | +0.9% | National, with rural penetration advantages | Short term (≤ 2 years) |
| Functional ingredients focus | +0.7% | National, veterinary-driven adoption | Medium term (2-4 years) |
| Circular-economy sourcing of insect and up-cycled proteins | +0.4% | National, early adopter segments | Long term (≥ 4 years) |
| Veterinary endorsement programs boosting therapeutic diets | +0.6% | National, clinical channel focus | Medium term (2-4 years) |
| Source: Mordor Intelligence | |||
Humanization of pets elevating demand for premium food
Pet owners increasingly insist on human-grade recipes, transparent sourcing, and functional benefits, lifting average unit prices across the United Kingdom pet food market. Organic, grain-free, single-protein, and locally produced lines resonate with health-minded consumers. Premium brands leverage small-batch narratives and science-backed claims to justify price premiums. Subscription models bolster retention by automating replenishment and offering tailored diet plans. Manufacturers that sustain ingredient integrity while communicating clear welfare credentials build lasting competitive moats[1]Source: FEDIAF, “Annual Review 2024,” europeanpetfood.org.
Growth in single-person and senior households adopting companion animals
Single residents and retirees adopt pets for companionship, which sustains volume growth even when birth rates stagnate. These demographics embrace portion-controlled packs and auto-replenishment to minimize store trips. Seniors gravitate toward diets that support joint, weight, and cognitive health for aging pets, fueling demand for veterinarian-endorsed products. Urban single owners value convenience, prompting brands to launch easy-open cans and lightweight pouches that fit compact living spaces. The spending stability of retirees cushions premium categories during economic stress.
E-commerce expansion enabling direct-to-consumer brands
Online sales outpace physical outlets as shoppers seek assortment breadth, price transparency, and doorstep delivery. Digital-native entrants bypass shelf-space battles, deploy targeted advertising, and use first-party data to refine formulas. Rapid fulfillment networks now reach rural communities once underserved by specialty stores, broadening access across the entire United Kingdom pet food market. Incumbents counter with omnichannel loyalty programs and click-and-collect services. Competitive pricing online pressures gross margins, but subscription bundles improve lifetime value.
Functional ingredients focus
Demand extends beyond calories to proactive wellness. Probiotics, omega-3 oils, glucosamine, and adaptogenic botanicals appear in premium kibble and treats. Clinical trials conducted with local universities underpin on-pack claims, building trust with veterinarians who act as gatekeepers for therapeutic diets. The resulting halo effect lifts adjacent categories, including pet supplements and fortified toppers. Ingredient suppliers invest in novel extraction technologies to meet formulation purity standards, aligning with food safety rules from Food Standards Scotland.
Restraints Impact Analysis*
| Restraint | (~) % Impact on CAGR Forecast | Geographic Relevance | Impact Timeline |
|---|---|---|---|
| Cost-of-living pressure shifting buyers to economy brands | -0.9% | National, with higher impact in lower-income regions | Short term (≤ 2 years) |
| Post-Brexit regulatory divergence raising import costs | -0.6% | National, affecting import-dependent manufacturers | Medium term (2-4 years) |
| Sustainability scrutiny on meat-based carbon footprint | -0.4% | National, driven by environmental regulations | Long term (≥ 4 years) |
| Retail consolidation squeezing smaller brand shelf space | -0.5% | National, affecting independent retailers | Medium term (2-4 years) |
| Source: Mordor Intelligence | |||
Cost-of-living pressure shifting buyers to economy brands
Inflation compresses disposable income, prompting households to trade down within the United Kingdom pet food market. Private-label lines gain share because supermarkets negotiate volume discounts and pass savings through. Premium players introduce value extensions or smaller packs to retain price-sensitive users. While substitution from premium to mid-tier slows revenue per kilogram, consistent pet ownership levels buffer overall volume. Treat purchases become more occasional, creating uneven demand swings across subcategories[2]Source: UK Pet Food, “Market Data,” ukpetfood.org.
Post-Brexit regulatory divergence raising import costs
Export Health Certificates, veterinary inspections, and divergent labeling rules add delays and fees on ingredients sourced from the European Union. Documentation requirements multiply administrative work, especially for small exporters. Currency volatility compounds raw-material cost spikes, forcing manufacturers to hedge or raise prices. Some producers reshore or source ingredients from domestic farms, yet capacity constraints limit rapid pivots. Dual compliance strategies for United Kingdom and European Union markets inflate overhead.
*Our forecasts treat driver/restraint impacts as directional, not additive. The impact forecasts reflect baseline growth, mix effects, and variable interactions.
Segment Analysis
By Pet Food Product: Premium treats accelerate category expansion
Food retained the largest 71.62% share of the United Kingdom pet food market size in 2025 and continues to anchor household purchasing cycles. Dry kibble dominates for convenience, price, and dental benefits, yet wet formulations gain traction among owners seeking higher palatability and moisture. Manufacturers diversify protein sources within both formats to hedge raw-material risk and respond to allergen concerns. Pet treats, while accounting for a smaller base, posts the swiftest 5.55% CAGR, fueled by training, bonding rituals, and functional snacking that blur the line between feed and supplement. Formulators embed joint, digestive, and skin support ingredients to command price premiums.
Growing demand for therapeutic and fortified solutions elevates pet nutraceuticals and supplements. Owners frequently supplement base diets with omega oils, multivitamins, and probiotic chews on veterinary advice, lifting average spending per pet. Pet veterinary diets occupy a specialized niche with high margins because prescriptions must follow clinical diagnosis. Although volume remains limited, rising incidences of obesity and chronic disease among the aging pet population underpin steady growth. The United Kingdom pet food market share for therapeutic diets is projected to widen as clinic recommendations increase and e-commerce platforms simplify refill ordering.


By Pets: Canine ownership drives premium outlay
Dogs commanded 43.62% of the United Kingdom pet food market share in 2025 and show the strongest 5.32% CAGR outlook, reflecting the cultural affinity for canine companionship across urban and rural regions. Canine owners typically purchase larger pack sizes and multiple treat formats, raising basket values. Breed diversification encourages targeted formulas for small, medium, and large breeds, each with varying protein and calorie needs. Personalized diet quizzes and DNA-based customization emerge online, resonating with tech-savvy owners seeking precision nutrition.
Cats follow as the second-largest segment, and despite lower quantity per purchase, wet food preferences elevate per-kilogram prices. Indoor lifestyles spur demand for weight management and hairball control recipes. Feline owners also buy litter and accessories from the same retailers, presenting cross-sell potential for e-commerce platforms. Other Pets, including rabbits, birds, and reptiles, represent a small yet loyal customer group. Specialized pellets and seed blends cater to species-specific nutritional needs, offering attractive margins unmatched by commoditized dog and cat lines within the United Kingdom pet food market.
By Distribution Channel: Digital disruption reshapes market access
Supermarkets and hypermarkets delivered 33.28% of 2025 sales through nationwide networks, parking convenience, and one-stop shopping missions. Promotional flyers and loyalty points keep traffic steady, and private-label ranges shield against price wars. Shelf resets feature clearer navigation between life stages, protein sources, and functional claims to accelerate discovery. Online channel, projected to expand at 6.12% CAGR by 2031, erodes that dominance. Online marketplaces and brand webstores excel at assortment breadth, auto-ship services, and data-driven bundling strategies.
Specialty Stores thrive on expert staff, tailored advice, and frequent shopper programs, supporting discovery of premium and niche products. They anchor community engagement events that deepen brand loyalty. Convenience Stores supply emergency top-ups, especially in dense urban corridors where storage space is scarce. Veterinarian clinics maintain critical influence over prescription diet compliance, yet pending regulatory scrutiny of vertical integration may reshape product flow, diversifying availability through independent retail partners.
Geography Analysis
London and the Southeast generate the highest contribution to the United Kingdom pet food market size, underpinned by dense population, higher disposable income, and early adoption of premium and subscription services. Urban dwellers display elevated willingness to pay for grain-free formulations and home delivery. The region also hosts many start-ups that pioneer insect protein treats and personalized meal plans, stimulated by proximity to venture funding.
Northern England, including Yorkshire and the Northwest, benefits from a deep manufacturing base and abundant warehousing, reducing freight costs for local brands. Employment in the pet food cluster supports community income, reinforcing regional loyalty to domestic labels. Suburban families favor economy multipacks, though pockets of affluence sustain premium dry and mixed feeding patterns. Digital penetration accelerates, with next-day delivery becoming standard outside metropolitan postcodes.
Scotland, Wales, and Northern Ireland compose smaller but strategically important markets. Scotland’s regulatory oversight by Food Standards Scotland maintains robust safety controls while encouraging innovation. Rural households show loyalty to working dog lines and energy-dense kibble. Wales sees growing demand for eco-friendly packaging as local councils tighten recycling mandates. Northern Ireland offers a conduit to European Union markets by virtue of the Windsor Framework arrangements, yet also faces unique customs checks. Tailoring assortments to these regional nuances will remain critical for brands seeking balanced national coverage within the United Kingdom pet food market.
Competitive Landscape
The market is low concentrated, with the top five players controlling just a good share of value sales. Mars Incorporated and Nestlé Purina leverage multi-brand portfolios, heavy advertising, and in-house veterinary research to maintain category leadership. Nestlé’s USD 190.5 million (GBP 150 million) upgrade of its Wisbech factory expands wet food capacity, secures domestic employment, and shortens lead times[3]Source: UK Pet Food, “Member Directory,” ukpetfood.org. Mars adopts a dual strategy of heritage recipes and science-based offshoots, such as gastrointestinal formulas developed in collaboration with veterinary schools.
Inspired Pet Nutrition’s USD 54.6 million purchase of Butcher’s Pet Care creates a combined entity with USD 444.5 million turnover, enhancing vertical integration from canning to distribution. Pets at Home capitalizes on its retail footprint and veterinary clinics, posting USD 1.69 billion retail revenue and USD 187 million veterinary revenue in 2024, though currency headwinds narrow margins. Challenger brands such as HOWND and Yora differentiate by vegan or insect protein formulas, tapping sustainability-focused owners.
Private-label ranges gain scale as grocery chains lock in exclusivity agreements. Ingredient specialists like Alltech partner with formulators to supply yeast derivatives and post-biotics that drive functional claims. As capital inflows gravitate toward sustainable and tech-enabled ventures, direct-to-consumer entrants experiment with data-driven custom diets, threatening shelf incumbents. Regulatory moves by the Competition and Markets Authority and the Veterinary Medicines Directorate may alter margin structures, making agility crucial in the evolving United Kingdom pet food market.
United Kingdom Pet Food Industry Leaders
Colgate-Palmolive Company (Hill's Pet Nutrition Inc.)
Mars Incorporated
Nestle (Purina)
Schell & Kampeter Inc. (Diamond Pet Foods)
Farmina Pet Foods
- *Disclaimer: Major Players sorted in no particular order

Recent Industry Developments
- July 2024: Pets Choice acquired HOWND, a premium vegan dog food brand, to expand its presence in the fast-growing plant-based pet food segment and strengthen its sustainability credentials. The acquisition enhances Pets Choice's portfolio of natural and premium brands while providing access to the growing market for alternative protein sources and environmentally conscious pet nutrition solutions.
- July 2023: Hill's Pet Nutrition introduced its new MSC (Marine Stewardship Council) certified pollock and insect protein products for pets with sensitive stomachs and skin lines. They contain vitamins, omega-3 fatty acids, and antioxidants.
- May 2023: Nestle Purina launched new cat treats under the Friskies "Friskies Playfuls - treats" brand. These treats are round in shape and are available in chicken and liver and salmon and shrimp flavors for adult cats.


United Kingdom Pet Food Market Report Scope
Food, Pet Nutraceuticals/Supplements, Pet Treats, Pet Veterinary Diets are covered as segments by Pet Food Product. Cats, Dogs are covered as segments by Pets. Convenience Stores, Online Channel, Specialty Stores, Supermarkets/Hypermarkets are covered as segments by Distribution Channel.Pet Food Product
| Food | By Sub Product | Dry Pet Food | By Sub Dry Pet Food | Kibbles |
| Other Dry Pet Food | ||||
| Wet Pet Food | ||||
| Pet Nutraceuticals/Supplements | By Sub Product | Milk Bioactives | ||
| Omega-3 Fatty Acids | ||||
| Probiotics | ||||
| Proteins and Peptides | ||||
| Vitamins and Minerals | ||||
| Other Nutraceuticals | ||||
| Pet Treats | By Sub Product | Crunchy Treats | ||
| Dental Treats | ||||
| Freeze-dried and Jerky Treats | ||||
| Soft & Chewy Treats | ||||
| Other Treats | ||||
| Pet Veterinary Diets | By Sub Product | Derma Diets | ||
| Diabetes | ||||
| Digestive Sensitivity | ||||
| Obesity Diets | ||||
| Oral Care Diets | ||||
| Renal | ||||
| Urinary tract disease | ||||
| Other Veterinary Diets |
Pets
| Cats |
| Dogs |
| Other Pets |
Distribution Channel
| Convenience Stores |
| Online Channel |
| Specialty Stores |
| Supermarkets/Hypermarkets |
| Other Channels |
| Pet Food Product | Food | By Sub Product | Dry Pet Food | By Sub Dry Pet Food | Kibbles |
| Other Dry Pet Food | |||||
| Wet Pet Food | |||||
| Pet Nutraceuticals/Supplements | By Sub Product | Milk Bioactives | |||
| Omega-3 Fatty Acids | |||||
| Probiotics | |||||
| Proteins and Peptides | |||||
| Vitamins and Minerals | |||||
| Other Nutraceuticals | |||||
| Pet Treats | By Sub Product | Crunchy Treats | |||
| Dental Treats | |||||
| Freeze-dried and Jerky Treats | |||||
| Soft & Chewy Treats | |||||
| Other Treats | |||||
| Pet Veterinary Diets | By Sub Product | Derma Diets | |||
| Diabetes | |||||
| Digestive Sensitivity | |||||
| Obesity Diets | |||||
| Oral Care Diets | |||||
| Renal | |||||
| Urinary tract disease | |||||
| Other Veterinary Diets | |||||
| Pets | Cats | ||||
| Dogs | |||||
| Other Pets | |||||
| Distribution Channel | Convenience Stores | ||||
| Online Channel | |||||
| Specialty Stores | |||||
| Supermarkets/Hypermarkets | |||||
| Other Channels | |||||


Market Definition
- FUNCTIONS - Pet foods are usually intended to provide complete and balanced nutrition to the pet but are primarily used as functional products. The scope includes the food and supplements consumed by pets including veterinary diets. Supplements/nutraceuticals that are directly supplied to pets are considered within the scope.
- RESELLERS - Companies engaged in reselling of pet food without value addition have been excluded from the market scope, in order to avoid double counting.
- END CONSUMERS - Pet owners are considered to be the end-consumers in the market studied.
- DISTRIBUTION CHANNELS - Supermarkets/hypermarkets, specialty stores, convenience stores, online channels and other channels are considered within the scope. The stores which are exclusively providing pet related basic and custom products are considered within the scope of specialty stores.
| Keyword | Definition |
|---|---|
| Pet Food | The scope of pet food includes the food that is eatable by pets including food, treats, veterinary diets, and nutraceuticals/supplements. |
| Food | Food is animal feed intended for consumption by pets. It is formulated to provide essential nutrients and meet the dietary needs of various types of pets, including dogs, cats, and other animals. These are generally segmented into dry and wet pet foods. |
| Dry Pet Food | Dry pet foods may be extruded/baked (kibbles) or flaked. They have a lower moisture content, typically around 12-20%. |
| Wet Pet Food | Wet pet food, also known as canned pet food or moist pet food, generally has a higher moisture content compared to dry pet food, often ranging from 70-80%. |
| Kibbles | Kibbles are dry, processed pet food in small, bite-sized pieces or pellets. They are specifically formulated to provide balanced nutrition for various domestic animals, such as dogs, cats, and other animals. |
| Treats | Pet Treats are special food items or rewards given to pets, to show affection, and encourage good behavior. They are especially used during training. Pet treats are made from various combinations of meat or meat-derived materials with other ingredients. |
| Dental Treats | Pet dental treats are specialized treats that are formulated to promote good oral hygiene in pets. |
| Crunchy Treats | It is a type of pet treat that has a firm and crispy texture which can be a good source of nutrition for pets. |
| Soft and chewy treats | Soft and Chewy pet treats are a type of pet food product that is formulated to be easy to chewy and digest. They are usually made from soft and pliable ingredients, such as meat, poultry, or vegetables, that have been blended and formed into bite-sized pieces or strips. |
| Freeze-dried & Jerky Treats | Freeze-dried and jerky treats are snacks given to pets, that are prepared through a special preservation process, without damaging the nutritional content, resulting in long-lasting, nutrient-rich treats. |
| Urinary Tract Disease Diets | These are commercial diets that are specifically formulated to promote urinary health and reduce the risk of urinary tract infections and other urinary problems. |
| Renal Diets | These are specialized pet foods formulated to support the health of pets with kidney disease or renal insufficiency. |
| Digestive Sensitivity Diets | Digestive-sensitive diets are specially formulated to meet the nutritional needs of pets with digestive issues such as food intolerances, allergies, and sensitivities. These diets are designed to be easily digestible and to reduce the symptoms of digestive problems in pets. |
| Oral Care Diets | Oral care diets for pets are specially formulated diets produced to promote oral health and hygiene in pets. |
| Grain-Free Pet Food | Pet food that does not contain common grains like wheat, corn, or soy. Grain-free diets are often preferred by pet owners seeking alternative options or if their pets have specific dietary sensitivities. |
| Premium Pet Food | High-quality pet food formulated with superior ingredients often offers additional nutritional benefits compared to standard pet food. |
| Natural Pet Food | Pet food made from natural ingredients, with minimal processing and without artificial preservatives. |
| Organic Pet Food | Pet food is produced using organic ingredients, free from synthetic pesticides, hormones, and genetically modified organisms (GMOs). |
| Extrusion | A manufacturing process used to produce dry pet food, where ingredients are cooked, mixed, and shaped under high pressure and temperature. |
| Other Pets | Other pets include birds, fish, rabbits, hamsters, ferrets, and reptiles. |
| Palatability | The taste, texture, and aroma of pet food influence its appeal and acceptance by pets. |
| Complete and Balanced Pet Food | Pet food that provides all essential nutrients in appropriate proportions to meet the nutritional needs of pets without additional supplementation. |
| Preservatives | These are the substances that are added to pet food to extend its shelf life and prevent spoilage. |
| Nutraceuticals | Food products that offer health benefits beyond basic nutrition, often contain bioactive compounds with potential therapeutic effects. |
| Probiotics | Live beneficial bacteria that promote a healthy balance of gut flora, supporting digestive health and immune function in pets. |
| Antioxidants | Compounds that help neutralize harmful free radicals in the body, promoting cellular health and supporting the immune system in pets. |
| Shelf-Life | The duration of which pet food remains safe and nutritionally viable for consumption after its production date. |
| Prescription diet | Specialized pet food formulated to address specific medical conditions under veterinary supervision. |
| Allergen | A substance that can cause allergic reactions in some pets, leading to food allergies or sensitivities. |
| Canned food | Wet pet food that is packed in cans and contains higher moisture content than dry food. |
| Limited ingredient diet (LID) | Pet food formulated with a reduced number of ingredients to minimize potential allergens. |
| Guaranteed Analysis | The minimum or maximum levels of certain nutrients present in pet food. |
| Weight management | Pet food designed to help pets maintain a healthy weight or support weight loss efforts. |
| Other Nutraceuticals | It includes prebiotics, antioxidants, digestive fiber, enzymes, essential oils and herbs. |
| Other Veterinary Diets | It includes weight management diets, skin and coat health, cardiac care, and joint care. |
| Other Treats | It includes rawhides, mineral blocks, lickables, and catnips. |
| Other Dry Foods | It includes cereal flakes, mixers, meal toppers, freeze-dried foods, and air-dried foods. |
| Other Animals | It includes birds, fish, reptiles, and small animals (rabbits, ferrets, hamsters). |
| Other Distribution Channels | It includes veterinary clinics, local unregulated stores, and feed and farm stores. |
| Proteins and Peptides | Proteins are large molecules composed of basic units called amino acids which help in the growth and development of pets. Peptides are the short string of 2 to 50 amino acids. |
| Omega-3 fatty acids | Omega-3 fatty acids are essential polyunsaturated fats that play a crucial role in the overall health and well-being of Pets |
| Vitamins | Vitamins are the essential organic compounds that are essential for vital physiological functioning. |
| Minerals | Minerals are naturally occurring inorganic substances that are essential for various physiological functions in pets. |
| CKD | Chronic Kidney Disease |
| DHA | Docosahexaenoic Acid |
| EPA | Eicosapentaenoic Acid |
| ALA | Alpha-linolenic Acid |
| BHA | Butylated Hydroxyanisol |
| BHT | Butylated Hydroxytoluene |
| FLUTD | Feline Lower Urinary Tract Disease |


Research Methodology
Mordor Intelligence follows a four-step methodology in all our reports.
- Step-1: IDENTIFY KEY VARIABLES: In order to build a robust forecasting methodology, the variables and factors identified in Step-1 are tested against available historical market numbers. Through an iterative process, the variables required for market forecast are set and the model is built on the basis of these variables.
- Step-2: Build a Market Model: Market-size estimations for the forecast years are in nominal terms. Inflation is not a part of the pricing, and the average selling price (ASP) is kept constant throughout the forecast period.
- Step-3: Validate and Finalize: In this important step, all market numbers, variables and analyst calls are validated through an extensive network of primary research experts from the market studied. The respondents are selected across levels and functions to generate a holistic picture of the market studied.
- Step-4: Research Outputs: Syndicated Reports, Custom Consulting Assignments, Databases & Subscription Platforms


