Ultraviolet Disinfection Equipment Market Size and Share
Market Overview
| Study Period | 2021 - 2031 |
|---|---|
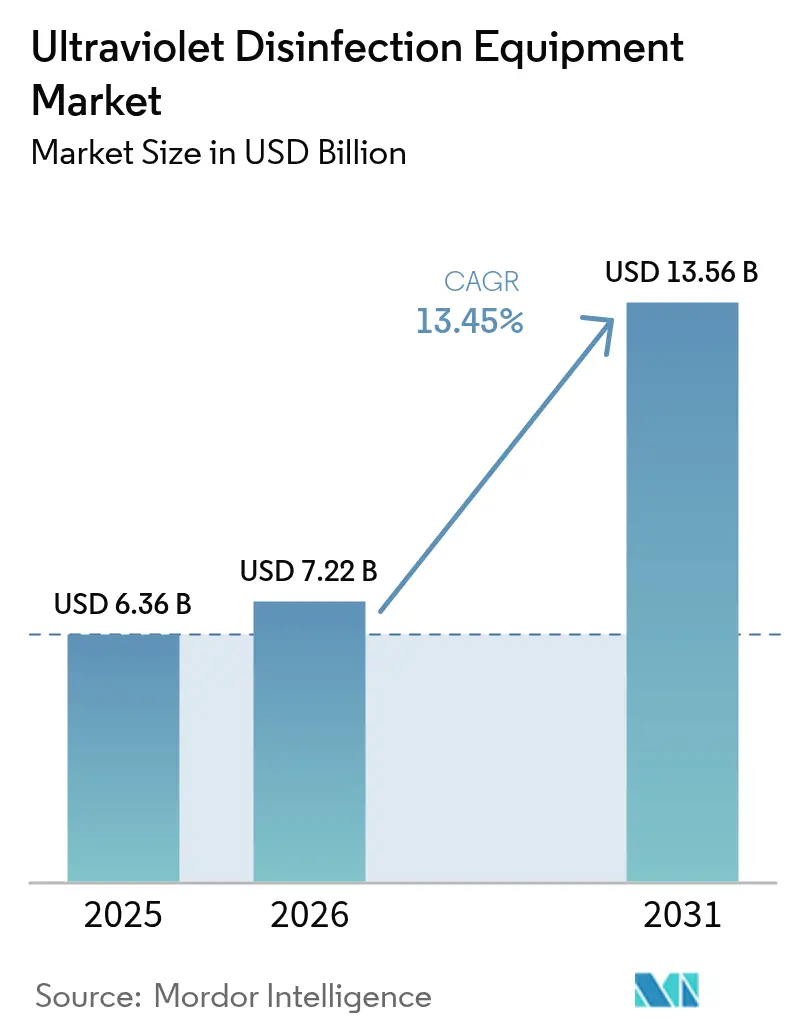
| Market Size (2026) | USD 7.22 Billion |
| Market Size (2031) | USD 13.56 Billion |
| Growth Rate (2026 - 2031) | 13.45% CAGR |
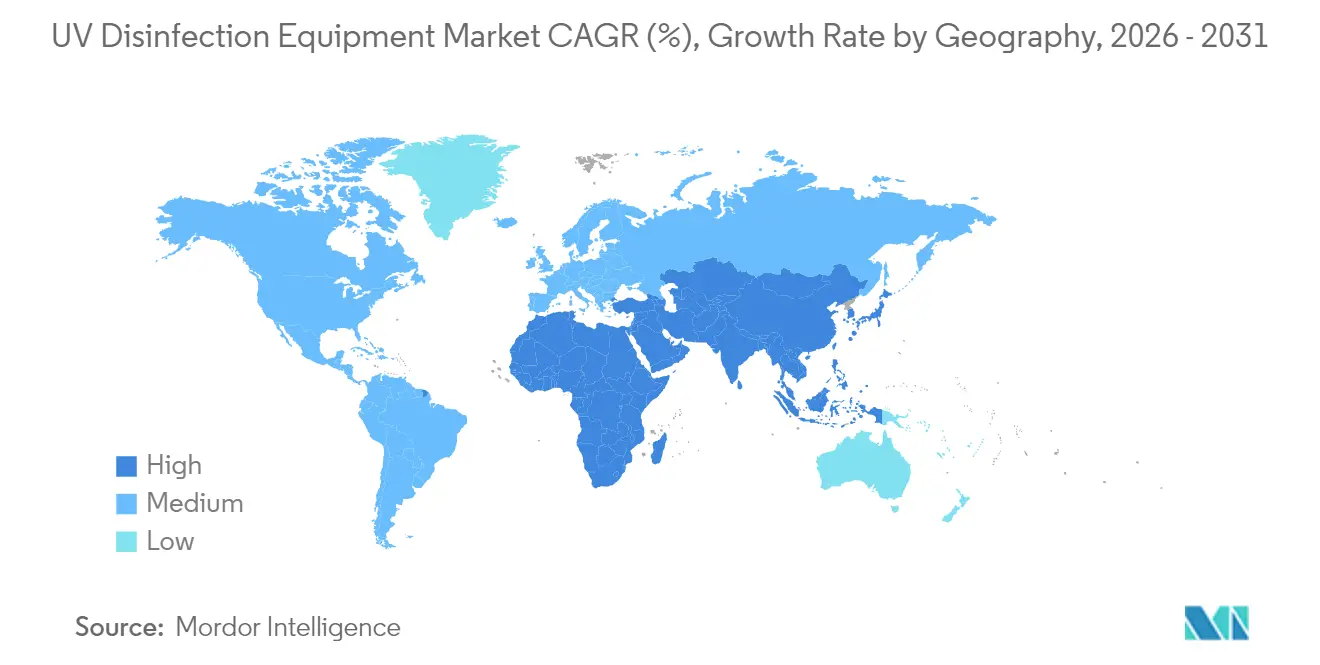
| Fastest Growing Market | Asia Pacific |
| Largest Market | Asia Pacific |
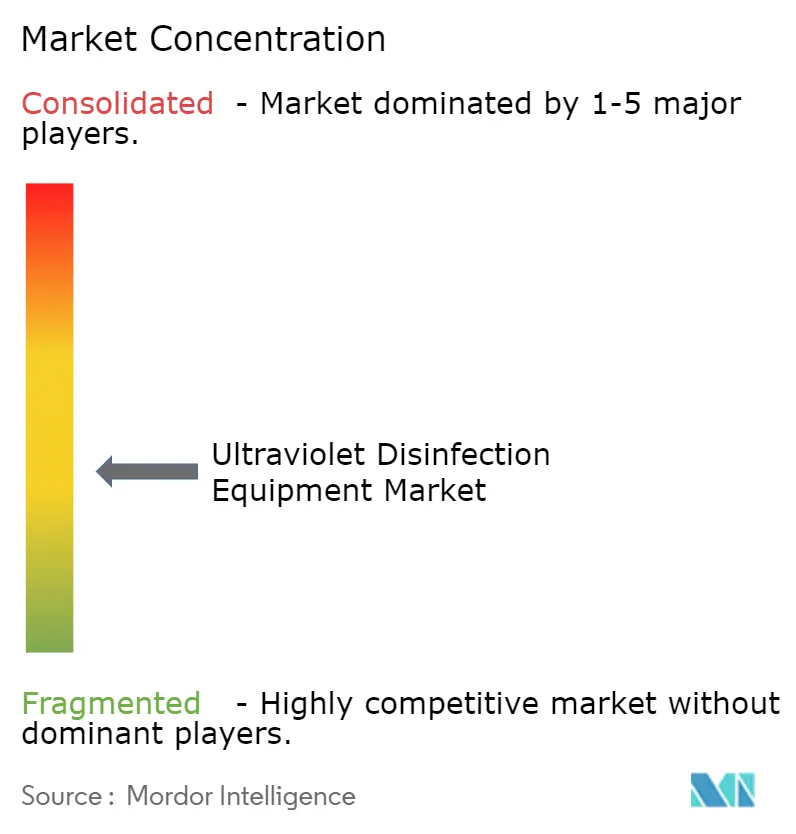
| Market Concentration | Medium |
Major Players
*Disclaimer: Major Players sorted in no particular order Image © Mordor Intelligence. Reuse requires attribution under CC BY 4.0. |
|
Ultraviolet Disinfection Equipment Market Analysis by Mordor Intelligence
The Ultraviolet disinfection equipment market size is expected to grow from USD 6.36 billion in 2025 to USD 7.22 billion in 2026 and is forecast to reach USD 13.56 billion by 2031 at 13.45% CAGR over 2026-2031. Heightened global concerns about chemical-free disinfection, tightening PFAS and DBP standards, and rapid UV-C LED cost declines are reinforcing long-run demand. Far-UVC research is widening the technology’s addressable space, while vertical integration across the semiconductor supply chain is emerging as a decisive competitive edge. Meanwhile, service-based revenue models are gaining traction as utilities and hospitals prioritize predictable lifecycle costs. These simultaneous shifts point to a structurally larger addressable pool for the Ultraviolet disinfection equipment market across municipal utilities, healthcare facilities, and commercial real estate.
Key Report Takeaways
- By component, UV Lamps retained 57.35% of the Ultraviolet disinfection equipment market share in 2025; UV-C LED systems deliver the fastest growth at an 17.65% CAGR through 2031.
- By power rating, medium-power units (10-999 kW) led with 48.20% revenue share in 2025, while low-power units (<10 kW) are expanding at a 12.35% CAGR to 2031.
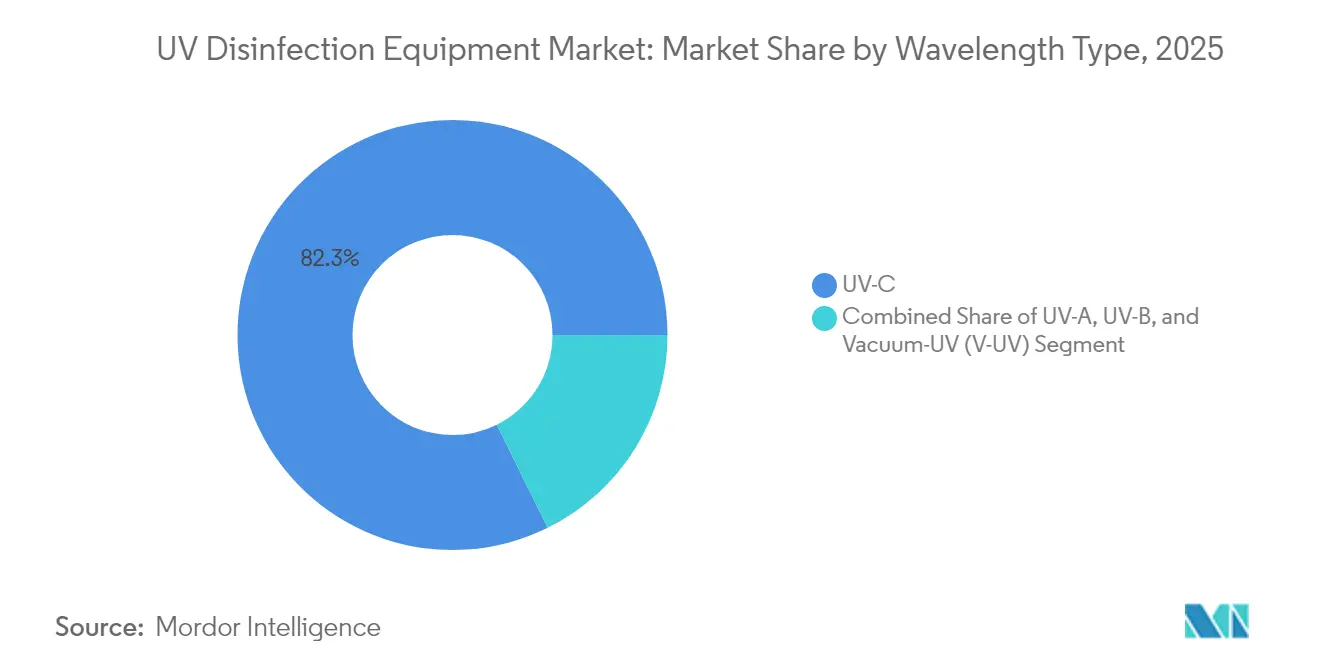
- By wavelength, UV-C held 82.30% share of the Ultraviolet disinfection equipment market size in 2025; vacuum-UV solutions are projected to compound at 18.55% to 2031.
- By mobility, fixed installations commanded 65.10% of 2025 revenue, whereas portable towers post the highest CAGR at 15.05% through 2031.
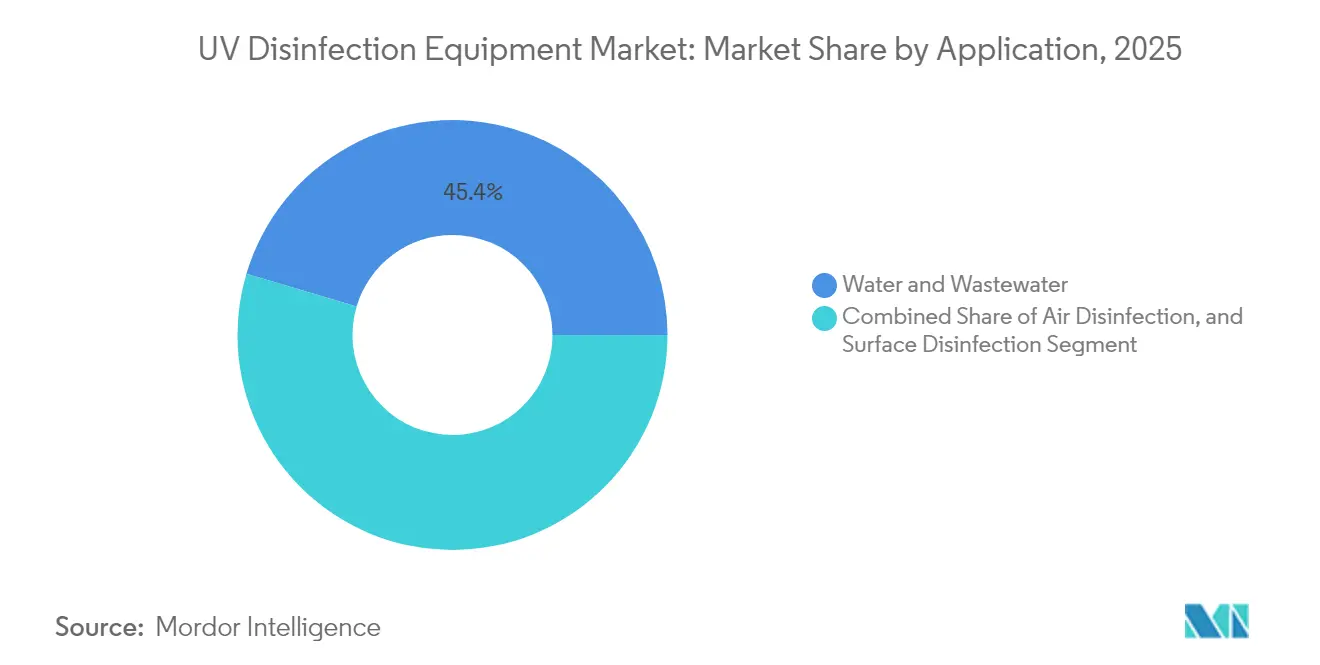
- By application, water and wastewater solutions represented 45.40% of the Ultraviolet disinfection equipment market in 2025; air disinfection systems are poised for a 13.7% CAGR.
- By end-user, municipal utilities generated 37.40% of 2025 revenue; healthcare institutions are the fastest riser at 12.05% CAGR across 2026-2031.
- By geography, Asia Pacific accounted for a 33.60% share of the Ultraviolet disinfection equipment market in 2025, and it is set to expand at an 10.95% CAGR during the forecast horizon.
Note: Market size and forecast figures in this report are generated using Mordor Intelligence’s proprietary estimation framework, updated with the latest available data and insights as of 2026.
Global Ultraviolet Disinfection Equipment Market Trends and Insights
Drivers Impact Analysis*
| Driver | (~) % Impact on CAGR Forecast | Geographic Relevance | Impact Timeline |
|---|---|---|---|
| PFAS & DBP regulations in municipal water | +4.8% | North America & EU | Medium term (2-4 years) |
| UV-C LED retrofits in commercial HVAC | +3.4% | North America & Asia Pacific | Short term (≤ 2 years) |
| Zero-chemical mandates in food & beverage | +2.7% | Global | Medium term (2-4 years) |
| Water-reuse projects in GCC economies | +2.1% | Middle East | Long term (≥ 4 years) |
| Infection-control spending in Western Europe | +1.4% | Europe | Short term (≤ 2 years) |
| Source: Mordor Intelligence | |||
Stricter PFAS & DBP Regulations Accelerating UV Adoption in Municipal Drinking-Water
New PFAS limits finalized by the United States Environmental Protection Agency and parallel European moves are forcing utilities to seek advanced oxidation processes that do not increase chemical residuals. UV-based AOP trains deliver up to 99% PFAS removal and concurrently suppress chlorine demand, lowering trihalomethane formation by 37% at the Sweeney Water Treatment Plant. These dual-compliance benefits, together with falling LED prices, are scaling procurement pipelines.
Rapid Uptake of UV-C LED Retrofit Modules in Commercial HVAC
Demand-controlled ventilation strategies now pair instant-on UV-C LEDs with smart building systems. Coil efficiency gains of 10-20%, documented payback periods under 24 months, and 90% airborne pathogen reductions are propelling adoption in the United States and Japan.[1]Hydronics Hub, “Monitoring UV-C Disinfection for HVAC Efficiency/Energy Savings,” hydronicshub.comBuilding owners value low lifecycle costs and easier maintenance versus mercury lamps.
Rising Zero-Chemical Mandates by Food & Beverage Majors
Global food processors targeting residue-free operations before 2028 are deploying UV-C for surface, air, and process-water treatment. Three-log pathogen reductions and two-day shelf-life extensions were recorded in ready-to-eat lines without moisture or chemicals that support microbial regrowth.[2]Patras A. et al., “UV-C Inactivation of Microorganisms in Droplets on Food Contact Surfaces,” Frontiers in Food Science and Technology, frontiersin.orgThis driver adds direct equipment demand and recurring service opportunities.
Hospital Infection-Control Spending Surge in Western Europe
Western European hospitals face antibiotic resistance pressures and staffing constraints. UV-C room devices reduce healthcare-associated infections by up to 30% and cut cleaning labor, generating annual savings of roughly EUR 605 per bed. Procurement frameworks now include UV as standard for isolation wards, driving steady equipment replacement cycles.
Restraints Impact Analysis*
| Restraint | (~) % Impact on CAGR Forecast | Geographic Relevance | Impact Timeline |
|---|---|---|---|
| High USD/mW Cost of Deep-UV LEDs vs. Low-Pressure Mercury Lamps | -2.7% | Global | Medium term (2-4 years) |
| Shadowing & Turbidity Challenges in Industrial Wastewater | -2.1% | Global, with higher impact in Asia Pacific | Short term (≤ 2 years) |
| Minamata-Driven Phase-out Complexity for Legacy Hg-Lamp Stock | -1.8% | Global | Medium term (2-4 years) |
| Fragmented Certification Standards in ASEAN | -1.2% | Asia Pacific | Long term (≥ 4 years) |
| Source: Mordor Intelligence | |||
High USD/mW Cost of Deep-UV LEDs vs. Low-Pressure Mercury Lamps
Average wall-plug efficiency for deep-UV LEDs trails mercury sources, inflating capital outlays for high-flow installations. The differential exceeds 300% in some municipal projects, delaying large-scale LED rollouts. Annual efficiency gains near 20% and escalating mercury restrictions are narrowing the gap, yet economic parity is unlikely before 2027, constraining the Ultraviolet disinfection equipment market in cost-sensitive segments.
Shadowing and Turbidity Challenges in Industrial Wastewater
High suspended solids and color frequently shield microbes from UV exposure, reducing log inactivation rates by 30-50% in industrial streams versus municipal water.[4]Sun W. et al., “Ultraviolet Technology Application in Urban Water Supply and Wastewater Treatment in China,” Water Research X, doi.orgExtensive pre-treatment or oversized reactors raise costs, limiting uptake in textiles and petrochemicals where conditions fluctuate widely.
*Our forecasts treat driver/restraint impacts as directional, not additive. The impact forecasts reflect baseline growth, mix effects, and variable interactions.
Segment Analysis
By Component: UV-C LEDs Disrupting Traditional Lamp Dominance
The Ultraviolet disinfection equipment market size for components stood at USD 4.19 billion in 2025, with UV Lamps securing 57.35% of revenue. Solid-state UV-C LED systems, however, are compounding at 17.65% and eroding lamp dominance by removing mercury, shortening warm-up time, and integrating seamlessly with IoT-enabled controls. The Ultraviolet disinfection equipment market share of LED units is on course to exceed 25% by 2031 as cost curves improve. Auxiliary sensors are rising in importance, providing real-time irradiance verification that satisfies tightening audit trails. Reactor chambers now leverage optimized hydraulics and advanced quartz coatings to mitigate shadowing, while smart ballasts enable predictive maintenance that lowers lifecycle costs by 25%.
Complementing these shifts, vertically integrated suppliers bundle LED engines, drivers, and monitoring software into single-OEM packages, making procurement easier for smaller utilities. Capital allocations are also moving from upfront equipment to multiyear service agreements that combine hardware refresh, sensor calibration, and analytics under one fee. This favours manufacturers with field-service networks and cloud support platforms.


By Power Rating: Low-Power Systems Gaining Momentum
Medium-power assemblies (10-999 kW) generated the bulk of installations in 2024, but low-power systems beneath 10 kW are expanding rapidly in residences, dental clinics, and point-of-use devices. Instant-on LEDs suit intermittent duty cycles, lowering energy use and room-by-room disinfection deployments. Meanwhile, high-power reactors above 1 MW remain indispensable for mega-plants yet face limited green-field prospects in saturated OECD markets. In developing economies, urban growth still supports steady medium-power demand, though decentralised treatment pilots are starting to divert incremental capital toward clustered low-power nodes.
Technology roadmaps reveal that next-generation LED chips can achieve 180 mW optical power at reduced cost, letting manufacturers reconfigure smaller arrays into flexible cartridge formats. Such cartridges simplify field replacement and slash downtime, an attractive proposition for hospitality chains and small hospitals. As a result, service models charging per-operating-hour rather than per-unit are expected to accelerate low-power unit penetration during 2026-2031.
By Wavelength Type: Vacuum-UV Emerging as Disruptive Technology
UV-C wavelengths currently underpin 82.30% of revenue due to decades of empirical performance data and established validated log-credit tables. Yet vacuum-UV systems, emitting below 200 nm, exhibit superior oxidation of recalcitrant organics and are posting the fastest CAGR at 18.55%. Academic studies show enhanced breakdown of micropollutants, encouraging utilities in Japan and Germany to pilot combined UV-C + V-UV reactors for integrated pathogen and chemical control. Far-UVC (200-230 nm) devices add another frontier by inactivating viruses in occupied spaces without damaging human tissue; controlled trials record 98.4% airborne pathogen reduction.
Manufacturers are redesigning reactor geometries to exploit multipass exposure and minimize ozone production. Meanwhile, niche UV-A and UV-B products continue serving photocatalysis and curing lines where disinfection is secondary. This diversified wavelength toolkit strengthens the Ultraviolet disinfection equipment market, letting suppliers match specific contaminants and regulatory endpoints in one modular platform.
By Mobility: Portable Systems Addressing Flexibility Demands
Fixed reactors integrated into pipes, basins, and air-handling units represented 65.10% of 2025 revenue, reflecting the embedded base in municipal and industrial plants. Portable towers, robots, and cart systems, however, enjoy a 15.05% CAGR as hospitals, airlines, and event venues deploy them for spot treatment. Instant-feedback sensors show users dose delivery, building trust and supporting compliance documentation. The Ultraviolet disinfection equipment market size for mobile units reached USD 1.28 billion in 2025 and is poised to double by 2031.
In-duct retrofits offer a hybrid pathway by mounting UV arrays in existing HVAC plenums without major teardown. Retail chains have begun specifying retrofits in lease contracts to standardize indoor-air quality across portfolios. Robotics researchers are exploring autonomous navigation and real-time mapping to extend UV coverage into cluttered spaces, aligning with workforce-shortage trends and infection-control mandates
By Application: Air Disinfection Experiencing Rapid Growth
Water and wastewater treatment remained the core application, capturing 45.40% of 2025 turnover. Persistent regulatory obligations for cryptosporidium removal and PFAS compliance make UV indispensable. Nonetheless, air disinfection units are scaling quickest at 13.7% CAGR, driven by workplace wellness programs, school air-quality grants, and mass-transit upgrades. UV-C LED arrays embedded in supply ducts cut pathogen counts without adding pressure drop, a critical differentiator in energy-constrained retrofits.
Surface disinfection equipment is gaining prominence in electronics assembly, where chemical residues can damage sensitive components. Food processors employ conveyor-mounted UV tunnels to extend shelf life and limit recall risk. Industrial process-water use cases remain robust in pharmaceuticals and microelectronics, which require ultrapure water free of biofilm. Collectively, cross-application synergies reinforce platform vendors that can offer unified control dashboards and standardized spare parts.
By End-user: Healthcare Institutions Leading Adoption
Municipal utilities held 37.40% of spending in 2025, reflecting large-scale fixed assets and regulatory drivers. Hospitals, clinics, and long-term-care facilities clock a 12.05% CAGR as infection-control budgets rise. Peer-reviewed studies measuring 30% HAI reduction and rapid payback invigorate procurement pipelines. Industrial manufacturers adopt UV to support zero-chemical targets, while commercial office owners integrate UV into wellness certifications to attract tenants. Residential and aquaculture niches, though smaller, benefit from compact LED modules that simplify installation and monitoring.
Hospitals are integrating UV into both room disinfection robots and in-line water systems feeding ice machines and endoscopy devices. Insurance carriers in Europe now credit UV deployment in premium calculations, providing an indirect financial incentive. Meanwhile, fish hatcheries report higher survival rates when UV is used to control waterborne pathogens, a promising extension segment.
Geography Analysis
Asia Pacific commanded a 33.60% revenue share in 2025, the highest among all regions, and is projected to grow at an 10.95% CAGR through 2031. China’s 14th Five-Year Plan emphasizes UV investments in tier-two municipalities, and Japan’s leadership in deep-UV semiconductors compresses regional LED costs. India and Australia, facing chronic water scarcity, are scaling potable-reuse projects that embed UV as the primary disinfection barrier. Southeast Asian nations, led by Indonesia and Vietnam, are expanding seafood exports, driving aquaculture UV demand. Collectively, these factors reinforce a broad installation base and spur local manufacturing clusters, ensuring the Ultraviolet disinfection equipment market maintains regional momentum.
North America remains a technologically advanced arena with steady replacement demand. The EPA’s PFAS rule is a critical catalyst, propelling utilities toward UV-AOP combinations. Hospitals in the United States document 30% HAI reductions post-UV deployment, underpinning incremental procurement. Office developers include UV-ready HVAC specifications to meet WELL and LEED standards. Canada’s regulatory harmonization with U.S. PFAS limits will further stimulate cross-border equipment sales. Ongoing infrastructure grants channel public spending to mid-sized municipalities, sustaining medium-power reactor orders.
Europe shows mature penetration but continues to innovate. The revised EU Drinking Water Directive introduces emerging contaminant monitoring, pushing utilities to adopt multi-barrier trains featuring UV. Water-scarce Mediterranean states invest in reuse plants, while Scandinavia pilots Far-UVC systems in public transport. Western European hospitals allocate larger infection-control budgets, and Germany’s industrial sector leverages UV to align with stringent green-chemistry rules. The Middle East and Africa, although smaller, outperform on growth rates due to GCC diversification programs that bundle UV into desalination and district-cooling assets.

Competitive Landscape
The Ultraviolet disinfection equipment market comprises diversified water-technology conglomerates and specialized LED innovators. The top five suppliers collectively hold roughly 45% of global revenue, pointing to moderate concentration. Strategic pivots toward service-centric models are evident as utilities and hospitals request performance guarantees and remote-monitoring dashboards. Xylem’s 2024 acquisition of Evoqua Water Technologies broadened its UV portfolio across municipal and industrial verticals, leveraging cross-selling opportunities. De Nora’s registered Sentinel platform integrates electronic ballasts that trim energy use, and the company reports an 18.8% EBITDA margin in its water segment.
LED-focused entrants such as AquiSense and Silanna UV exploit rising mercury restrictions and semiconductor know-how to undercut lamp incumbents on maintenance costs. AquiSense secured a Series A round to expand full-spectrum products. Vertically integrated LED makers de-risk chip supply and compress lead times, attracting OEM partnerships. Far-UVC pioneers like Uviquity are courting HVAC integrators to bring continuous air disinfection to high-occupancy space.
Innovation themes now center on improving wall-plug efficiency, integrating AI for dose control, and combining UV with membrane or electrodialysis units for multi-contaminant removal. Partnerships between equipment makers and cloud-analytics startups aim to deliver predictive maintenance and regulatory reporting dashboards, thereby locking in annuity-style revenue. Suppliers that pair hardware with data services are expected to capture disproportionate share growth during the forecast window.
Ultraviolet Disinfection Equipment Industry Leaders
-
Xylem Inc.
-
Trojan Technologies
-
Halma PLC
-
Severn Trent Services
-
Nichia Corporation
- *Disclaimer: Major Players sorted in no particular order

Recent Industry Developments
- May 2025: AquiSense Inc. closed a Series A financing round to expand its full-spectrum UV-C LED product line
- May 2025: Uviquity emerged from stealth with USD 6.6 million in seed funding to commercialize semiconductor Far-UVC emitters
- April 2025: De Nora reported H1 2024 water-segment revenue of EUR 400.3 million, noting strong UV disinfection system sales
- March 2025: Blueprint Biosecurity published Far-UVC evidence showing 98.4% airborne pathogen reduction
- February 2025: Germitec received FDA De Novo clearance for Chronos, a 90-second UV-C probe disinfection system


Research Methodology Framework and Report Scope
Market Definitions and Key Coverage
Our study defines the ultraviolet disinfection equipment market as all newly manufactured systems that channel germicidal UV-C or vacuum-UV light (100-254 nm) through engineered chambers, ducts, or portable towers to inactivate microorganisms in water, air, and on hard surfaces. It includes finished reactors, UV lamps or LEDs supplied with housings, quartz sleeves, power/control units, and integrated sensors sold to municipal utilities, healthcare facilities, commercial buildings, industrial plants, and residences during 2024-2030.
Scope Exclusion: Consumables such as replacement lamps, gaskets, and maintenance services are excluded from revenue calculations.
Segmentation Overview
-
By Component
- UV Lamps
- Quartz Sleeves
- Reactor Chambers
- Ballasts and Control Units
- Auxiliary Sensors
-
By Power Rating
- Low-Power ( Less than 10 kW)
- Medium-Power (10-999 kW)
- High-Power (1 MW and Above)
-
By Wavelength Type
- UV-A
- UV-B
- UV-C
- Vacuum-UV (V-UV)
-
By Mobility
- Fixed Systems
- Portable/Mobile Towers
- In-duct Retrofits
-
By Application
-
Water and Wastewater
- Drinking-Water Plants
- Industrial Process Water
- Municipal Wastewater
-
Air Disinfection
- Hospital Rooms and Operating Theatres
- Commercial HVAC and AHU
- Transportation (Aircraft, Rail)
-
Surface Disinfection
- Food and Beverage Processing Lines
- Pharmaceutical Cleanrooms
- Consumer Electronics Assembly
-
Water and Wastewater
-
By End-user
- Municipal Utilities
- Residential
- Commercial Facilities
- Industrial Manufacturing
- Healthcare Institutions
- Aquaculture and Marine
-
By Geography
-
North America
- United States
- Canada
- Mexico
-
Europe
- Germany
- United Kingdom
- France
- Italy
- Spain
- Rest of Europe
-
Asia-Pacific
- China
- Japan
- South Korea
- India
- South East Asia
- Rest of Asia-Pacific
-
South America
- Brazil
- Rest of South America
-
Middle East and Africa
-
Middle East
- United Arab Emirates
- Saudi Arabia
- Rest of Middle East
-
Africa
- South Africa
- Rest of Africa
-
Middle East
-
North America
Detailed Research Methodology and Data Validation
Primary Research
Mordor analysts held structured interviews with UV-system engineers, municipal water supervisors, hospital infection-control heads, and component manufacturers across North America, Europe, and Asia-Pacific. These discussions clarified prevailing average selling prices, lamp-to-LED conversion pace, and typical replacement cycles, allowing us to fine-tune volume assumptions and challenge secondary estimates.
Desk Research
We reviewed open datasets from bodies such as the World Health Organization, United States Environmental Protection Agency, European Centre for Disease Prevention, and UN COMTRADE shipment codes for UV apparatus. Regulatory texts (ISO 22201, NSF/ANSI 55) and trade-association briefs from the International Ultraviolet Association enriched our understanding of efficacy thresholds and installed base trends. Corporate 10-Ks, investor decks, and reputable press articles complemented the evidence, while financials from D&B Hoovers and news filtering via Dow Jones Factiva helped size supplier revenues. This list is illustrative; many additional secondary inputs were consulted for context, cross-checks, and numeric validation.
Market-Sizing & Forecasting
A top-down reconstruction, anchored on global municipal and industrial water disinfection capacity additions, provides the starting demand pool, which is then corroborated with bottom-up supplier roll-ups and channel checks. Key variables like municipal capex on advanced water treatment, hospital bed expansions, UV-C LED penetration rate, median medium-pressure lamp ASP, and regional drinking-water standards feed into a multivariate regression that explains annual equipment uptake. Forecasts to 2030 apply exponential smoothing on these drivers and scenario analysis on regulatory adoption speed; gaps in bottom-up data are bridged with modeled penetration ratios validated by expert feedback.
Data Validation & Update Cycle
Outputs pass three layers of internal review where analysts compare results with import statistics, installation counts, and peer benchmarks. Any anomaly above a predefined tolerance triggers re-contact of sources. Reports refresh each year, and interim updates are issued when material events such as mercury-lamp disposal bans shift market fundamentals.
Why Mordor's Ultraviolet Disinfection Equipment Baseline Commands Confidence
Published estimates often diverge because firms choose different component mixes, pricing ladders, and refresh cadences.
Key gap drivers include whether portable towers or retrofit kits are counted, how fast UV-C LEDs displace mercury lamps, currency conversion dates, and the frequency with which datasets are revisited. By clearly defining scope, using fresh 2025 ASPs, and updating variables annually, Mordor delivers a balanced figure decision-makers can trust.
Benchmark comparison
| Market Size | Anonymized source | Primary gap driver |
|---|---|---|
| USD 6.36 B | Mordor Intelligence | |
| USD 3.87 B | Global Consultancy A | Excludes portable/mobile units and relies on 2022 vendor survey without update |
| USD 4.35 B | Trade Journal B | Uses lower ASP assumptions and omits UV-C LED adoption ramp-up |
| USD 6.06 B | Industry Association C | Includes consumables and refurbishment kits, inflating totals |
The comparison shows that figures shift when scope, price baselines, and component coverage vary. By selecting clear boundaries and refreshing inputs every year, Mordor Intelligence offers a transparent, reproducible baseline that sits at the credible midpoint between conservative and inflated views.


Key Questions Answered in the Report
What is the projected growth rate of the Ultraviolet disinfection equipment market?
The market is forecast to grow at a 13.45% CAGR, climbing from USD 6.36 billion in 2025 to USD 7.22 billion in 2026 and USD 13.56 billion by 2031.
Which component segment is expanding the fastest?
UV-C LED systems exhibit the highest growth, advancing at an 17.65% CAGR due to mercury-free operation and falling semiconductor costs.
How are new PFAS regulations influencing equipment demand?
Stringent PFAS limits are pushing utilities toward UV-based advanced oxidation processes capable of 99% PFAS removal and lower DBP formation, accelerating municipal investment pipelines.
Why are hospitals investing heavily in UV systems?
Peer-reviewed studies show UV-C devices can cut healthcare-associated infections by up to 30% and save roughly EUR 605 per bed each year, making them financially compelling.
What role does Far-UVC play in future market expansion?
Far-UVC wavelengths (200-230 nm) can disinfect occupied spaces safely, with trials demonstrating 98.4% airborne pathogen reduction, opening new opportunities in transportation and commercial buildings.
Which region will contribute the largest incremental revenue by 2031?
Asia Pacific is projected to add the most absolute revenue, supported by urban water infrastructure upgrades, semiconductor manufacturing leadership, and escalating water-reuse investments.
Page last updated on:


