
Market Overview
| Study Period | 2020 - 2031 |
|---|---|
| Forecast Data Period | 2026 - 2031 |
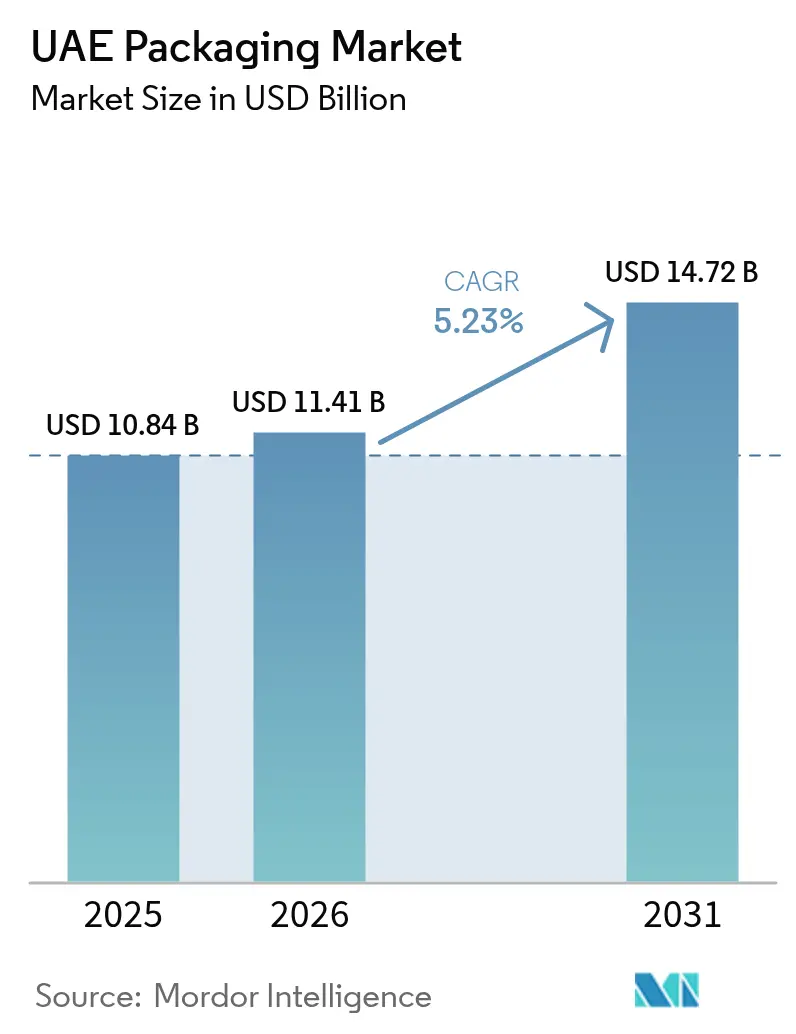
| Base Year Market Size (2025) | USD 10.84 Billion |
| Market Size (2026) | USD 11.41 Billion |
| Market Size (2031) | USD 14.72 Billion |
| Growth Rate (2026 - 2031) | 5.23 % |
| Market Concentration | Medium |
Major Players *Disclaimer: Major Players sorted in no particular order Image © Mordor Intelligence. Reuse requires attribution under CC BY 4.0. | |
UAE Packaging Market Analysis by Mordor Intelligence
The UAE packaging market size was valued at USD 10.84 billion in 2025 and is estimated to grow from USD 11.41 billion in 2026 to reach USD 14.72 billion by 2031, at a CAGR of 5.23% during the forecast period (2026-2031). Amplified manufacturing incentives under Vision 2030, the January 2026 single-use-plastic ban, and the National Food Security Strategy 2051 are combining to reshape the UAE packaging market toward high-barrier, lightweight, and circular formats. E-commerce fulfillment, projected to top USD 9.2 billion in 2026, is pulling corrugated and flexible volumes into micro-flute boxes and stand-up pouches that travel efficiently through last-mile networks. Concurrently, cloud kitchens and on-demand ready-meal services are fragmenting order profiles, accelerating demand for single-portion clamshells and tamper-evident bowls. The interplay of petrochemical integration, bio-based resin investments, and mandatory carbon reporting is steering large converters toward feedstock security, waste-heat recovery, and closed-loop recycling schemes that will define cost leadership in the UAE packaging market over the next decade.
Key Report Takeaways
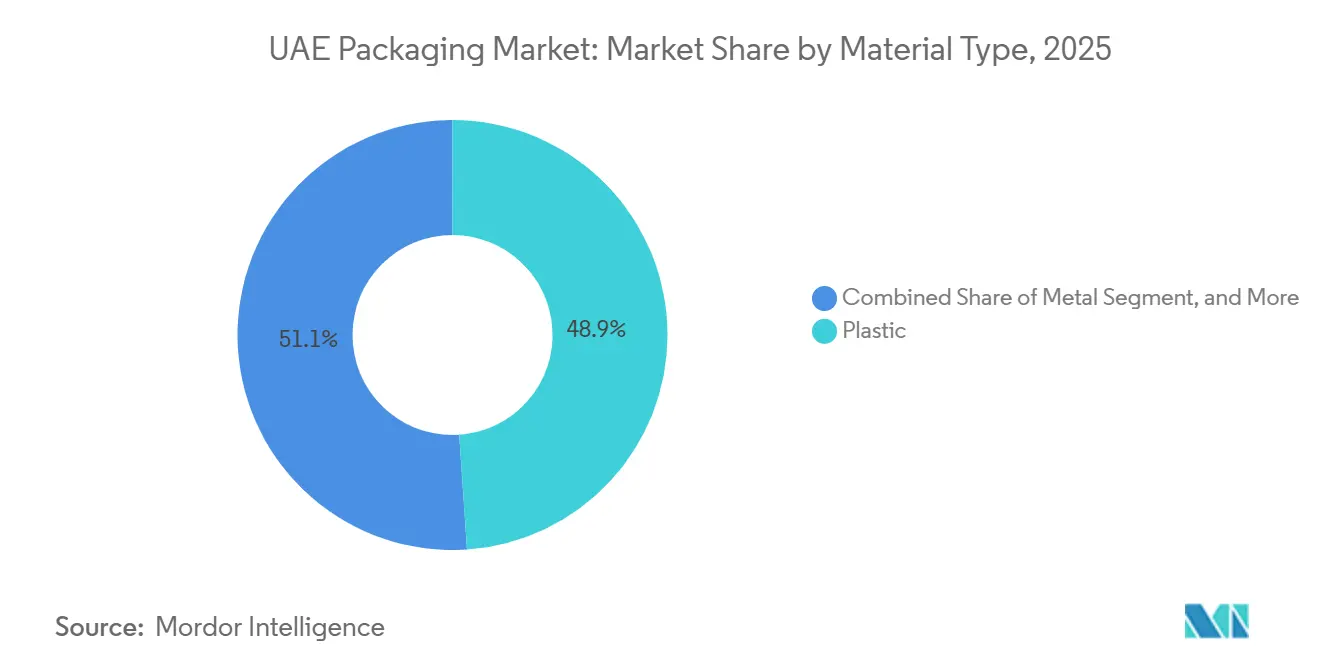
- By material type, plastic captured 48.92% of the UAE packaging market share in 2025, while its volume is projected to expand at a 5.93% CAGR through 2031.
- By product type, the flexible plastics segment led with 33.47% of plastic volume in 2025; the paper and paperboard product type was dominant overall, yet flexible plastics are advancing at a 6.04% CAGR to 2031.
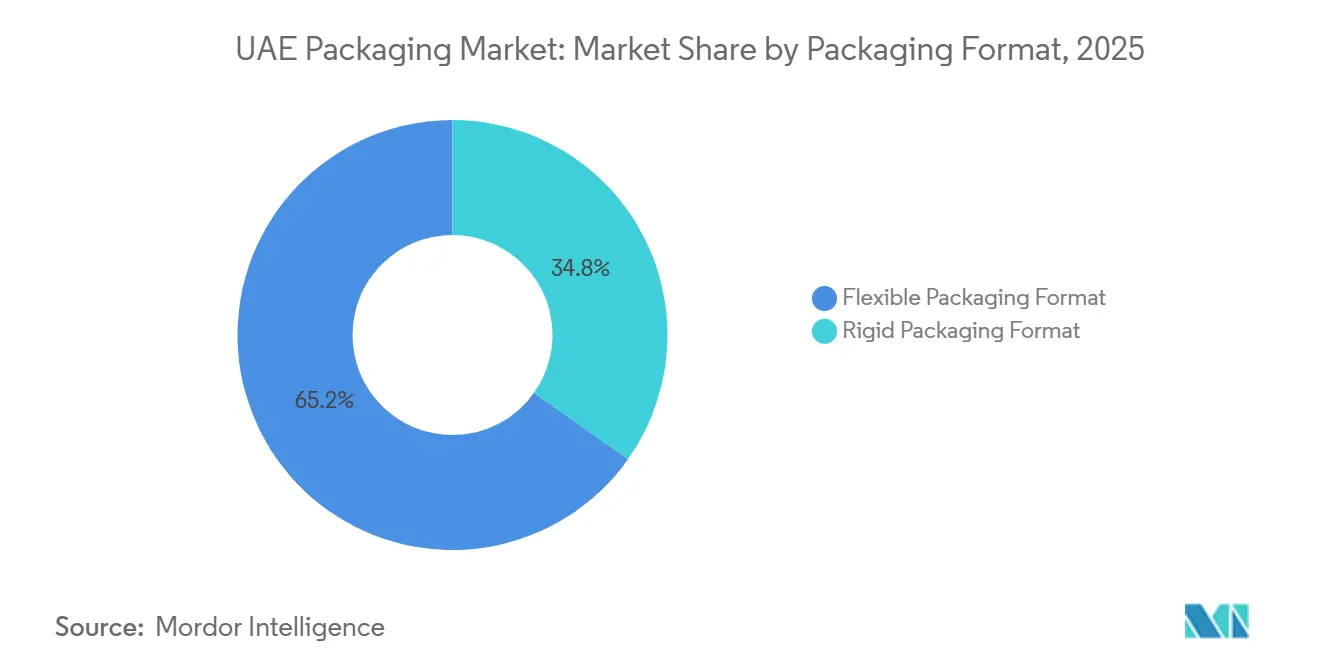
- By packaging format, flexible formats accounted for 65.19% of the UAE packaging market size in 2025 and are forecast to grow at a 5.61% CAGR, outpacing rigid formats.
- By end-user, food accounted for 32.44% of revenue in 2025, whereas personal care and cosmetics are projected to post the fastest 6.88% CAGR through 2031.
Note: Market size and forecast figures in this report are generated using Mordor Intelligence’s proprietary estimation framework, updated with the latest available data and insights as of 2026.
UAE Packaging Market Trends and Insights
Drivers Impact Analysis*
| Driver | (~) % Impact on CAGR Forecast | Geographic Relevance | Impact Timeline |
|---|---|---|---|
| E-commerce boom fueling corrugated and last-mile packaging | +1.2% | National, focused on Dubai, Abu Dhabi, Sharjah | Short term (≤ 2 years) |
| Vision 2030 incentives boosting local FMCG packaging demand | +0.9% | National, early gains in KEZAD, JAFZA, Dubai Industrial City | Medium term (2-4 years) |
| National Food Security Strategy 2051 driving high-barrier food packs | +0.7% | National, emphasis on Abu Dhabi and Al Ain agricultural zones | Long term (≥ 4 years) |
| Rapid rise of cloud kitchens and ready-meal services | +0.6% | Dubai, Abu Dhabi, Sharjah urban cores | Short term (≤ 2 years) |
| Decarbonization mandates pushing bio-based and reusable packs | +0.5% | National, spill-over to GCC | Medium term (2-4 years) |
| Smart track-and-trace pilots in pharma logistics | +0.3% | National, led by Dubai Healthcare City and Abu Dhabi Health Zone | Medium term (2-4 years) |
| Source: Mordor Intelligence | |||
E-Commerce Boom Fueling Corrugated and Last-Mile Packaging
Online retail sales in the Emirates are projected to hit USD 9.2 billion in 2026, expanding at an 11% compound rate, and this escalation is redirecting corrugated demand toward lighter e-flute and micro-flute grades that shave volumetric weight charges without sacrificing crush resistance. Amazon UAE and Noon have each expanded their fulfillment center networks since 2024, with Noon's Dubai South site alone processing more than 1 million parcels per peak month, amplifying demand for right-sized shipping boxes and cushioned mailers.[1]Noon, “Dubai South Fulfillment Center Milestones,” noon.com The Make it in the Emirates incentive gives local converters 10-year tax holidays and subsidized land, encouraging investments in digital-print folder-gluers that profitably handle sub-5,000-unit runs demanded by flash-sale retailers. Heightened dependency on e-commerce lifted last-mile corrugated to 40% of national box output in 2025, up from 25% in 2020, but also exposed converters to an 18% price jump for kraft liners caused by Nordic supply interruptions early in 2025. As parcel networks extend deeper into residential neighborhoods, converters that master lightweight, custom-print corrugated will secure volume and margin leadership in the UAE packaging market.
Vision 2030 Incentives Boosting Local FMCG Packaging Demand
Operation 300bn aims to reach AED 300 billion in annual manufacturing value by 2031, designating packaging as a pivotal enabler for domestic expansion in food, pharma, and consumer goods. KEZAD and JAFZA have earmarked more than 2 million m² of industrial land for converters, bundling low-tariff utilities and 12-month fast-track permits that cut typical build times by one-third. Hotpack’s fully automated PET thermoforming plant in Dubai, opened in 2022, delivers 35% lower labor cost per unit than legacy sites and easily surpasses the 40% local-content threshold required for public tenders. Three UAE facilities earned Industry 4.0 lighthouse status in 2025 after predictive-maintenance rollouts raised overall equipment effectiveness above 85%, showcasing the state’s push to leapfrog regional peers on productivity.[2]UAE Ministry of Industry and Advanced Technology, “Make it in the Emirates Incentive Scheme,” moiat.gov.ae These bundled incentives are steering global brand owners to source packaging locally, cementing a structural demand base for UAE converters.
National Food Security Strategy 2051 Driving High-Barrier Food Packs
The strategy mandates a 50% cut in food waste by 2030, propelling demand for extended-shelf-life films that withstand 45 °C summer temperatures and minimize lipid oxidation.[3]UAE Ministry of Climate Change and Environment, “National Food Security Strategy 2051 Framework,” moccae.gov.ae High-barrier laminates blending EVOH with metallized PET are now featured in 60% of new dairy and meat tenders, up from 35% in 2023, reflecting regulatory requirements for oxygen transmission rates below 0.5 cc/m²/day. Tetra Pak secured a June 2024 contract to outfit EKTFA’s Mleiha Dairy with aseptic Tetra Top lines targeting a 12-month ambient shelf life for UHT milk destined for export to GCC markets, where cold chains remain patchy. Four modified-atmosphere packaging lines commissioned in 2025 in Abu Dhabi and Dubai now flush oxygen levels below 0.5%, extending the life of fresh produce by up to 10 days and aligning retailers with waste-reduction targets. This confluence of policy and technology locks high-barrier films and aseptic cartons into the growth core of the UAE packaging market.
Rapid Rise of Cloud Kitchens and Ready-Meal Services
More than 200 virtual restaurant brands operated by firms such as Kitopi and Sweetheart Kitchen have proliferated across Dubai, Abu Dhabi, and Sharjah, shrinking the average order to 1.8 meals and multiplying demand for single-portion containers. Aluminum foil trays with paperboard lids now account for 45% of the cloud-kitchen segment because they withstand 30-minute motorcycle rides in 40 °C heat without warping, supplanting banned expanded polystyrene foam. Retail-ready ready meals grew 14% annually from 2023-2025, ushering in high-barrier stand-up pouches fitted with resealable zippers that preserve texture during microwave reheating. Delivery platforms increasingly mandate tamper-evident labels, and converters are integrating peel-and-seal tapes that cost less than AED 0.05 per unit yet materially lift consumer trust. The dispersion of meal prep and last-mile constraints, therefore, cements lightweight, tamper-safe formats as critical growth levers for converters.
Restraints Impact Analysis*
| Restraint | (~) % Impact on CAGR Forecast | Geographic Relevance | Impact Timeline |
|---|---|---|---|
| 30% excise tax on single-use plastics | -0.8% | National | Short term (≤ 2 years) |
| Volatile resin costs from gas-to-chemicals projects | -0.6% | National, spill-over to GCC | Medium term (2-4 years) |
| Delay in food-grade rPET standard adoption | -0.4% | National | Medium term (2-4 years) |
| Sub-scale domestic paper recycling infrastructure | -0.3% | National, centered in Sharjah, Dubai | Long term (≥ 4 years) |
| Source: Mordor Intelligence | |||
30% Excise Tax on Single-Use Plastics
The phased levy, fully effective since January 2026, slices converter gross margins by up to 18 percentage points as brand owners resist full cost pass-through. Exemptions for pre-packaged retail goods spur substitution into stand-up pouches and flow-wrap films, yet functional trade-offs emerge in food service, where molded-fiber clamshells cost 40% more and leak more readily in high-moisture dishes. Restaurant chains report elevated customer complaints tied to container failures, which are undermining sustainability goodwill. Imports of rigid containers from neighboring GCC states with no parallel tax climbed 22% year-on-year in H1 2025, eroding the competitive position of UAE converters. Until domestic recycling and fee harmonization mature, the excise operates as both an environmental nudge and a profit drag.
Volatile Resin Costs From Gas-to-Chemicals Projects
Spot polypropylene and high-density polyethylene prices oscillated between USD 950 and USD 1,320 per tonne during 2024-2025, as commissioning delays at the Ruwais and TA’ZIZ complexes forced converters to pay import-parity prices from Asia and Europe. Borouge’s polypropylene trains slipped six months after catalyst issues, leaving some firms to buy Saudi-origin polymer at a 12% premium, squeezing working capital. Future TA’ZIZ output is expected to reach 1.5 million t of linear low-density polyethylene from 2027, yet reliance on Shah field ethane ties resin output to upstream OPEC quota decisions. Small and mid-size converters lacking hedge facilities bear the brunt, prompting three mid-tier film producers to explore private-equity buyouts in 2025. In the absence of schedule certainty, resin volatility will continue to distort cost curves and accelerate consolidation in the UAE packaging sector.
*Our forecasts treat driver/restraint impacts as directional, not additive. The impact forecasts reflect baseline growth, mix effects, and variable interactions.
Segment Analysis
By Material Type: Feedstock Economics, Cement, Plastic, and Leadership
Plastic accounted for 48.92% of the UAE packaging market share in 2025 and is forecast to expand at a 5.93% CAGR through 2031, a trajectory tied to Borouge’s 6.4 million-tonne polyolefin hub, which prices resin 15-20% below import parity. Polypropylene dominates closures, oriented films, and thermoforms, while combined high- and low-density polyethylene supplies 35% of plastic tonnage in blow-molded bottles for dairy and detergents. Polyethylene terephthalate captures 22% of plastic volume because of its clarity and carbonation barrier, which remain non-negotiable in soft drinks. The January 2026 single-use-plastic ban is squeezing polyvinyl chloride and polystyrene, accelerating switches to molded-pulp trays and aluminum foil containers.
Paper and paperboard accounted for 28% of material volume in 2025, yet rely on imported recycled pulp that inflates costs by as much as 15% compared to domestically sourced fiber, curbing growth. Metal stays niche at 8% on the strength of aluminum cans and aerosols that capitalize on the UAE’s re-export corridors through Jebel Ali Port. Container glass, at 6%, maintains its presence in premium beverages and beauty creams, where consumers prize inertness and a luxury perception despite heavier freight footprints. Bio-based polylactic acid, due to flow from Emirates Biotech’s USD 800 million plant in 2028, will open a compostable option for thermoforms, but volumes will start small relative to the prevailing polymer slate. Collectively, these dynamics ensure that plastics remain the volume and value anchor of the UAE packaging market throughout the forecast window.



By Product Type: Flexibles Win the Freight and Carbon Equation
Paper and paperboard product type led overall at 33.47% in 2025, driven by corrugated boxes that supply e-commerce and food-service channels. Folding cartons and rigid boxes, which account for 20% of paper tonnage, serve cosmetics and confectionery that justify a 25-40% unit premium for shelf appeal. Yet flexible plastics are outpacing all rivals with a 6.04% CAGR through 2031 as a 30 g pouch replaces a 180 g jar, cutting dimensional-weight fees by up to 60% for courier deliveries.
Within plastics, flexibles accounted for 58% of product volume in 2025, driven by stand-up pouches, which now hold 45% of frozen ready-meal facings. Rigid plastics retained 42% thanks to PET beverage bottles and polypropylene jars that meet the tamper-evident requirements of the Tatmeen track-and-trace system. Metal product type, at 12%, benefits from “infinitely recyclable” branding as craft-drink launches shift into slim aluminum cans. Glass bottles and jars, 8%, hold premium niches where product integrity signals outweigh transport penalties. The combined shift underlines how cost-per-fill, recyclability claims, and courier economics are realigning the UAE packaging market size toward flexible dominance.
By Packaging Format: Lightweight Laminates Outrun Traditional Rigid Packs
Flexible formats captured 65.19% of 2025 volume and are projected to grow at a 5.61% CAGR as ethylene-vinyl-alcohol and metallized PET laminates push oxygen transmission below 0.5 cc/m²/day, extending the life of fresh produce by up to 10 days. Cloud kitchens favor peel-film bowls that fall under the flexible definition, while courier tariffs reward every gram saved. High-speed digital presses also let converters print limited-run graphics for influencer campaigns without plate costs, narrowing the lead-time gap with labels.
Rigid formats held 34.81% in 2025 and remain relevant in carbonated beverages and pharmaceuticals, where structural strength, pressure resistance, and regulatory validation are essential. Reverse-vending pilots collected 1.1 million PET and aluminum units in six months, demonstrating the recyclability upside rigid containers can deliver. Thermoformed PET meat trays are migrating to modified-atmosphere systems that demand capital commitments of USD 0.5-1.5 million per line, favoring large-scale converters. Aluminum cans continue to poach share from glass in soft drinks because their lower weight reduces freight emissions under the Federal Decree-Law No. 11 reporting rules. Together, weight economics and carbon accounting ensure flexibles extend their UAE packaging market share lead, though rigids will defend mission-critical niches.
By End-User: Beauty and Pharma Provide the Next Growth Spurts
Food represented 32.44% of 2025 consumption, but penetration already tops 85% in urban households, tempering upside. The National Food Security Strategy 2051 nevertheless creates incremental demand for aseptic cartons and high-barrier films, pushing shelf life to 12 months for ambient dairy exports. Beverage packaging, 22% share, is shifting to aluminum cans as brand owners chase higher post-consumer-recycling rates and lighter logistics footprints. Pharmaceutical and medical packs (11%) are expanding at 5.8% as Tatmeen requires GS1 codes and tamper-evident seals on every unit dose.
Personal care and cosmetics are the fastest-growing end-user segment, with a 6.88% CAGR, because Dubai’s duty-free zones re-export prestige brands across the Middle East and South Asia. Injection-molded airless pumps, metallized tubes, and soft-touch jars command premium shelf pricing, lifting converter margins even as resin costs fluctuate. Industrial and chemical uses, 9% of 2025 volume, add steady demand for intermediate bulk containers and fiber drums tied to construction and petrochemicals. Agriculture packaging, 7%, grows the slowest because arable land is scarce, while automotive uses edge higher as electric-vehicle imports require specialized battery containment. This end-user mix positions the beauty, pharma, and premium beverage segments to deliver the bulk of the incremental growth in the UAE packaging market through 2031.
Geography Analysis
Dubai anchors the UAE packaging market, capturing an estimated 48% of national demand in 2025 thanks to JAFZA, Dubai Industrial City, and National Industries Park, which collectively host more than 60 converting plants and grant 10-year tax holidays that lower effective corporate rates to zero. The emirate’s integrated ports and road grid enable next-day delivery to every corner of the country, a logistics edge that reduces working capital tied up in finished-goods inventory by 8-12% compared with larger Gulf neighbors. E-commerce parcel density is highest in Dubai, so converters operating here secure the bulk of micro-flute box and cushioned-mailer contracts, which now dominate last-mile fulfillment. Taken together, these factors cement Dubai’s role as the commercial heart of the UAE packaging market.
Abu Dhabi ranks second yet is expanding fastest, propelled by KEZAD’s 410 km² industrial zone and the USD 800 million polylactic-acid plant that will add 160,000 t of compostable resin capacity by 2028. Access to discounted ethane feedstock from the Ruwais petrochemical hub lets converters lock in resin at 15–20% below import parity, a structural cost advantage over peers in Dubai and Sharjah. Government grants covering up to 30% of capex for Industry 4.0 equipment have also attracted multinational carton, closure, and label makers that want on-site raw-material security and renewable-energy certificates for export audits. As a result, Abu Dhabi’s share of the UAE packaging market is forecast to climb by 5 percentage points by 2031.
Sharjah and the four northern emirates collectively account for roughly 15% of packaging consumption, with Beeah’s 150,000-ton recycling campus supplying much of the recovered paper used in domestic corrugated board. Ras Al Khaimah has emerged as a flexible-film niche after Huhtamaki expanded its plant there in 2024 to serve East African export lanes via Saqr Port. The compact national footprint, only 83,600 km², lets converters in smaller emirates still reach retail distribution hubs within hours, preserving country-wide service levels without duplicating heavy capex. Federal Decree-Law No. 11 of 2024 is pushing every emirate to add rooftop solar and waste-heat recovery, and early adopters are already trimming grid electricity bills by up to 30%.
Regulatory Landscape
The UAE regulatory environment for packaging is tightening around waste reduction, circularity, and consumer disclosure. A key inflection point is the federal restriction effective 1 January 2026 that bans specified single-use plastic items (including beverage cups and lids, cutlery, food containers, straws, and bags), which is accelerating substitution toward permitted materials and redesigned formats across foodservice and retail channels.
For product governance, Cabinet Decision No. 66/2023 strengthens labeling and marking obligations by requiring clear product particulars on packaging (including name/type, ingredients, net weight/measure, country of origin, and manufacturer/importer details). For food-contact packaging, the Ministry of Industry and Advanced Technology (MoIAT) oversees conformity requirements under the federal framework governing food-contact materials, including certificates of conformity for recycled plastics intended for food contact and the use of approved recycling facilities and accredited lab safety testing. This raises the bar for rPET and other recycled-content supply into regulated end uses.
Value Chain Analysis
The UAE packaging value chain is anchored by resin and petrochemical feedstocks (notably integrated polyolefin supply linked to Ruwais), imported and locally recovered paper fiber, and a converting base concentrated around major industrial zones and ports (JAFZA, Dubai Industrial City, National Industries Park, and KEZAD). Converters supply FMCG, foodservice, e-commerce, and pharma customers through in-country distribution and re-export corridors, with performance requirements increasingly shaped by traceability, labeling, and food-contact compliance.
End-of-life and circular inputs are gaining operational importance under federal waste and circular-economy frameworks, including the Integrated Waste Management legal basis and Cabinet Decision No. 118/2023 on valorization of industrial-use wastes. These measures support using waste streams as production inputs, which is translating into investment and integration across the chain, from recycling initiatives to paper capacity additions (for example, a recycled containerboard project in KEZAD) and converter-led hub models that co-locate manufacturing with warehousing and logistics to shorten lead times for e-commerce and foodservice demand while meeting tighter conformity and disclosure requirements.
Competitive Landscape
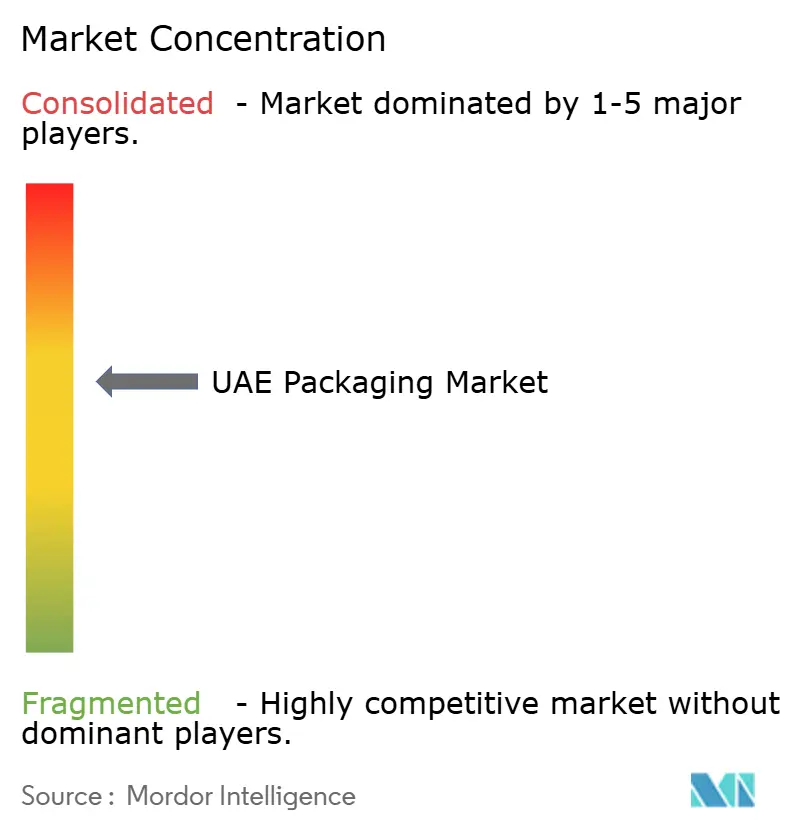
The UAE packaging market is moderately fragmented, with the top five suppliers accounting for about 37% of 2025 revenue, leaving room for agile mid-tier converters to win niche contracts for pharmaceutical labels, luxury cartons, and molded-fiber trays. Global majors Tetra Pak, Mondi, Amcor, and SIG Combibloc control most of the aseptic carton and high-barrier film volume through proprietary technologies and long-term agreements with multinational brand owners that prioritize regulatory compliance over unit price. Their dominance in patent-protected substrates helps stabilize the high end of the value chain without fully crowding out local firms.
Local champion Hotpack operates 13 UAE plants and, in May 2025, committed USD 100 million to build its first United States facility in New Jersey, confirming that domestic players now possess the scale, automation, and working-capital strength to compete abroad. Arabian Packaging and Gulf East Paper leverage backward-integrated corrugators to supply the surging e-commerce and food-service sectors, while Union Paper Mills partnered with Tetra Pak to launch a 10,000-t carton-recycling loop that offsets dependence on imported fiber. Huhtamaki’s 2024 consolidation into an expanded Ras Al Khaimah factory illustrates how multinationals can optimize fixed overhead while remaining committed to UAE export corridors.
Next-wave competition will hinge on bio-based resins, serialization-ready pharma packs, and reusable transport packaging. Emirates Biotech’s upcoming polylactic-acid stream positions early adopters to win compostable-tray tenders once Extended Producer Responsibility fees mature, potentially displacing 3.2 billion PET bottles annually. The Tatmeen track-and-trace platform obliges all pharma packs to carry GS1 codes and tamper-evident features, a requirement that demands USD 2–5 million in line upgrades and favors converters with strong balance sheets. Meanwhile, three mid-sized flexible-film firms are exploring private-equity partnerships to fund resin-hedging programs and automation, signaling that consolidation momentum in the UAE packaging market is far from over.
UAE Packaging Industry Leaders
Tetra Pak International SA
Mondi plc
Amcor plc
International Paper Company
Arabian Packaging Co. LLC
- *Disclaimer: Major Players sorted in no particular order

Market Opportunities and Future Outlook
Policy-led format substitution is creating clear whitespace in compliant foodservice and retail packaging as the 1 January 2026 single-use plastic restrictions take effect nationally. That shift is generating near-term demand for paper-based and fiber alternatives, redesigned flexible formats that remain permissible, and higher-performance sealing and tamper-evidence solutions for delivery and ready-meal channels. The July 2025 Extended Producer Responsibility (EPR) pilot launched by the Ministry of Climate Change and Environment (MOCCAE) and Tadweer Group adds another commercialization lever by pushing brand owners and packaging partners to integrate collection, reporting, and recycled-content pathways into procurement decisions.
Capacity and supply-chain localization programs are turning into tangible opportunities for converters and material suppliers across Abu Dhabi and Dubai industrial clusters. Examples include Star Paper Mill inaugurating a recycled containerboard facility in KEZAD in May 2026 and Al Bayader International's development of an integrated food packaging hub in the National Industries Park, designed to scale paper-based and circular plastic packaging output. In parallel, higher-spec packaging for premium end uses is being pulled into the country via industrial-zone initiatives, such as the ISEM Packaging Group MoU with 2PointZero and KEZAD to explore a high-end packaging manufacturing facility aimed at beauty, fashion, and gourmet food, reinforcing demand for advanced printing, finishing, and compliant substrate sourcing within the UAE.
Recent Industry Developments
- June 2026: Al Bayader International partnered with National Industries Park (NIP) to develop an integrated food packaging manufacturing and logistics hub in Dubai, with a stated plan to add 30,000 tonnes per year of capacity by early 2028. The project supports faster replenishment for foodservice and delivery channels by co-locating converting, warehousing, and distribution in a single site.
- July 2025: The UAE launched an Extended Producer Responsibility (EPR) pilot with 26 participating companies, requiring brand owners to help fund the collection and recycling of post-consumer packaging. This step increased the commercial importance of recyclable designs, material traceability, and partnerships with collectors and recyclers for converters serving FMCG accounts.
- June 2024: Tetra Pak and Union Paper Mills launched the UAE's first carton packages recycling line, backed by a joint investment of AED 2.5 million and designed for 10,000 tonnes of annual processing capacity. The added local recycling route improves the circularity proposition for carton packaging and supports brand owners seeking domestic recovery pathways.


Research Methodology Framework and Report Scope
Market Definition and Coverage
For this study, the UAE packaging market is defined as the value of packaging materials and packaging formats sold for use in the country across key end-use industries, measured in USD and tracked over the stated study and forecast years.
Scope exclusions: It excludes packaging machinery and installed equipment, and it also excludes logistics services and other non-packaging services.
Segmentation Overview
- By Material Type
- Paper and Paperboard
- Plastic
- Polypropylene (PP)
- High-Density and Low-Density Polyethylene (HDPE and LDPE)
- Polyethylene Terephthalate (PET)
- Polyvinyl Chloride (PVC)
- Polystyrene (PS)
- Other Plastics
- Metal
- Container Glass
- By Product Type
- Paper and Paperboard Product Type
- Folding Carton and Rigid Boxes
- Corrugated Boxes and Containers
- Single-Use Paper Products
- Other Paper and Paperboard Product Types
- Plastic Product Type
- Rigid Plastics
- Bottles and Jars
- Caps and Closures
- Bulk-Grade Products
- Other Rigid Plastics
- Flexible Plastics
- Pouches
- Bags
- Films and Wraps
- Other Flexible Plastics
- Rigid Plastics
- Metal Product Type
- Cans
- Caps and Closures
- Aerosol Containers
- Other Metal Product Types
- Container Glass Product Type
- Bottles
- Jars
- Paper and Paperboard Product Type
- By Packaging Format
- Rigid Packaging Format
- Flexible Packaging Format
- By End-User
- Food
- Beverage
- Pharmaceutical and Medical
- Personal Care and Cosmetics
- Industrial and Chemical
- Agriculture
- Automotive
- Other End-Users
Data Sources, Market Sizing, and Validation
Desk Research
Desk research is used to set the market boundaries, build a clean demand narrative, and assemble input indicators that can be checked year by year. We rely on public references such as UAE Federal Competitiveness and Statistics Centre releases, UN Comtrade trade statistics, UAE customs and free zone updates where available, and sustainability and waste-management publications from UAE government entities.
To support the conversion of these signals into market values, we also review company annual reports, investor presentations, audited financial statements, industry association websites, and trusted press coverage on packaging capacity, recycling initiatives, and policy changes. When needed, we use paid subscriptions for company financials and intelligence, patents, and shipment-level import and export data to cross-check product availability, pricing direction, and supply movements. The sources listed here are illustrative only, and many other references were also used for data collection, validation, and clarification during the research.
Primary Interviews and Surveys
Primary work is used to validate the share of key packaging formats, get reality checks on pricing and mix changes, and confirm how regulations and customer requirements are affecting demand. We spoke with a mix of packaging material suppliers, converters, distributors, and large packaging buyers across food, beverage, pharma, personal care, and industrial uses, covering import-led as well as locally produced supply. Inputs were also tested across the main business hubs in the UAE so the model does not lean too heavily on one channel or one end-use.
Distribution of primary research fieldwork respondents
| Company type | Respondent position |
|---|---|
| Top tier: 29% | CXOs: 20% |
| Mid tier: 49% | Functional/Unit leaders: 21% |
| Smaller Players: 22% | Managers: 59% |
Market-Sizing & Forecasting
Sizing starts with a top-down build where packaging demand is reconstructed from end-use activity in the UAE and then translated into value through packaging mix and average pricing by material and format. The model uses practical inputs such as packaged food and beverage output trends, pharma and personal care manufacturing indicators, e-commerce shipment growth as a proxy for secondary packaging pull, import and export movements for packaging materials, and visible changes in recycled content and collection targets that influence material substitution.
The totals are then corroborated with selective bottom-up approximations, such as sampling converter revenues where disclosures exist, running channel checks on pricing bands, and validating volume direction using trade flows for key packaging inputs. Where direct data is thin, we bridge gaps using conservative penetration and substitution assumptions that were stress-tested in interviews, and then adjusted until the final totals stay consistent with observed supply and demand signals.
For forecasting, scenario analysis is used to reflect policy timing and adoption curves, followed by a simple multivariate regression cross-check on demand drivers like non-oil manufacturing activity, population and consumption indicators, and e-commerce intensity. Assumptions on price progression are kept transparent by linking them to resin and paper trends, recycled content requirements, and import cost movements, rather than applying a flat inflation uplift.
Data Validation & Update Cycle
Validation is done through step-by-step cross-checks so the output stays aligned with real market signals. We compare the final values with independent indicators like trade trends for packaging inputs, capacity announcements, and end-use production direction, and then recheck any sharp year-to-year jumps before internal sign-off.
When variances appear, the assumptions are revisited, and respondents are re-contacted if the gap is tied to pricing, mix shifts, or a new regulation that may have changed buying behavior. Reports are refreshed annually, and interim updates are made when a material event occurs that can move demand, supply, or pricing. Before delivery, the model is re-run with the latest available public data so clients receive an updated view rather than an older snapshot.
Mordor Intelligence's UAE Packaging Market Size Compared With Other Published Estimates
Published market sizes for UAE packaging often vary because the scope is not always matched, and the year labeling can be inconsistent across sources. Differences also come from how price is treated, especially when material mix is shifting, and from whether policy-led changes are captured in the forecast start year.
The main gap comes from whether the estimate blends packaging materials with adjacent items like packaging equipment and services. Mordor Intelligence counts only packaging materials and formats sold into end users in the UAE and ties value to mix and pricing by material and format. Another driver is refresh cadence, since policy timing and substitution from plastic to paper or recycled options can move the number quickly when assumptions are not revisited.
Benchmark comparison
| Source | Market Size | Gaps in Research Methodology |
|---|---|---|
| Mordor Intelligence | USD 10.84 B (2025) | |
| Regional Consultancy A | USD 9.00 B (2025) | This figure is presented without a clearly stated base-year framework in the public summary, and it appears to apply a tighter demand scope that can undercount rigid formats and non-FMCG industrial packaging. |
| Industry Publisher B | USD 14.80 B (2031) | The higher long-range value can come from using a more aggressive scenario for policy-driven material substitution and price uplift, and from applying broad average growth rates that are not fully anchored to end-use activity checks. |
Across the three figures, the spread is mainly explained by scope boundaries, price and mix treatment, and how quickly assumptions are refreshed when regulations change. By keeping the inputs tied to end-use demand signals and validating with interviews and secondary checks, the final number stays traceable to a repeatable set of steps, which makes year-to-year comparisons easier for planning.


Key Questions Answered in the Report
What CAGR is forecast for the UAE packaging market between 2026 and 2031?
The market is projected to grow at a 5.23% CAGR over the 2026-2031 period.
Which material group will capture most incremental value through 2031?
Plastics will add the largest absolute value, supported by discounted feedstock from domestic polyolefin complexes.
Why are flexible formats outperforming rigid packs?
Flexibles weigh up to 85% less, cut freight costs, and comply more easily with carbon-reduction mandates.
How will the single-use-plastic excise affect converters?
Gross margins may decline by up to 18 percentage points unless firms pass costs to brand owners or pivot to exempt formats.
Which emirate will see the fastest packaging-industry capacity build-out?
Abu Dhabi, thanks to KEZAD land availability and large-scale bio-polymer and petrochemical projects.
What strategic capability is required for pharmaceutical packaging suppliers?
Full GS1 serialization and tamper-evident features to comply with the Tatmeen track-and-trace platform.
Page last updated on:


 Your data is secure and never sold or shared.


