Fly Ash Market Size and Share
Market Overview
| Study Period | 2020 - 2031 |
|---|---|
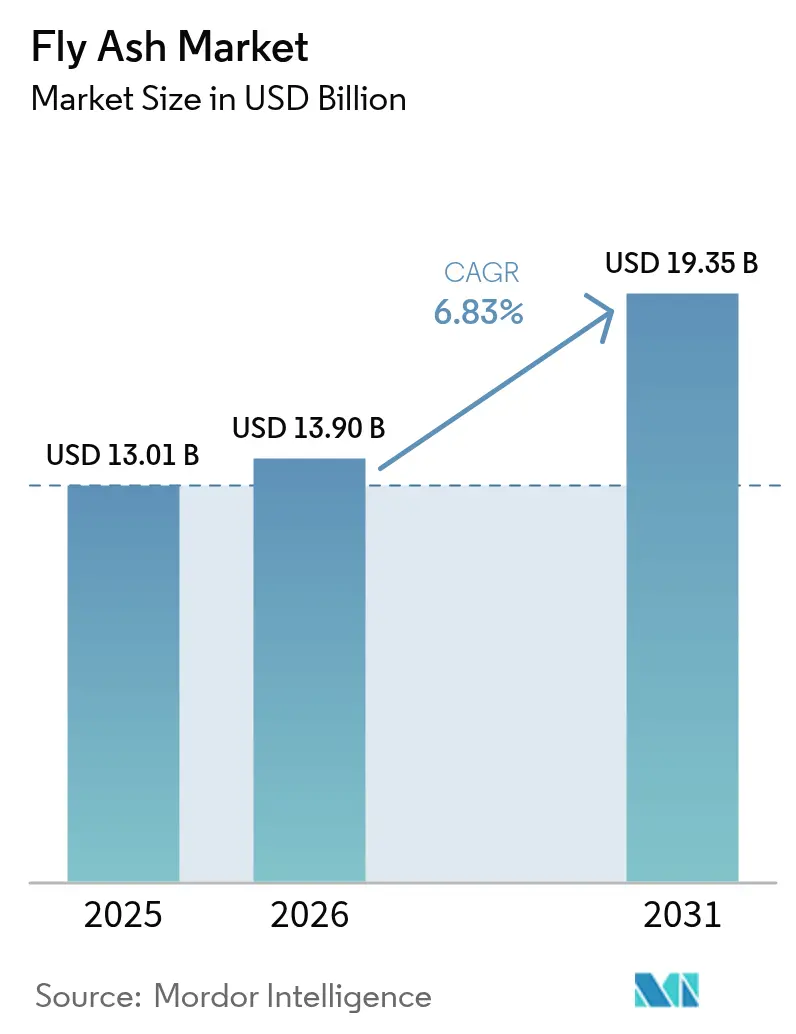
| Market Size (2026) | USD 13.9 Billion |
| Market Size (2031) | USD 19.35 Billion |
| Growth Rate (2026 - 2031) | 6.83% CAGR |
| Fastest Growing Market | Asia Pacific |
| Largest Market | Asia Pacific |
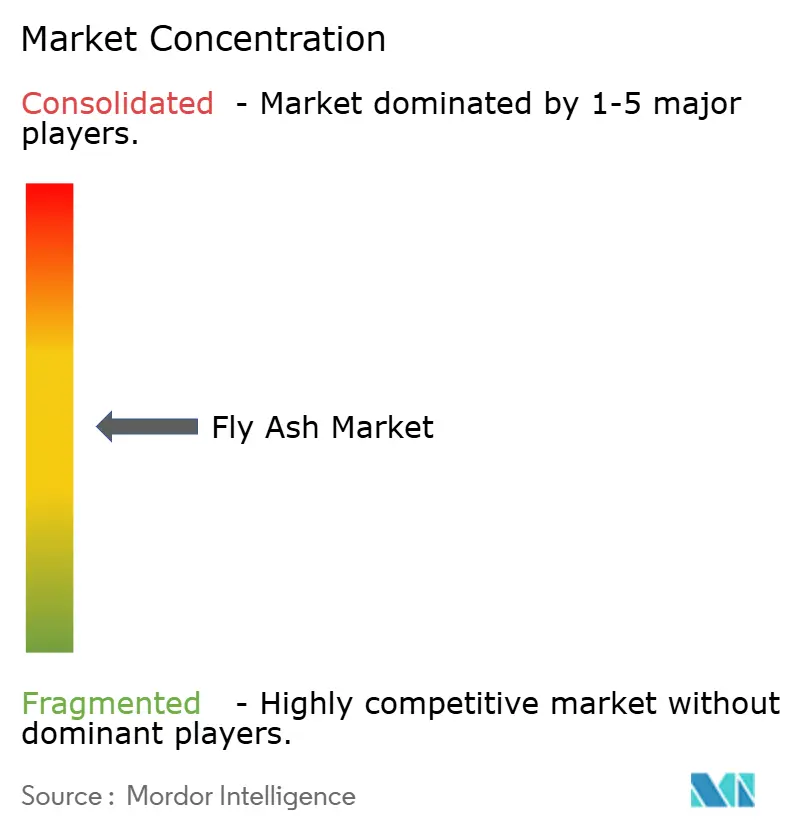
| Market Concentration | Medium |
Major Players *Disclaimer: Major Players sorted in no particular order Image © Mordor Intelligence. Reuse requires attribution under CC BY 4.0. | |
Fly Ash Market Analysis by Mordor Intelligence
The Fly Ash Market size was valued at USD 13.01 billion in 2025 and estimated to grow from USD 13.9 billion in 2026 to reach USD 19.35 billion by 2031, at a CAGR of 6.83% during the forecast period (2026-2031). Asia-Pacific’s broad infrastructure pipeline, the material’s proven ability to cut clinker content, and mounting landfill liabilities for coal combustion residuals are reinforcing demand. Parallel supply-side advantages—ranging from beneficiation technologies that raise consistency to long-term utility–cement partnerships that unlock historical ash ponds—are translating into resilient procurement channels. Competitive differentiation is increasingly migrating toward product transparency; producers that furnish verified Environmental Product Declarations (EPDs) and demonstrate quantifiable carbon savings are capturing specification-driven orders across public and commercial projects.
Key Report Takeaways
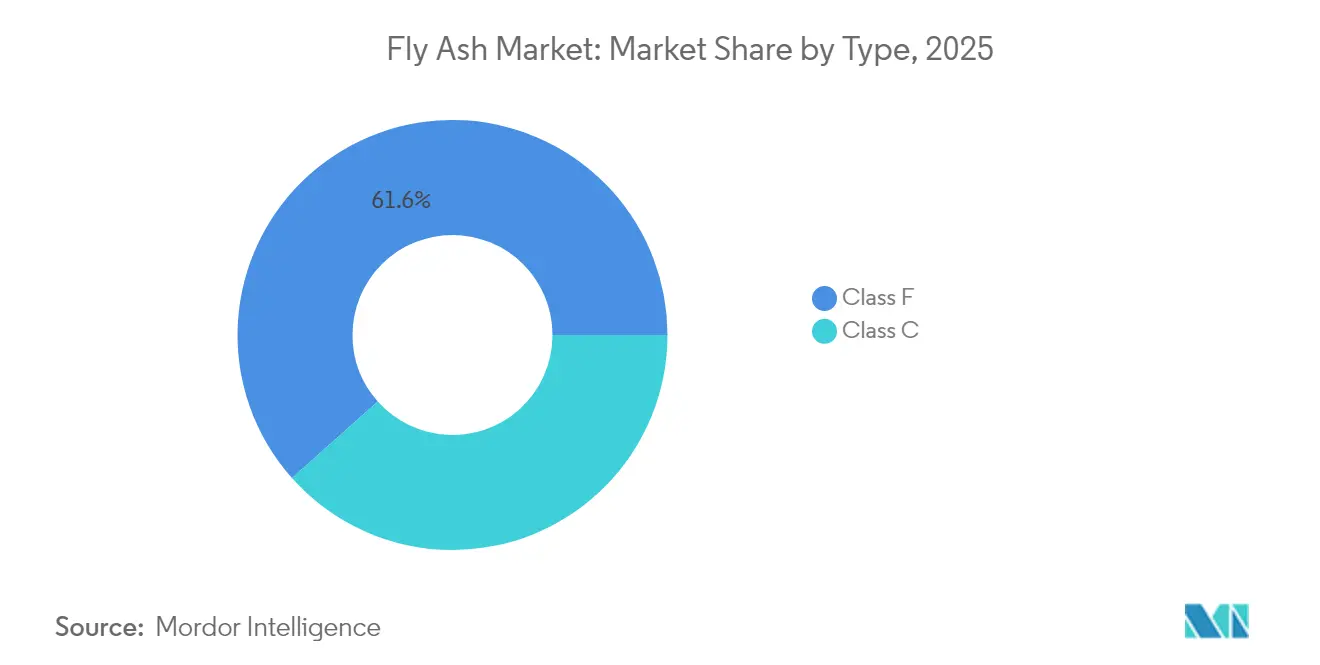
- By type, Class F captured 61.58% of fly ash market share in 2025; Class C is projected to be the fastest mover with a 7.47% CAGR to 2031.
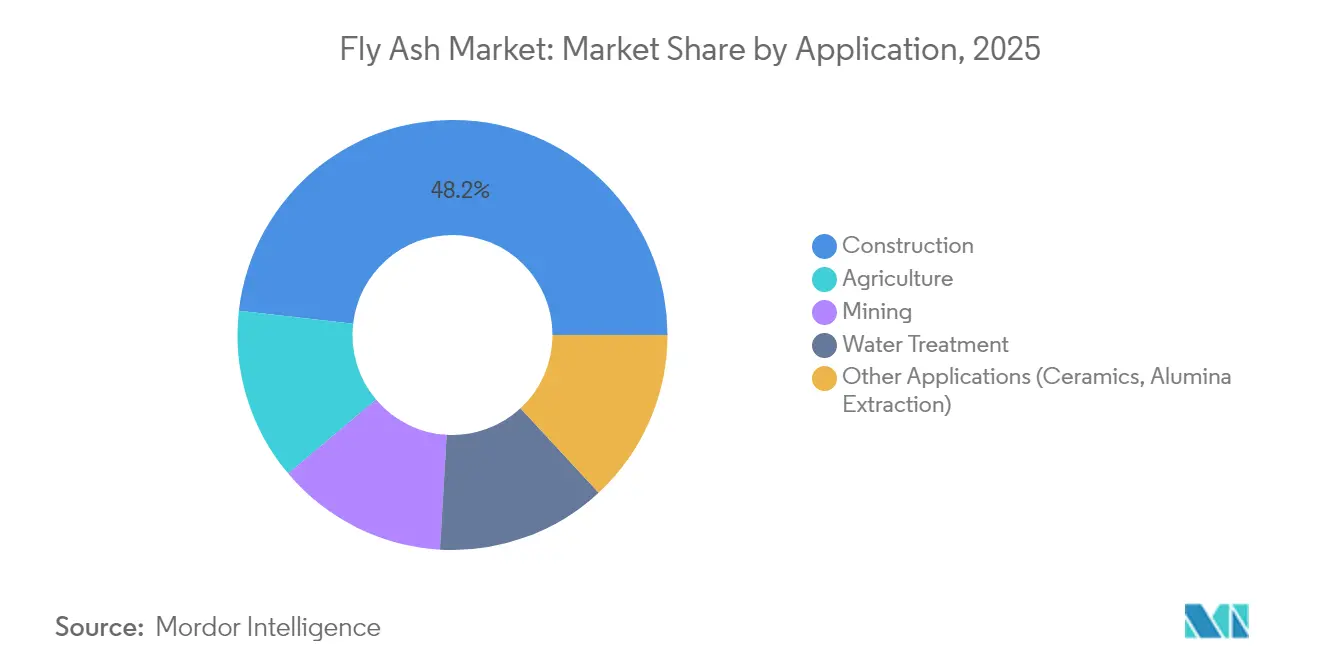
- By application, construction led with 48.20% of the fly ash market size in 2025 and is anticipated to expand at a 7.18% CAGR through 2031.
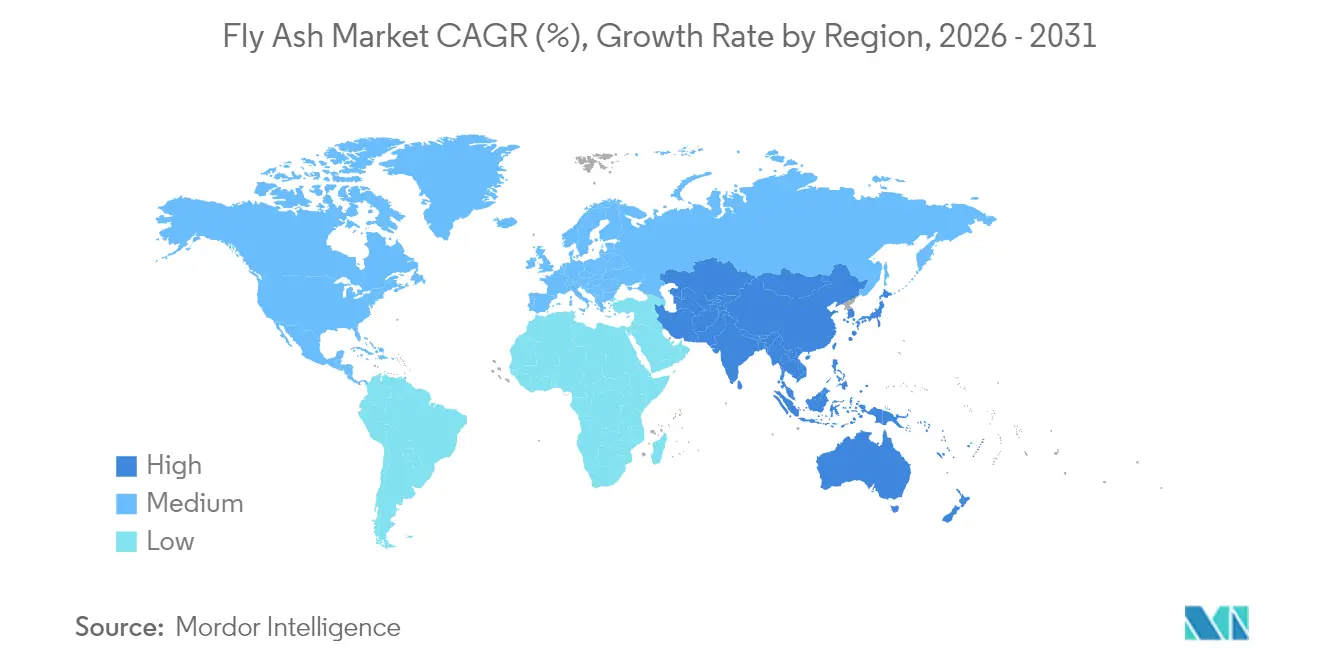
- By geography, Asia-Pacific accounted for 70.55% revenue share in 2025, while North America posts the highest expected CAGR at 7.03% over 2026-2031.
Note: Market size and forecast figures in this report are generated using Mordor Intelligence’s proprietary estimation framework, updated with the latest available data and insights as of 2026.
Global Fly Ash Market Trends and Insights
Surging Green-Cement Mandates in the U.S., EU & India
Governments are tightening procurement rules that lock in clinker-replacement thresholds, making sustained demand for the fly ash market a structural feature rather than a cyclical benefit. Ireland now requires a 30% clinker substitute in all state-funded projects. France’s RE2020 code progressively ratchets down embodied-carbon ceilings for housing, incentivising fly ash blends to remain compliant. New York State’s Buy Clean Concrete guidance overlays emissions caps on state contracts above USD 1 million, forcing ready-mix suppliers to disclose EPDs from 2025[1]New York State Office of General Services, “Buy Clean Concrete Guidelines,” ogs.ny.gov. Municipal precedents such as Santa Monica’s Ordinance #2778 add local momentum by capping cement content in new buildings. Collectively, these measures underpin minimum-volume commitments and are reshaping mix-design norms across public infrastructure procurement.
Rapid Adoption of Low-Carbon Geopolymer Concrete in Public Infrastructure Projects
Geopolymer concrete is pivoting from pilot trials to mainstream delivery schedules, and fly ash provides the primary aluminosilicate backbone for alkali activation. The Langat River Bridge in Malaysia validated ultra-high-performance precast elements that lowered overall bridge costs by 30% compared with steel options. The UK’s M25 Woodford West Viaduct used Cemfree concrete, realising a 77% CO₂ cut and preventing 9.4 t of emissions in just 52 m³ poured. Research confirms that blends containing 50% fly ash, 40% ground-granulated blast-furnace slag, and 10% silica deliver compressive strengths in the 4,000-10,000 psi band while slashing cement demand. Because geopolymer systems gain strength quickly and cure at ambient temperatures, contractors shorten critical-path timelines, creating further pull for the fly ash market.
Expansion of Coal-Based Captive-Power Plants in ASEAN Industrial Zones
Despite global decarbonisation targets, Southeast Asia’s industrial clusters still rely on coal power to meet baseload needs, guaranteeing sizable ash yields that feed regional cement mills. Coal supplied nearly 80% of the region’s incremental energy demand from 2010-2024[2]International Energy Agency, “Southeast Asia Energy Outlook,” iea.org. Indonesian producers mined 217 Mt in 2023 and have announced 58 Mt of capacity additions, which could backstop 21 GW of new power generation and sustain the fly ash market well beyond 2030. While Indonesia’s incoming administration articulates a 15-year coal phase-out, the young average age of regional plants means early retirements remain financially disruptive, implying ash streams will persist in the medium term.
Carbon-Credit Monetisation for High-Volume Fly-Ash Users
Every tonne of cement clinker displaced by fly ash avoids roughly 0.9 t of CO₂. When these reductions are verified, contractors can earn tradable credits that improve project economics and accelerate payback periods. Holcim quantifies and markets such offsets through its ECOPlanet range, cutting at least 30% CO₂ per tonne of cement delivered. Academic work on rice-hull ash confirms a 15% clinker substitution lowers CO₂ intensity almost one-for-one, cementing the credibility of fly ash within both voluntary and compliance-grade carbon frameworks.
Restraints Impact Analysis*
| Restraint | (~) % Impact on CAGR Forecast | Geographic Relevance | Impact Timeline |
|---|---|---|---|
| Volatility in coal-fired generation mix across OECD | -1.4% | North America, Europe, developed APAC | Medium term (2-4 years) |
| Logistics bottlenecks for bulk powder in land-locked areas | -0.9% | Central Asia, global inland hubs | Short term (≤ 2 years) |
| Clinker-free calcium-silicate cements gaining share | -0.7% | Global (early uptake in developed markets) | Long term (≥ 4 years) |
| Source: Mordor Intelligence | |||
Volatility in Coal-Fired Generation Mix Across OECD Markets
Aggressive timelines for plant closures—prodded by the EPA’s 2032-compliance rule—are shrinking forward ash supply, especially where units cannot economically retrofit carbon capture. Compliance costs between USD 536 million and USD 1.1 billion annually are accelerating retirement schedules, removing predictable tonnage streams that the fly ash market historically depended upon. European utilities are on a similar glide path; Germany’s lignite plants now operate under restricted hours, tightening regional supply even as low-carbon construction mandates intensify.
Logistics Bottlenecks for Bulk Powder Handling in Land-Locked Regions
Fly ash’s low-bulk density and variable flow characteristics complicate pneumatic conveying. Dense-phase systems save energy but require specialised compressors that raise capex, while dilute-phase lines risk plugging and product loss. For rail moves under 300 km, freight rates can exceed the avoided clinker cost, eroding the economic logic for substitution. Recent cost-benefit analyses show pipe conveyors outperform trucking beyond 30 km where terrain allows straight-line routing, yet adoption is slow among small-volume buyers. These frictions restrict the fly ash market in interior construction corridors across Central Asia and parts of Africa.
*Our forecasts treat driver/restraint impacts as directional, not additive. The impact forecasts reflect baseline growth, mix effects, and variable interactions.
Segment Analysis
By Type: Class F Stability, Class C Acceleration
Class F retained 61.58% of fly ash market share in 2025, owing to its high silica–alumina matrix that reacts with free lime to form additional C-S-H gels, thereby boosting long-term durability. The fly ash market size linked to Class F sales is expected to post mid-single-digit growth as mature concrete codes still reference its performance pedigree. Research indicates that when alkali concentrations are kept below 2 M, Class F-based geopolymer mixes attain compressive strengths above 40 MPa at ambient curing, opening new territory in precast applications.
Momentum is shifting, however, toward Class C, whose self-cementing nature appeals to ready-mix operators eager to shorten set time without chemical accelerators. Class C’s 7.47% CAGR projection positions it as the fastest-expanding slice of the fly ash market. In the United States, 43% of the 22 Mt generated annually is now recycled, with Class C taking a rising share as Midwestern utilities transition to low-sulfur sub-bituminous coal. Early-strength advantages, coupled with a lower alkali activator requirement, translate into reduced embodied energy for geopolymer producers, reinforcing the segment’s attractiveness through 2031.


By Application: Construction Segment Dominates Multifaceted Demand
The construction segment held 48.20% of the fly ash market size in 2025 and will continue leading at a 7.18% CAGR driven by public infrastructure outlays and corporate net-zero building commitments. In Portland cement blends, 15-35% substitution rates are commonplace, delivering substantial water-reduction and workability gains. Bricks and blocks manufacturers widen margins by replacing up to 60% clay content, gaining lighter weight and superior dimensional accuracy, critical for high-rise partition walls.
Beyond structural concrete, fly ash finds value in road-base stabilisation, where unconfined compressive strength improvements of 35-50% have been recorded in sub-grade soils, extending pavement life cycles. Agricultural experiments, particularly in rice paddies, demonstrate that 5 t/ha fly ash combined with zeolite enhances cation-exchange capacity, boosting yields while immobilising trace heavy metals. Mining applications employ paste backfill mixes where fly ash reduces binder cost yet meets underground strength envelopes, addressing both ground control and waste-management imperatives. Finally, lab-scale work on alumina extraction and ceramic-grade glaze utilises the material’s mullite-forming potential, signalling downstream diversification opportunities for the fly ash industry.
Geography Analysis
Asia-Pacific’s 70.55% slice of the fly ash market stems from entrenched coal capacity and large-scale public works pipelines. China alone produces between 600 Mt and 800 Mt of ash annually, a volume sufficient to satisfy regional substitution quotas even as it pursues its own decarbonisation schedule. India’s mandate requiring 100% ash utilisation within a 300 km radius of generation points enforces a circular supply loop between utilities and cement plants, cementing predictable demand despite coal-retirement chatter.
North America illustrates how regulatory headwinds can be turned into supply opportunities. Georgia Power is dredging 8 Mt of legacy ash under a 15-year contract with Eco Material Technologies, ensuring concrete-grade feedstock while remediating impoundments. The EPA’s Legacy CCR Surface Impoundments rule triggers similar harvest plays, with Consumers Energy earmarking 6 Mt from the J.H. Campbell site for beneficiation. Rail-linked terminals in New York City now distribute harvested ash into urban construction programs, proving the resilience of the fly ash market even in coal-retirement regions.
Europe maintains demand through stringent embodied-carbon thresholds despite dwindling domestic ash output. Ireland’s 30% clinker-replacement edict and France’s RE2020 baseline contraction collectively keep the fly ash market relevant for low-carbon concrete builders. Holcim’s Altkirch plant achieved 100% recycled clinker production in 2024, using a mix of fly ash and other waste-sourced materials that comply with the region’s circularity goals. Imports from South Africa, Turkey, and, increasingly, Southeast Asia help bridge the supply gap, though logistics surcharges elevate delivered-cost parity versus LC3 in some inland EU markets.

Competitive Landscape
The fly ash market is moderately fragmented, with vertical-integrated cement giants, specialist beneficiation firms, and regional ash marketers vying for specification-based deals. Holcim leads with its ECOPlanet and ECOPact suites that integrate fly ash to cut CO₂ intensity by at least 30%. Heidelberg Materials’ evoBuild platform aims to derive 50% of revenue from sustainable products by 2030, anchoring its strategy on adaptable supplementary cementitious material blends. Cemex deepens its circularity roadmap by advocating for CCUS incentives that dovetail with higher fly ash usage, reinforcing its climatically aligned brand credentials.
Mid-tier specialists extract margin via technology leadership. Charah Solutions’ EnviroSource beneficiation cleans carbon residue and controls LOI, unlocking high-performance grades fit for air-entrained concrete in freeze-thaw climates. Titan America’s Separation Technologies division lifted fly ash revenue to USD 19.5 million in 2024, a 20% jump over 2023, underpinned by patented electrostatic separation that targets unburned carbon below 2%. Intellectual-property barriers here reinforce pricing power despite commodity headwinds.
Emergent plays revolve around multi-revenue strategies. Research on rare-earth recovery describes Indian ash with total REY content near 500 mg/kg, positioning beneficiation tailings for critical-mineral extraction, which could fund plant upgrades and offset price volatility in the traditional fly ash market. Meanwhile, small-scale flash-calcination units offer licensing opportunities to utilities wishing to monetise ash even as coal fleets shrink, sustaining supply continuity for geopolymer producers.
Fly Ash Industry Leaders
Boral
Charah Solutions,Inc
Eco Material Technologies
Heidelberg Materials
Holcim
- *Disclaimer: Major Players sorted in no particular order

Recent Industry Developments
- February 2025: Holcim confirms “Amrize” as the brand name for its North American spin-off that will encompass aggregates, cement, and fly ash-integrated building solutions.
- May 2024: Heidelberg Materials signs a definitive deal to acquire ACE Group, Malaysia’s largest pulverised fly ash supplier, to strengthen regional feedstock security.


Global Fly Ash Market Report Scope
Fly ash is a byproduct of burning pulverized coal in electricity-producing plants. The mineral impurities in the coal fuse in suspension during the combustion process and float out of the chamber with the exhaust gases. The formation of spherical glassy particles after the solidification of fused material is called fly ash. Class C and Class F are the two common types of fly ash used in concrete. Class C contains high-calcium fly ashes with less than 2% carbon content, whereas Class F are low-calcium fly ashes with less than 5% carbon content but sometimes as high as 10%. The main application of fly ash is in the construction industry, mainly used as Portland cement concrete or PCC pavement.
The fly ash market is segmented by type, application, and geography. By type, the market is segmented into class F and class C. By application, the market is segmented into construction, agriculture, mining, water treatment, and other applications. The report also covers the market size and forecasts for fly ash in 16 countries across major regions.
For each segment, the market sizing and forecasts have been done on the basis of value (USD million).
| Class F |
| Class C |
| Construction | Portland Cement and Concrete |
| Bricks and Blocks | |
| Road Construction | |
| Agriculture | |
| Mining | |
| Water Treatment | |
| Other Applications (Ceramics, Alumina Extraction) |
| Asia-Pacific | China |
| India | |
| Japan | |
| South Korea | |
| ASEAN | |
| Rest of Asia-Pacific | |
| North America | United States |
| Canada | |
| Mexico | |
| Europe | Germany |
| United Kingdom | |
| Italy | |
| France | |
| Russia | |
| Rest of Europe | |
| South America | Brazil |
| Argentina | |
| Rest of South America | |
| Middle East and Africa | Saudi Arabia |
| South Africa | |
| Rest of Middle East and Africa |
| By Type | Class F | |
| Class C | ||
| By Application | Construction | Portland Cement and Concrete |
| Bricks and Blocks | ||
| Road Construction | ||
| Agriculture | ||
| Mining | ||
| Water Treatment | ||
| Other Applications (Ceramics, Alumina Extraction) | ||
| By Geography | Asia-Pacific | China |
| India | ||
| Japan | ||
| South Korea | ||
| ASEAN | ||
| Rest of Asia-Pacific | ||
| North America | United States | |
| Canada | ||
| Mexico | ||
| Europe | Germany | |
| United Kingdom | ||
| Italy | ||
| France | ||
| Russia | ||
| Rest of Europe | ||
| South America | Brazil | |
| Argentina | ||
| Rest of South America | ||
| Middle East and Africa | Saudi Arabia | |
| South Africa | ||
| Rest of Middle East and Africa | ||


Key Questions Answered in the Report
What is the current size of the fly ash market and its growth outlook?
The fly ash market size reached USD 13.9 billion in 2026 and is projected to expand to USD 19.35 billion by 2031 at a 6.83% CAGR.
Which region dominates global demand?
Asia-Pacific commands 70.55% of global revenue thanks to large coal fleets and expansive infrastructure programs.
Why is Class C fly ash growing faster than Class F?
Class C’s self-cementing traits accelerate early-age strength, reducing chemical admixture use and supporting a 7.47% CAGR to 2031.
How do green-cement mandates influence the market?
Policies in the U.S., EU, and India impose clinker-replacement ceilings that structurally boost fly ash consumption for low-carbon concrete compliance.
Does coal plant retirement threaten long-term supply?
Retirements tighten regional availability, yet ash harvesting from legacy impoundments and captive-power expansions in ASEAN help offset the risk.
Page last updated on:


