
Tungsten Market Size and Share
Market Overview
| Study Period | 2021 - 2031 |
|---|---|
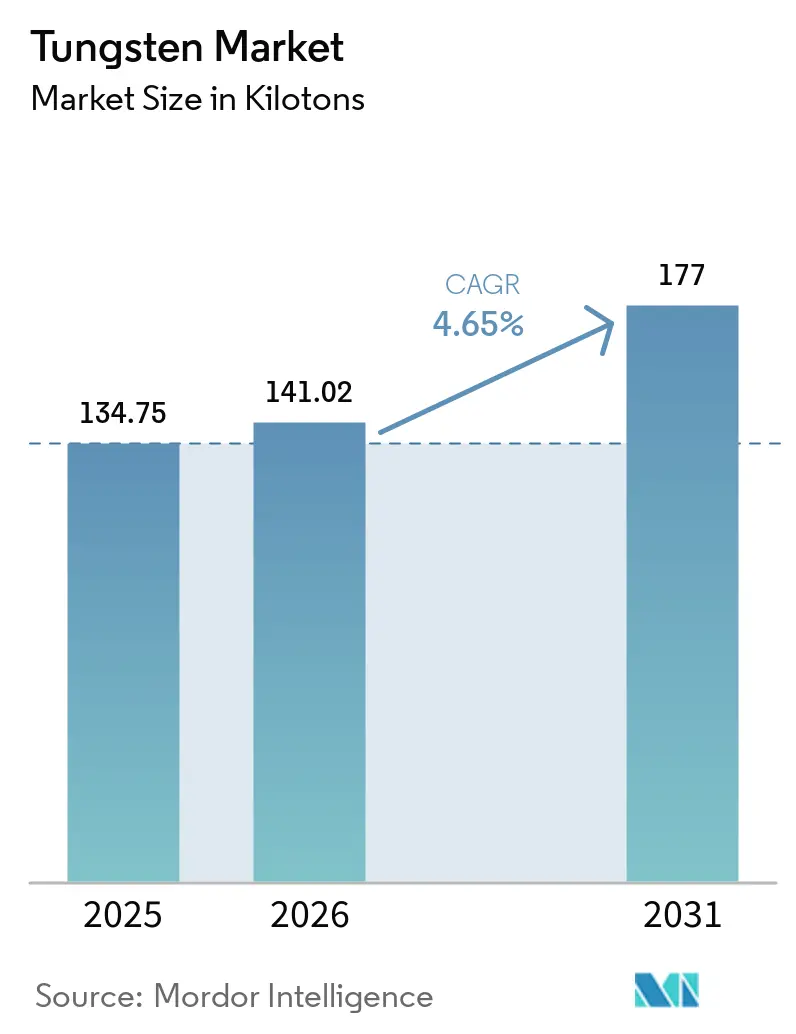
| Market Volume (2026) | 141.02 kilotons |
| Market Volume (2031) | 177 kilotons |
| Growth Rate (2026 - 2031) | 4.65 % |
| Fastest Growing Market | Asia Pacific |
| Largest Market | Asia Pacific |
| Market Concentration | Medium |
Major Players *Disclaimer: Major Players sorted in no particular order Image © Mordor Intelligence. Reuse requires attribution under CC BY 4.0. | |
Tungsten Market Analysis by Mordor Intelligence
The Tungsten Market size was valued at 134.75 kilotons in 2025 and is estimated to grow from 141.02 kilotons in 2026 to reach 177 kilotons by 2031, at a CAGR of 4.65% during the forecast period (2026-2031). Structural shifts in precision manufacturing, defense procurement, and next-generation energy storage are sustaining demand even when commodity prices soften. Wire continues to dominate in electrical-discharge machining and high-temperature furnaces, while tubes post the fastest growth as aerospace OEMs specify tungsten-alloy nozzles for hypersonic propulsion. Tungsten carbide retains a majority share thanks to cutting-tool applications, yet chemicals such as ammonium paratungstate and tungsten hexafluoride are expanding swiftly on the back of semiconductor and battery usage. Vertically integrated Chinese suppliers are broadening their reach, but recyclers in Vietnam, Rwanda, and India are easing supply-chain risk for Western buyers. Rising regulatory pressure on dust exposure and export-quota uncertainty are moderating the pace but have not derailed the long-term trajectory of the tungsten market.
Key Report Takeaways
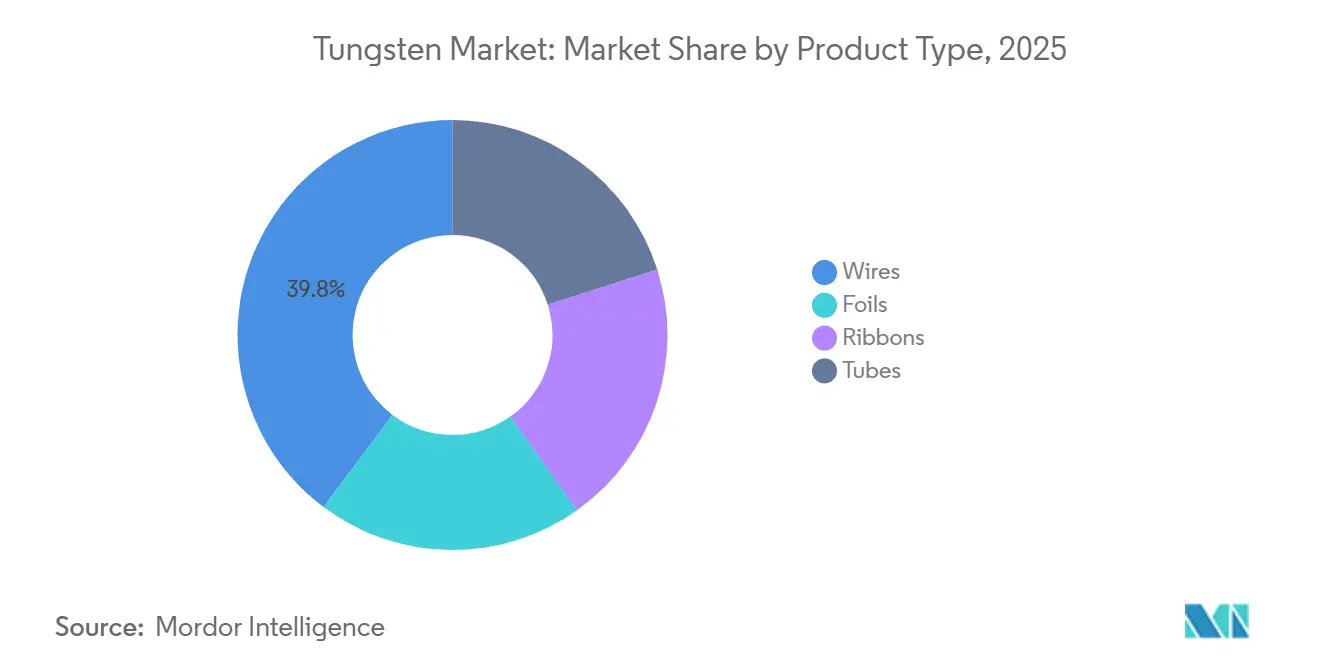
- By product type, wires held 39.75% of the Tungsten market share in 2025, whereas tubes are advancing at a 5.10% CAGR through 2031.
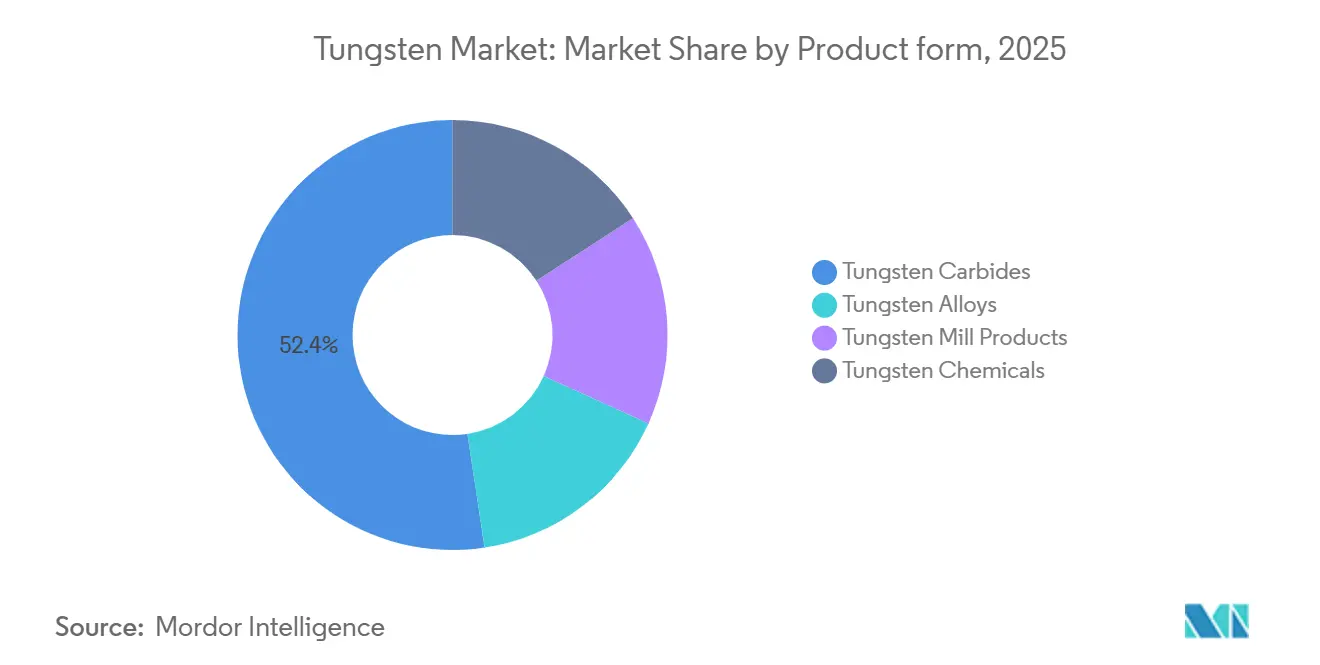
- By product form, tungsten carbide accounted for 52.38% share of the Tungsten market size in 2025; tungsten chemicals are projected to expand at 5.48% CAGR between 2026 and 2031.
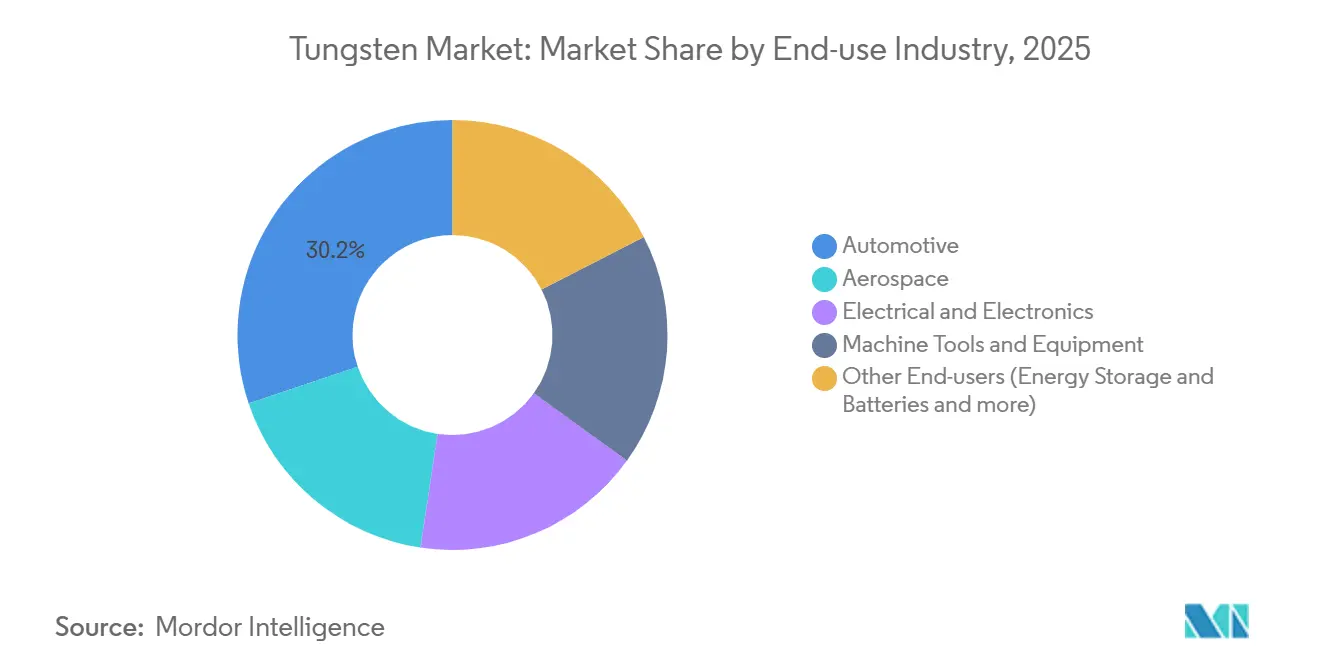
- By end-use, automotive commanded 30.16% of demand in 2025, while the other end-user industries, which include batteries and medical imaging, are growing at a 5.29% CAGR through 2031.
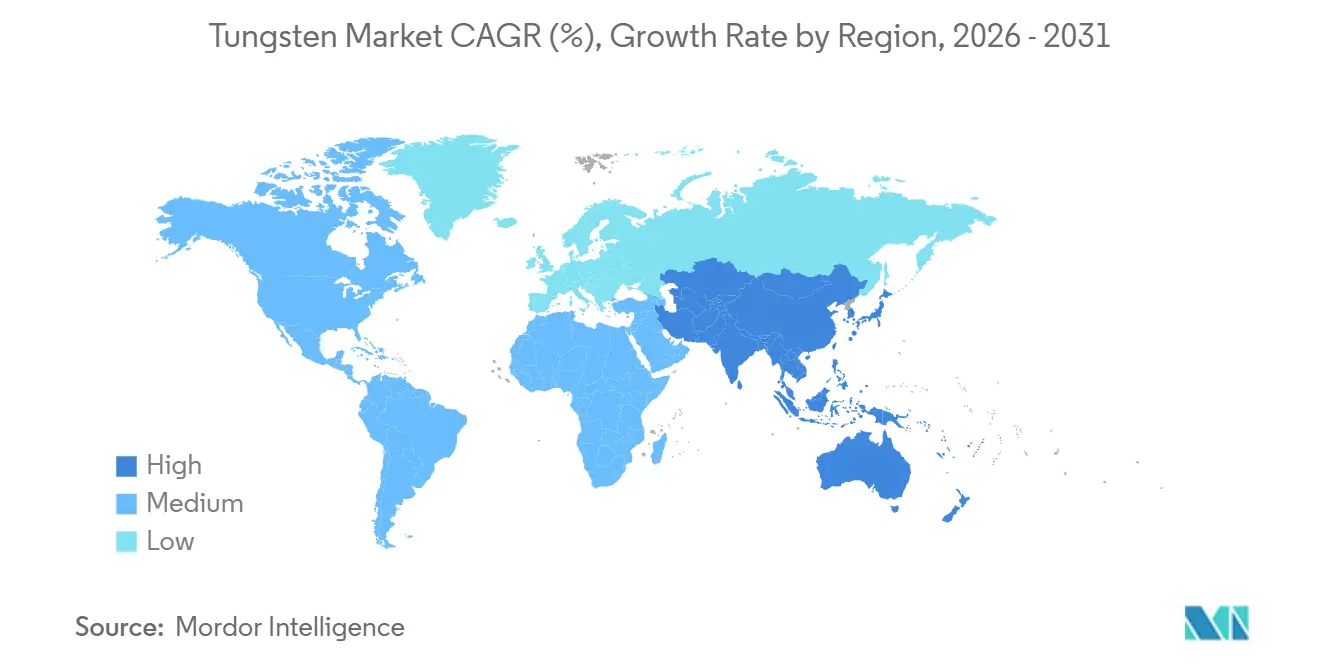
- By geography, Asia-Pacific captured 58.28% of the 2025 volume and is forecast to grow at a 5.02% CAGR to 2031.
Note: Market size and forecast figures in this report are generated using Mordor Intelligence’s proprietary estimation framework, updated with the latest available data and insights as of January 2026.
Market Trends and Insights
Drivers Impact Analysis of Tungsten Market*
| Driver | (~) % Impact on CAGR Forecast | Geographic Relevance | Impact Timeline |
|---|---|---|---|
| Cemented-carbide cutting tools in automotive and aerospace | +1.2% | Global (Germany, Japan, United States, China) | Medium term (2-4 years) |
| Electronics miniaturization with high-density interconnects | +0.9% | Taiwan, South Korea, Japan, United States | Long term (≥ 4 years) |
| Defense adoption of kinetic-energy penetrators | +0.6% | North America, Europe, India | Medium term (2-4 years) |
| Li-ion and solid-state batteries using tungsten disulfide | +0.8% | China, South Korea, Japan, United States | Long term (≥ 4 years) |
| Additive manufacturing of radiation-shielding parts | +0.5% | North America, Europe, China | Long term (≥ 4 years) |
| Source: Mordor Intelligence | |||
Demand Surge From Cemented-Carbide Cutting Tools in Automotive and Aerospace
Cemented-carbide inserts remain indispensable for machining hardened steels, titanium, and aluminum composites in powertrain and airframe components. The shift to electric vehicles raises tolerance demands on battery housings, prompting OEMs to specify ultra-fine-grain carbide grades with cobalt binders below 6 wt% to minimize magnetic interference near cells. Aerospace primes are adopting diamond-like-carbon-coated carbide end mills that cut carbon-fiber panels 25% faster while extending life beyond 10,000 parts per edge[1]. ISO 513:2024 reclassified grade nomenclature, triggering a tooling refresh cycle that keeps replacement demand buoyant. Tier-1 suppliers in Germany and Japan are consolidating purchases with integrated producers that co-engineer geometry and coatings, a dynamic that supports premium pricing.
Electronics Miniaturization Boosting High-Density Interconnects
Semiconductor manufacturers are shifting from aluminum to tungsten for via-fill and contact metallization at sub-3-nanometer nodes. Intel’s 18A process, entering high-volume production in late 2025, consumes roughly 15 g of tungsten hexafluoride per 300 mm wafer. TSMC expanded tungsten-CVD capacity by 40% in 2024 to backstop its 2 nm ramp. Samsung filed a dozen patents on atomic-layer-deposited WS₂ barriers, pointing to broader adoption of two-dimensional tungsten compounds. Advanced packaging needs—chiplets and 3D stacking—are multiplying tungsten usage per device, making electronics a resilient growth pillar for the tungsten market.
Defense Adoption of Kinetic-Energy Penetrators
Western militaries are replacing depleted-uranium rounds with tungsten-heavy alloys that offer densities of 17-18.5 g cm⁻³ minus radiological concerns. The US Army’s USD 47 million contract with Allegheny Technologies in 2024 secures billet supply through 2027[2]. India’s DRDO validated homegrown penetrators performing within 5% of uranium analogs at 1,700 m s⁻¹ impact speeds. NATO ammunition-replenishment programs are pulling forward demand and tightening spot availability, lengthening commercial lead times from 8 weeks to 14 weeks.
Li-Ion and Solid-State Batteries Using Tungsten-Disulfide Anodes
Nature Energy reported that adding 5 wt% WS₂ nanosheets tripled lithium-ion cycle life to 1,500 cycles at 1C. QuantumScape is evaluating tungsten-oxide coatings to curb interface resistance in solid-state prototypes slated for pilot trials in 2026. CATL’s 2025 patent spree on high-purity WS₂ synthesis underscores commercial intent for its Qilin cells. These battery applications underpin the fastest-growing product-form segment—tungsten chemicals—inside the broader tungsten market.
Restraints Impact Analysis of Tungsten Market*
| Restraint | (~) % Impact on CAGR Forecast | Geographic Relevance | Impact Timeline |
|---|---|---|---|
| China-centric supply volatility and export quotas | -0.8% | Global (acute in North America, Europe) | Short term (≤ 2 years) |
| Health risks from tungsten-carbide dust exposure | -0.4% | Europe, North America | Medium term (2-4 years) |
| Substitution by advanced ceramics and cermets | -0.6% | Global (cutting-tool niche) | Long term (≥ 4 years) |
| Source: Mordor Intelligence | |||
China-Centric Supply Volatility and Export Quotas
Beijing’s 2024 export-licensing rule for tungsten powder, carbide, and alloys amplified uncertainty for Western buyers. Spot prices for ammonium paratungstate rose 22% in two months before easing as European consumers drew down stocks and Vietnamese smelters boosted secondary output. The US Geological Survey highlighted tungsten as high risk since domestic mining ended in 2015, and the National Defense Stockpile holds only 15% of the authorized level. Alternative supply from Rwanda and South Korea will cover less than 8% of European demand by 2028, leaving exposure elevated.
Health Risks of Tungsten-Carbide Dust Exposure
The European Chemicals Agency added tungsten carbide with cobalt to its REACH Authorization List in 2024, requiring permits by 2027. OSHA proposed a tenfold stricter US exposure limit in 2025, pushing small shops to spend USD 50,000–200,000 on ventilation and surveillance upgrades. Some firms are switching to nickel- or iron-binder carbides, but the 10-15% lower rupture strength restricts use in interrupted cutting.
*Our forecasts treat driver/restraint impacts as directional, not additive. The impact forecasts reflect baseline growth, mix effects, and variable interactions.
Tungsten Market Segment Analysis
By Product Type:
Wire Dominance Anchored in EDM and Furnace ApplicationsWire captured 39.75% of the Tungsten market share in 2025, a lead it retains through 2031 because EDM shops and furnace builders rely on its unique high-temperature strength. Commodity filament wire is tapering with LED adoption, but precision-drawn grades for EDM and guidewires are rising 6% annually. Plansee’s 2025 lanthanum-oxide-doped wire raises recrystallization temperature to 1,800 °C, cutting scrap 12% for tool-and-die makers. Tubes are the fastest-growing product, clocking a 5.10% CAGR as hypersonic vehicle programs and MRI makers need thin-wall tungsten-rhenium thermocouples. Only four firms command rotary-swaging capabilities for sub-0.5 mm walls, creating a technological moat.
A smaller share belongs to foils and ribbons. Foils down to 0.025 mm shield X-ray sources and space electronics, while ribbons serve as evaporation boats in thin-film deposition. Demand is niche yet stable because few substitutes match tungsten’s 3,422 °C melting point. Collectively, these trends embed durable upsides for specialty manufacturers even as legacy lighting uses recede, helping the tungsten market maintain a balanced growth profile.

By Product Form:
Carbide Supremacy Challenged by Chemical-Precursor GrowthTungsten carbide commanded 52.38% of the tungsten market size in 2025, but growth is slower than the overall market. Innovation keeps margins healthy. Kennametal’s Beyond Blast inserts with sub-0.4 µm grains fetch a 25% premium. Tungsten chemicals are the breakout segment, rising 5.48% CAGR as semiconductor fabs add low-resistivity tungsten gates and battery firms scale WS₂ additives. Applied Materials saw a 35% jump in tungsten-CVD equipment orders in 2024, validating the uptrend.
Alloys and mill products serve defense, aerospace, and fusion-energy pilots. Tungsten-copper composites carrying 10–20% copper reach 180 W m⁻¹ K⁻¹ thermal conductivity, enabling 8–12% lighter EV busbars. Mill-product demand swings with furnace and fusion investments but shows a steady upward drift as India and Southeast Asia build heat-treat capacity. Together, these dynamics confirm that diversification beyond carbide is central to the sustainable expansion of the tungsten market.
By End-Use Industry:
Automotive Still Leads While Batteries and Healthcare AccelerateAutomotive applications commanded 30.16% of the Tungsten market share in 2025 as cemented-carbide tooling remained indispensable for machining powertrain and body-in-white components. The transition to electric vehicles is not eroding volume, because precision machining of high-strength aluminum housings and stainless-steel exoskeletons raises insert consumption; Tesla disclosed that each Cybertruck battery pack uses 40% more carbide inserts than a Model 3 pack owing to tougher alloys. Internal-combustion machining is sliding in Europe and North America but stays buoyant in India and Southeast Asia, where ICE vehicles still dominate new-car output. Aerospace demand, though smaller, is rising in tandem with the 1,050 narrow-body jets Boeing and Airbus delivered in 2024, each requiring roughly 18 kg of tungsten for cutting tools, turbine-blade inserts, and landing-gear bushings.
The other category, encompassing batteries, medical imaging, and oncology, expanded the fastest at a 5.29% CAGR and is steadily enlarging its share of the overall tungsten market size. Lithium-ion and solid-state battery makers now blend tungsten-disulfide nanosheets and tungsten-oxide coatings into electrodes and separators; CATL’s Qilin cell adopted WS₂ interlayers that lifted energy density 13% to 255 Wh kg⁻¹ in 2024. Hospitals are upgrading to tungsten-rhenium X-ray targets that last 30% longer than pure-tungsten parts, trimming downtime and maintenance costs for radiology suites. Oncology centers are also adopting 3D-printed tungsten collimators for intensity-modulated radiotherapy, shrinking lead times from 12 weeks to 3 weeks and reinforcing long-term demand for additive-grade powders.
Geography Analysis
APAC Tungsten Market
Asia-Pacific controlled 58.28% of 2025 volume and is on a 5.02% CAGR path to 2031. China integrates 75% of carbide and 90% of ammonium-paratungstate refining, pricing exports 25–35% below Western levels even after tariffs. India labeled tungsten a critical mineral in 2024 and fast-tracked Degana, targeting 1,800 t yr⁻¹ by 2028. Japan’s JPY 1.8 trillion machine-tool orders in 2024 keep ultra-fine-grain carbide demand buoyant. South Korean memory fabs push tungsten-CVD consumption as SK Hynix and Samsung expand 3D-NAND layers.
North America Tungsten Market
North America's lack of domestic mine output keeps exposure high, but a USD 200 million Defense Production Act allocation in 2024 aims to seed refining and recycling capacity. Canada’s Almonty will feed North American toolmakers when Sangdong starts in 2027. Mexico’s USD 5.2 billion auto FDI boom in 2024 raises carbide-tool needs for nearshored machining lines.
EMEA and LATAM Tungsten Market
In Europe, German producers face Chinese carbide imports priced 30% lower even after a 6.5% anti-dumping duty. The 2024 Critical Raw Material Act mandates 15% recycled tungsten by 2030, prompting Umicore’s EUR 45 million Hoboken upgrade to process 3,000 t yr⁻¹ of scrap. Russian concentrate stays mostly domestic due to sanctions, while Rwanda’s newly commissioned concentrator feeds European smelters. Outside the big three regions, Latin America, Africa, and the Middle East jointly supplied around 8% of global volume, with Bolivia and Rwanda as notable contributors.
Value Chain Analysis
The tungsten value chain begins with mining and beneficiation of scheelite and wolframite concentrates, followed by chemical conversion into ammonium paratungstate (APT) and oxides, then reduction to tungsten metal powder and carburization to tungsten carbide. Midstream capacity is concentrated in China, where vertically integrated groups connect concentrate sourcing, APT and powder, and downstream hardmetals and toolmaking, which tightens interdependence across domestic suppliers. Disruptions in feed relationships underline this sensitivity, for example the reported tailings-supply cessation affecting Xiamen Tungsten.
Downstream, powders and carbides are processed into mill products (wire, rod, sheet, and tubes) and cemented-carbide tools, and some ultra-high-purity intermediates such as tungsten hexafluoride (WF6) are used in semiconductor deposition. Outside China, processing and powder qualification increasingly rely on certified scrap loops and imported concentrates to meet specifications in aerospace, defense, semiconductor, and battery applications. Plansee Group, through Global Tungsten & Powders, is re-anchoring Western supply chains by linking recycling and processing with finished components and tools, while Vietnam is emerging as an alternate processing hub, including via Masan High-Tech Materials at its Nui Phao site and a supplier network spanning more than 20 sources. Midstream ownership and tolling options also shift, as shown by the December 2025 transfer of a 99.97% stake in Hengyang Yuanjing Tungsten Co., Ltd. from China Minmetals Tungsten Group to China Tungsten and Hightech Materials Co., Ltd.
Competitive Landscape
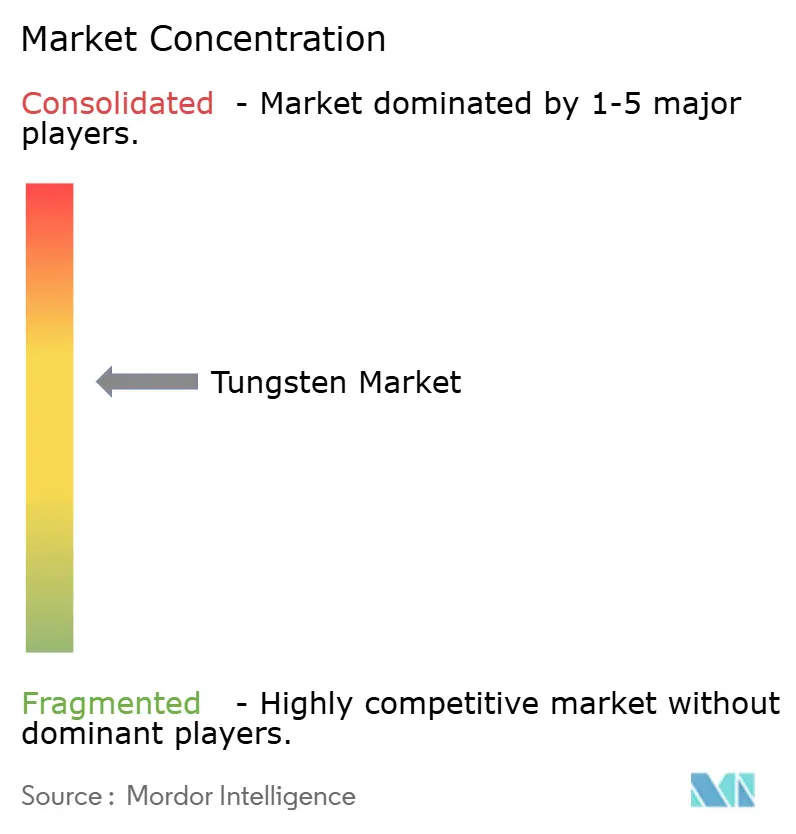
The Tungsten market is moderately concentrated. Chinese leaders integrate mine to carbide-tool lines, letting them offer bundled contracts; Xiamen Tungsten internally consumes 68% of its carbide output, reducing exposure to spot swings. Western rivals pull ahead on engineering service and digital machining twins—Kennametal’s NOVO platform predicts insert life within 5%, cutting downtime and justifying 20-25% premiums. Process automation widens the gap between top players, who control density uniformity to ±0.2%, and smaller firms that still run batch-mode sintering. This divergence is likely to spur acquisitions as integrated majors hunt recycling capacity and niche alloy know-how.
Tungsten Industry Leaders
-
Xiamen Tungsten Co., Ltd.
-
China Minmetals Non-Ferrous Metals Co.
-
China Molybdenum Co., Ltd.
-
H.C. Starck Tungsten GmbH
-
Global Tungsten & Powders Corp.
- *Disclaimer: Major Players sorted in no particular order
Tungsten Market Companies Covered in this Report
- A.L.M.T. Corp.
- Allegheny Technologies Inc.
- Avis Metal Industries Limited
- Betek GmbH and Co. KG
- Buffalo Tungsten Inc.
- China Minmetals Non-Ferrous Metals Co.
- China Molybdenum Co., Ltd.
- Chongyi Zhangyuan Tungsten Co.
- Elmet Technologies
- Global Tungsten and Powders
- Guangdong XiangLu Tungsten Co.
- H.C. Starck Tungsten GmbH
- International Metalworking Companies
- Jiangxi Tungsten Holding Group
- Jiangxi Yaosheng Tungsten
- Kennametal Inc.
- Nippon Tungsten Co., Ltd.
- Ormonde Mining plc
- Plansee SE
- QuesTek Innovations LLC
- Sandvik AB
- Treibacher Industrie AG
- Umicore N.V.
- Wolf Minerals Ltd.
- WOLFRAM Company JSC
- Xiamen Tungsten Co., Ltd.
Market Opportunities and Future Outlook
The main opportunities center on securing qualified non-Chinese feedstock and high-purity processing for tungsten chemicals used in advanced electronics, while also expanding circular supply to reduce exposure to export controls and quota uncertainty. Several industry actions in 2026 point in that direction. Plansee Group and Manhattan Five Partners LLC moved to set up a US joint venture around a strategic tungsten oxide stockpile, alongside a production-capacity expansion at Global Tungsten & Powders (GTP) in Towanda, Pennsylvania, to 12,000 tons per year. In parallel, Almonty Industries amended its Sangdong (South Korea) offtake with GTP, increasing contracted volumes by 40% and extending the term, strengthening the mine-to-powder linkage for downstream carbide, defense, and specialty-chemical customers.
Recycling-led growth is another pathway anchored in policy and operating metrics. The EU Critical Raw Material Act target of 15% recycled tungsten by 2030 aligns with demonstrated industrial performance, including CERATIZIT reporting a 91% tungsten recycling rate in its 2024/25 fiscal year, which suggests headroom for higher-spec scrap sorting, powder requalification, and closed-loop tooling programs. Expanding concentrate sourcing into established processors also supports near-term commercial routes, as shown by Masan High-Tech Materials (Vietnam) partnering with GB Innovation (South Korea) to process Korean tungsten concentrate. On the demand side, semiconductor node scaling and advanced packaging keep the value of reliable WF6 and precursor supply high, and 2026 supply disruptions in Japan, including WF6 line shutdowns tied to 6N powder shortages, reinforce the premium for resilient, qualified chemical-grade tungsten supply chains.
Recent Industry Developments in Tungsten Market
- July 2026: Kanto Denka and Central Glass initiated permanent shutdowns of tungsten hexafluoride (WF6) production lines after shortages of Chinese 6N-grade tungsten powder constrained operations. The action tightened availability of a critical semiconductor precursor and reinforced how high-purity tungsten chemical chains depend on a limited set of upstream powder sources.
- April 2026: China-to-Japan exports of metallic tungsten powder, tungsten oxide, and related electronic specialty gases recorded zero volumes for three consecutive months, including shipments associated with Xiamen Tungsten-linked flows. The stoppage increased supply risk for Japanese downstream users in electronics and specialty chemicals and drove greater attention to alternate sourcing and inventory strategies across Asia.
- October 2025: The United States backed Cove Kaz Capital Group LLC's private bid for Kazakhstan's Upper Kairakty and North Katpar tungsten deposits, competing against state-backed Chinese contenders. The initiative pointed to a push to diversify mine supply away from China-centric chains, with the announcement framed around a 2027 procurement deadline.
Tungsten Market Report Scope and Research Methodology
Market Definition and Coverage
For this report, the tungsten market is defined as the demand and supply of tungsten across common commercial forms, tracked through volumes sold into industrial uses and converted into comparable market totals.
Scope exclusions: We exclude unrelated substitute materials and do not count downstream finished tools or components beyond the tungsten content itself.
Segments Covered in This Report
- By Product Type
- Foils
- Ribbons
- Wires
- Tubes
- By Product Form
- Tungsten Carbides
- Tungsten Alloys
- Tungsten Mill Products
- Tungsten Chemicals
- By End-use Industry
- Automotive
- Aerospace
- Electrical and Electronics
- Machine Tools and Equipment
- Other End-users (Energy Storage and Batteries, Medical Imaging and Oncology)
- By Geography
- Asia-Pacific
- China
- Japan
- India
- South Korea
- Rest of Asia-Pacific
- North America
- United States
- Canada
- Mexico
- Europe
- Germany
- United Kingdom
- France
- Italy
- Russia
- Rest of Europe
- Rest of the World
- South America
- Middle East and Africa
- Asia-Pacific
Data Sources, Market Sizing, and Validation
Desk Research
Desk research was used to build the basic tungsten market map and to anchor the model with consistent external reference points. We leaned on public production, reserves, and trade signals, then connected them to the major processing routes that convert ore and scrap into usable tungsten products.
Typical inputs came from non-paywalled sources such as USGS Mineral Commodity Summaries, UN Comtrade trade statistics, national geological surveys, and customs and tariff publications. We also used technical bodies and peer-reviewed metallurgy journals to describe processing yields and recovery rates. In parallel, we reviewed company annual reports and investor presentations, plus industry association releases and reputed business press, to understand capacity changes and operating conditions. Paid subscriptions were used selectively for company financials and intelligence, shipment-level import and export checks, and patent databases to identify activity shifts in key applications. The examples above are illustrative, and we also consulted other sources to collect data, validate assumptions, and clarify open questions.
Primary Interviews and Surveys
Primary work focused on confirming what desk sources cannot show cleanly, including how volumes move by product form, how scrap availability shifts purchasing behavior, and how pricing moves through contract cycles. We spoke with a mix of upstream and downstream participants and cross-checked inputs across major consuming and producing regions, so our assumptions stayed realistic for both spot and contract behavior.
Distribution of primary research fieldwork respondents
| Company type | Respondent position | Region |
|---|---|---|
| Top tier: 31% | CXOs: 15% | APAC: 43% |
| Mid tier: 48% | Functional/Unit leaders: 33% | EMEA: 32% |
| Smaller Players: 21% | Managers: 52% | Americas: 25% |
Market-Sizing & Forecasting
Sizing started with a top-down build that reconstructs the demand pool from global tungsten volume flows, then ties those flows to the key product forms covered in the study and to their typical conversion yields. Once the demand pool was formed, we corroborated totals using selective bottom-up approximations, such as sampled supplier volume disclosures, channel checks with distributors and processors, and volume-by-application splits validated in interviews.
To keep the model market-specific, inputs included mine production and refinery throughput signals, scrap collection and recycling share, conversion factors across concentrates to intermediate products, and end-use indicators that affect tungsten pull-through. These included cutting and wear part activity and industrial machinery output. Where data gaps exist by country or form, we used conservative proxy splits guided by trade patterns and expert feedback, then rebalanced the results to match global totals.
Forecasts were built using scenario analysis, with a base case guided by expected industrial activity and supply-side additions. Assumptions on capacity ramps, recycling availability, and demand sensitivity by major use were reviewed with industry respondents, then applied consistently across the forecast horizon.
Data Validation & Update Cycle
Outputs were checked through triangulation across independent signals, including production totals and trade direction, typical yield math, and interview feedback on utilization and procurement behavior. When the model showed unusual jumps by year or region, we revisited the input drivers, re-checked unit conversions, and re-contacted sources if the variance could not be explained by a known event.
Before sign-off, results go through a multi-step internal review so assumptions, arithmetic, and boundary choices remain consistent across sections. Reports are refreshed annually, and interim updates are made when material events occur, such as major capacity changes, policy shifts, or sharp pricing moves. Right before delivery, an analyst performs a final pass so clients receive the latest updated view.
Mordor Intelligence's Tungsten Market Sizing Compared With Other Published Estimates
Published tungsten market estimates often differ because the market can be expressed in volumes, in value, or as a mix of both, and each choice changes the final number. Differences also come from what is counted as tungsten, how recycled material is treated, and whether downstream finished goods are indirectly included.
Trade flow direction, mine production totals, and typical conversion yields are the checks that keep Mordor Intelligence aligned to a volume-based definition. That is also why some value-heavy estimates do not match this study's current-year figure.
Benchmark comparison
| Source | Market Size | Gaps in Research Methodology |
|---|---|---|
| Mordor Intelligence | USD 0.14 M (2026) | |
| Industry Data Release A | USD 5.16 B (2024) | This estimate is presented as a value number and likely blends multiple tungsten product groups with pricing assumptions that can move sharply by year. It can also reflect downstream value capture rather than only tungsten volumes. |
| Market Report B | USD 3.20 B (2025) | The scope is described in broad end-use and form terms, which can lead to mixed counting of intermediate chemicals and finished tungsten-containing products. The base year and currency timing can shift totals even if volumes are similar. |
The table indicates that much of the spread comes from unit choice and boundary choices, not from disagreement on demand direction. By keeping the model anchored on physical volumes, then validating splits with repeatable external signals and interview checks, the sizing stays traceable to steps that can be reviewed and updated.
Key Questions Answered in the Report
How large is the tungsten market?
The tungsten market size reached 141.02 kilotons in 2026 and is forecast at 177 kilotons by 2031.
What is the expected growth rate for tungsten demand?
Global demand is projected to expand at a 4.65% CAGR between 2026 and 2031.
Which product type leads consumption?
Wire products lead with 39.75% share in 2025, primarily due to EDM and furnace uses.
Why are tungsten chemicals growing faster than carbide?
Semiconductor interconnects and battery additives require high-purity chemicals, driving a 5.48% CAGR for the segment.
Which region dominates supply and demand?
Asia-Pacific holds 58.28% of global volume in 2025, with China integrating most mining and carbide capacity.