Tonometer Market Size and Share
Market Overview
| Study Period | 2020 - 2031 |
|---|---|
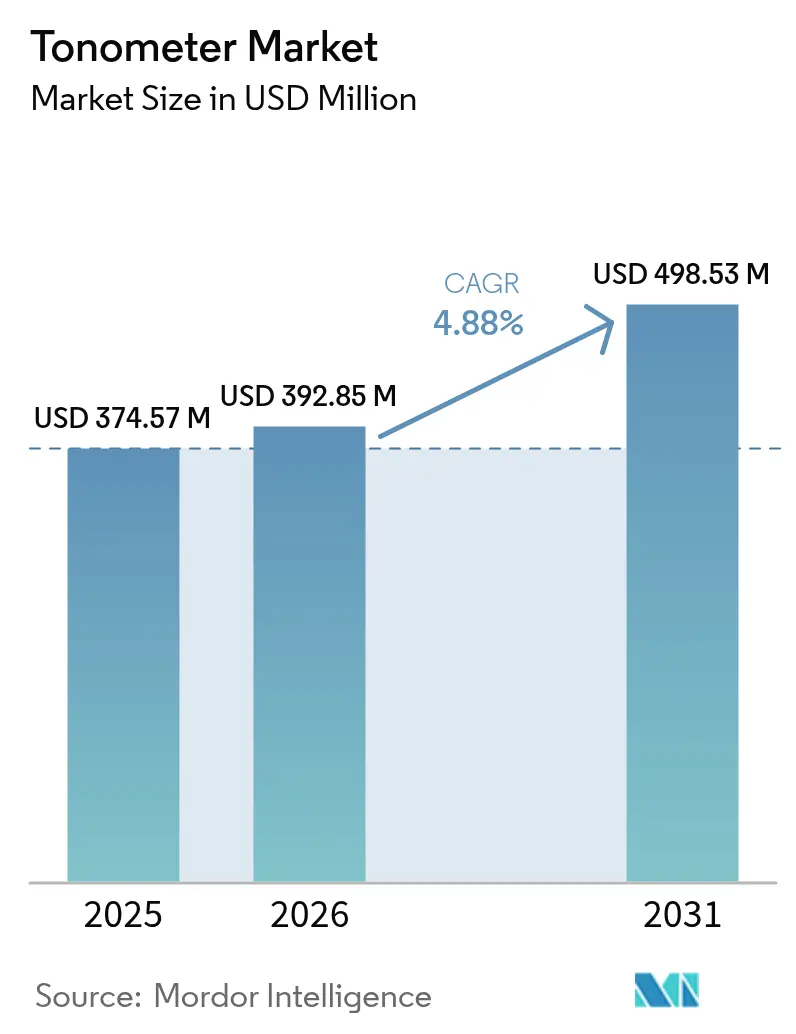
| Market Size (2026) | USD 392.85 Million |
| Market Size (2031) | USD 498.53 Million |
| Growth Rate (2026 - 2031) | 4.88% CAGR |
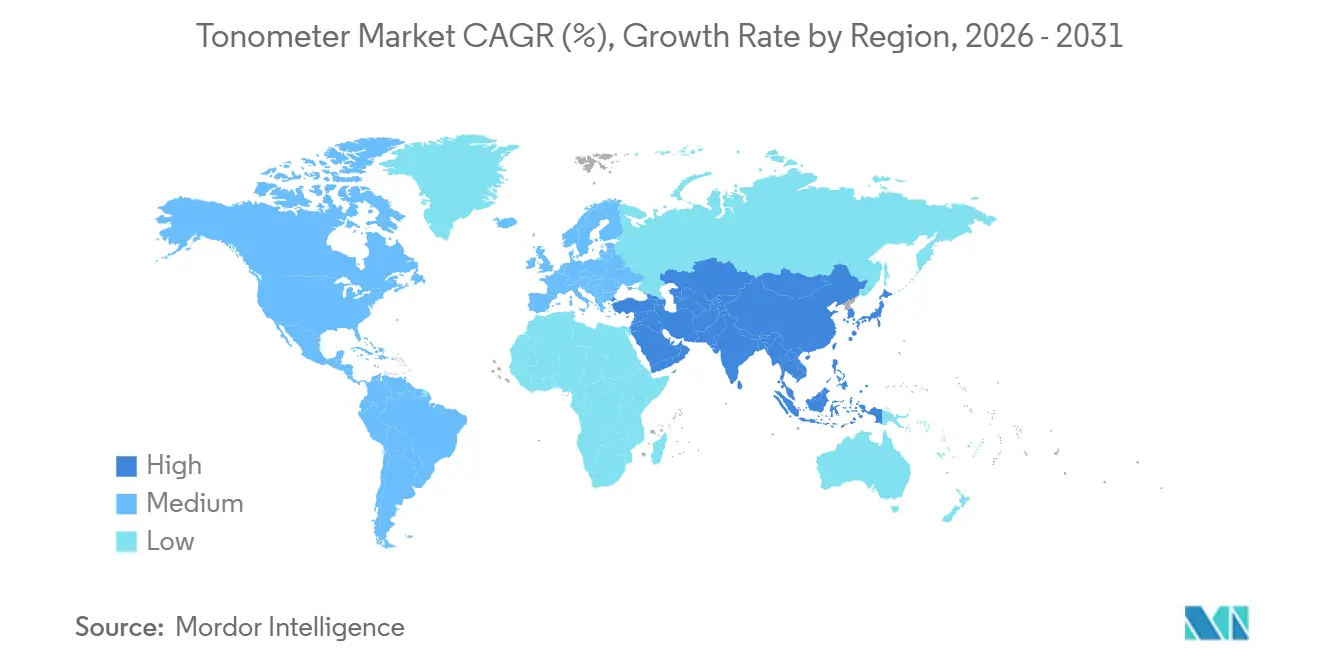
| Fastest Growing Market | Asia Pacific |
| Largest Market | North America |
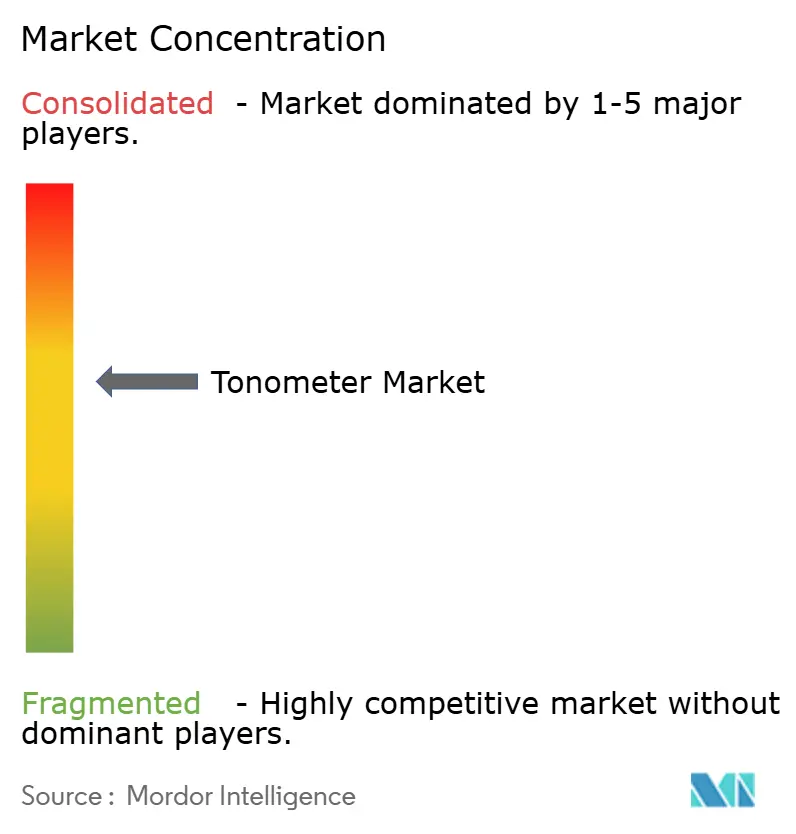
| Market Concentration | Medium |
Major Players *Disclaimer: Major Players sorted in no particular order Image © Mordor Intelligence. Reuse requires attribution under CC BY 4.0. | |
Tonometer Market Analysis by Mordor Intelligence
The Tonometer Market size is expected to increase from USD 374.57 million in 2025 to USD 392.85 million in 2026 and reach USD 498.53 million by 2031, growing at a CAGR of 4.88% over 2026-2031.
Three key drivers are shaping this market trajectory: the aging population is significantly increasing glaucoma prevalence in developed economies; the adoption of portable rebound tonometers is extending screening capabilities beyond tertiary care facilities; and the implementation of continuous intra-ocular pressure (IOP) monitoring networks is shifting care delivery from periodic office visits to home-based monitoring. Market demand is further supported by the World Health Organization's estimate that at least 1 billion cases of vision impairment are either preventable or currently untreated, with glaucoma contributing to 6.9 million cases of moderate-to-severe distance vision loss. In 2025, North America accounted for 41.56% of the market revenue, driven by Medicare reimbursement for CPT codes 92100 and 0198T. The Asia-Pacific region, on the other hand, is the fastest-growing market, with a 5.65% CAGR, fueled by the expansion of primary eye-care infrastructure in China and India.
Key Report Takeaways
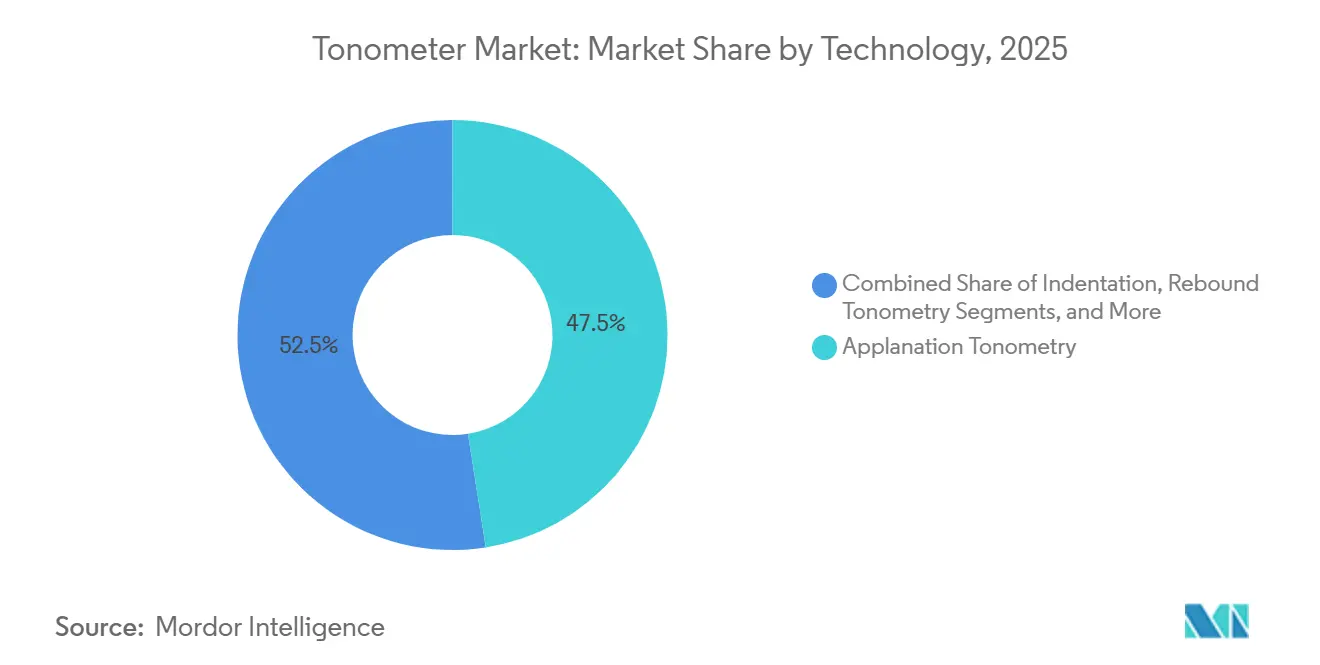
- By technology, applanation tonometry led with 47.52% revenue share in 2025, while rebound tonometry is projected to expand at a 6.74% CAGR through 2031.
- By portability, desktop systems accounted for 67.54% revenue share in 2025, whereas handheld devices are forecast to grow at a 7.87% CAGR through 2031.
- By measurement type, direct methods retained 62.54% share in 2025, and indirect approaches are advancing at a 6.88% CAGR during 2026-2031.
- By end user, hospitals held 54.32% of demand in 2025, yet ophthalmic centers and eye-care chains are expected to rise at a 7.65% CAGR through 2031.
- By geography, North America led with 41.56% of the tonometer market share in 2025; Asia-Pacific is on track to post the highest regional CAGR at 5.65% between 2026 and 2031.
Note: Market size and forecast figures in this report are generated using Mordor Intelligence’s proprietary estimation framework, updated with the latest available data and insights as of 2026.
Global Tonometer Market Trends and Insights
Drivers Impact Analysis*
| Driver | (~) % Impact on CAGR Forecast | Geographic Relevance | Impact Timeline |
|---|---|---|---|
| Escalating Global Glaucoma Incidence | +1.2% | Global, highest in North America, Europe, Japan, South Korea, China | Long term (≥ 4 years) |
| Demographic Aging and Diabetes Surge | +1.4% | Global, pronounced in North America, Europe, Asia-Pacific | Long term (≥ 4 years) |
| Proliferation of Mass Vision-Screening Initiatives | +0.9% | India, China, Southeast Asia, parts of Africa and South America | Medium term (2-4 years) |
| Advancements in Non-Contact and Portable Technologies | +1.1% | Early adoption in North America and Europe, rapid scaling in Asia-Pacific | Short term (≤ 2 years) |
| Growing Adoption of Tele-Ophthalmology Services | +0.8% | North America, Europe, expanding in Asia-Pacific | Medium term (2-4 years) |
| Emergence of Continuous IOP-Monitoring Ecosystems | +0.6% | North America, Europe first, Asia-Pacific next | Long term (≥ 4 years) |
| Source: Mordor Intelligence | |||
Escalating Global Glaucoma Incidence
Glaucoma caused 3.61 million cases of blindness and 4.14 million cases of moderate-to-severe vision impairment worldwide as of 2020, and the U.S. Centers for Disease Control and Prevention projects that domestic glaucoma cases will double by 2050 as baby boomers age. While blindness rates are declining, the share of partial vision loss is rising, suggesting earlier detection but inconsistent treatment adherence. Health systems therefore prioritize routine tonometry at the primary, secondary, and tertiary levels to protect optic nerve function. The WHO’s SPECS 2030 program, launched in 2024, targets 80% screening coverage among people with diabetes, thereby indirectly expanding the tonometry user base, as diabetes heightens glaucoma risk. Adoption is further supported by ISO 8612 and ISO 16672, which govern the accuracy and interoperability of applanation and non-contact devices, respectively, providing confidence for mass-screening rollouts.
Demographic Aging and Diabetes Surge
U.S. Census Bureau data show that the population aged 65 and older will increase from 56.1 million in 2020 to 73.1 million by 2030, with the 75-to-84-year cohort expanding at a 4.5% CAGR and the 85-plus bracket at 2.8% CAGR[1]U.S. Census Bureau, “2020 National Population Projections,” census.gov. These age groups exhibit cataract prevalence near 70% and a seven-fold jump in glaucoma risk, driving recurrent IOP assessments. In parallel, the International Diabetes Federation places global diabetes prevalence at 536.6 million in 2021, rising to 783.2 million by 2045, and diabetic retinopathy already accounts for 1.07 million blindness cases. Diabetes and aging are synergistic threats that multiply glaucoma incidence through micro-vascular changes and raised IOP, creating a structural tailwind for the tonometer market. National Vision, which operates more than 1,200 U.S. optical stores, disclosed in its 2024 investor update that it is scaling remote examination capacity to accommodate surging demand from older and diabetic patients. These demographic pressures are secular, insulating demand from near-term economic swings.
Advancements in Non-Contact and Portable Technologies
A scoping review of 216 studies spanning 1975-2024 found that 90.3% of portable tonometry investigations examined agreement with Goldmann applanation tonometry, with handheld rebound units demonstrating acceptable concordance for community screening. Revenio Group’s iCare Home device yields correlation coefficients of 0.75-1.00 against Goldmann and captures diurnal IOP variation, which standard office visits can miss. In July 2024, researchers validated a prototype optical IOP sensor that requires no corneal contact, hinting at an infection-free future generation of tonometers[2]PubMed, “Rebound Tonometry: Systematic Agreement Analysis,” nih.gov. These innovations reduce anesthesia time, enhance patient comfort, and enable task shifting to technicians or community health workers, extending coverage into retail optometry, pharmacies, and mobile clinics. As a result, portable and non-contact designs are not incremental upgrades but catalysts that recalibrate the entire tonometer market distribution model.
Emergence of Continuous IOP-Monitoring Ecosystems
The ARGOS-03 study of Implandata’s EYEMATE-IO implantable sensor, which logged an average 7,283 self-measurements per patient over 2.88 years, showed that peak IOP and IOP fluctuation correlated tightly with retinal nerve fiber layer thinning, whereas in-office Goldmann results did not. FDA-cleared Sensimed Triggerfish revealed that 69% of participants hit their highest IOP during sleep and that 73% required therapy changes based on 24-hour data. While device cost and training needs limit near-term uptake to refractory glaucoma cases, sensor miniaturization and wireless connectivity are pushing continuous monitoring toward routine care, carving a distinct growth lane within the broader tonometer market.
Restraints Impact Analysis*
| Restraint | (~) % Impact on CAGR Forecast | Geographic Relevance | Impact Timeline |
|---|---|---|---|
| Infection Risks and Accuracy Gaps in Contact and Air-Puff Systems | -0.7% | Global, magnified in high-volume hospital settings | Short term (≤ 2 years) |
| High Acquisition and Maintenance Costs | -0.9% | Price-sensitive Asia-Pacific, Africa, South America | Medium term (2-4 years) |
| Measurement Variability from Corneal Biomechanics | -0.5% | Global, affects specialty decision-making | Long term (≥ 4 years) |
| Supply-Chain Volatility for Precision Sensors | -0.4% | Global, manufacturing centered in Asia | Short term (≤ 2 years) |
| Source: Mordor Intelligence | |||
Infection Risks and Accuracy Gaps in Contact and Air-Puff Systems
Applanation probes that contact the cornea must be disinfected between patients to curb adenovirus and herpes transmission, and the CDC mandates 70% isopropyl alcohol wipes with a multi-minute dwell time for each tip[3]Centers for Disease Control and Prevention, “Infection Control in Healthcare Facilities,” cdc.gov. Compliance slows patient flow and, if corners are cut, raises legal exposure. Air-puff systems circumvent contact but display IOP shifts of 1-2 mmHg for every 10-micrometer change in central corneal thickness, producing false positives in thick corneas and false negatives in thin corneas. Consequently, clinics are pivoting to single-use tips and rebound devices that auto-calibrate for corneal properties, and vendors that fail to address infection and accuracy shortcomings risk being delisted from institutional purchasing contracts.
High Acquisition and Maintenance Costs
Desktop applanation or dynamic contour tonometers range from USD 3,000-15,000 upfront, and annual service contracts typically equal 10-15% of purchase price. Because Medicare reimbursement for CPT 92100 has remained largely flat and glaucoma-procedure fees under 22 separate codes fell 20.5% between 2000 and 2020, payback periods for new equipment are stretching, especially for sole practitioners. National Vision reported in its 2024 financials that higher optometrist labor and equipment costs shaved 20 basis points off gross margin, illustrating cost pressure even among scaled retailers. Market responses bifurcate: premium brands bundle tonometry within subscription-priced diagnostic suites to spread capital costs, while low-cost entrants push handheld rebound units at USD 1,500-3,000 for price-sensitive buyers. Practices unwilling to invest outsource tonometry to mobile services or refer patients to ophthalmic centers, fragmenting the historical ownership model.
*Our forecasts treat driver/restraint impacts as directional, not additive. The impact forecasts reflect baseline growth, mix effects, and variable interactions.
Segment Analysis
By Technology: Rebound Gains as Applanation Plateaus
Applanation systems accounted for 47.52% of the tonometer market share in 2025, reflecting their entrenched position in hospital glaucoma clinics. Rebound units, however, are advancing at a 6.74% CAGR to 2031, two points above the overall tonometer market, due to anesthesia-free operation, five-second measuring cycles, and suitability for pediatric and uncooperative populations. Indentation tonometry remains largely intraoperative and is losing ground to rebound devices, which offer similar portability and better repeatability. Dynamic contour technology, priced between USD 10,000 and 15,000, has strong uptake in corneal pathology cases but remains niche. Prototypes that use optical coherence elastography or trans-pupillary light probes occupy less than 5% combined share yet signal innovation momentum. The World Health Organization’s 2024 VESIH manual promotes portable diagnostics for low-resource settings and favors rebound designs in government tenders. Established vendors such as Carl Zeiss Meditec responded by adding seamless electronic-record integration to their newest refractor-tonometer combos, showing how digital connectivity is fast becoming a baseline requirement.
The Tonometer market size for rebound technology is projected to add USD 39 million between 2026 and 2031, and practitioners adopting these devices typically reduce chair time per patient by 20%. Clinics that integrate rebound tonometry into point-of-care kiosks in retail stores capture incremental screenings that may convert into full exams. As a result, rebound technology is reframing the commercial battleground around software features, cloud analytics, and patient-engagement apps rather than purely optical engineering.


By Measurement Type: Indirect Methods Narrow the Gap
Direct measurement retained 62.54% value share in 2025, anchored by Goldmann, rebound, and dynamic contour modalities. Indirect methods—air-puff and transpalpebral devices—are expanding at a 6.88% CAGR, driven by infection-control and comfort considerations. Transpalpebral systems like Diaton permit IOP checks through the eyelid without local anesthetic, making them suitable for post-corneal-surgery and contact-lens patients, but with ±3 mmHg variability that relegates them to screening. Retail chains favor air-puff units for their throughput, despite modest precision loss, because they can process up to 60 patients per hour. Clinics in emerging markets increasingly buy dual-mode packages that include both direct and indirect heads, minimizing workflow bottlenecks. The indirect tonometer market size is forecast to reach USD 186 million by 2031. Vendors providing calibration algorithms that compensate for corneal thickness will likely gain share once peer-reviewed validation data accumulate.
Indirect approaches improve patient experience, shorten waiting lines, and reduce infection risk, yet they also generate follow-up referrals when elevated IOP must be confirmed by applanation. This two-step pathway increases overall device utilization, reinforcing demand across both measurement types rather than cannibalizing it.
By Portability Type: Handheld Devices Disrupt Desktop Dominance
Desktop models still held 67.54% of revenue in 2025 because they are integrated into slit-lamp workstations. Handheld devices, however, are rising at a 7.87% CAGR and could approach parity by the next decade. A handheld rebound unit priced at USD 2,500 costs far less than a desktop system plus slit-lamp and frees clinicians to shift testing into waiting rooms or outreach vans. A meta-analysis of 216 studies confirms that handheld devices show acceptable agreement with the Goldmann method, easing concerns about accuracy trade-offs. Retail optical chains such as National Vision cite portable diagnostics as pivotal in reducing exam cycle time, enhancing network capacity without additional lanes.
The tonometer market share for handheld units is expected to climb to roughly 45% by 2031. Beyond cost, portability enables new care models: community health workers can perform IOP checks during home visits, and chronic-disease patients can self-test under tele-ophthalmology supervision. Desktop incumbents respond by embedding tonometry heads into multimodal imaging platforms to preserve value, but price-sensitive buyers may still pivot to standalone handheld products.

By End User: Ophthalmic Centers Outpace Hospitals
Hospitals accounted for 54.32% of 2025 demand, yet growth momentum tilts toward ophthalmic centers and retail chains, which are advancing at a 7.65% CAGR thanks to private-equity roll-ups and vertically integrated care paths. These centers prioritize devices that auto-export results into electronic health records and synchronize with optical coherence tomography images to enable high-throughput flow. Carl Zeiss Meditec’s 2025 EUR 10 million investment for a 10% stake in Ocumeda, a tele-ophthalmology platform linking 700 European optical stores, underscores this connectivity imperative. Home-care devices remain under 10% of volume but are logging the fastest relative growth, as continuous IOP sensors and self-use rebound tonometers prove their clinical worth. Hospitals, facing reimbursement compression and outpatient migration, may cede share unless they retool around integrated, AI-enabled diagnostics.
Retail-focused ophthalmic chains integrate handheld tonometers with virtual refraction and automated lens-selection systems, cutting per-exam labor by up to 25%. As such, end-user segmentation is splintering into high-volume chains purchasing low-cost handhelds and specialty centers absorbing premium, multimodal desktops.
Geography Analysis
North America accounted for 41.56% of the tonometer market revenue in 2025, driven by universal insurance coverage for tonometry and mature glaucoma-screening protocols. Nevertheless, CMS data highlight a 20.5% decline in glaucoma diagnostic reimbursement between 2000 and 2020, squeezing margins and sharpening price sensitivity. Device vendors now bundle tonometry with OCT and biometry under subscription models to sustain capital sales. High adoption of AI-ready platforms differentiates suppliers, as illustrated by Carl Zeiss Meditec’s legal win against a Topcon code extractor that solidifies its software moat. Canada largely mirrors U.S. demand patterns, though provincial formularies add reimbursement variability.
Europe follows with steady but slower growth. Germany, France, the United Kingdom, and Italy collectively dominate purchases, supported by CE-mark norms that favor multi-vendor interoperability. The European Medicines Agency and national e-health strategies encourage integration of IOP data into longitudinal patient records, stimulating upgrades to cloud-connected desktops. Regional austerity policies cap capital budgets, yet aging populations and national diabetic retinopathy programs sustain baseline demand.
Asia-Pacific is expanding at 5.65% CAGR and will add more absolute tonometer units than any other region by 2031. China’s Healthy China 2030 plan subsidizes primary eye-care equipment in county hospitals, and India’s National Program for Control of Blindness endorses mobile-screening vans equipped with handheld rebound devices. Japan’s super-aged society records the highest per-capita IOP test rates, but Korean and Taiwanese programs are rapidly converging. The region’s tonometer market size is expected to cross USD 140 million by 2031. Price sensitivity steers clinics toward handheld models, yet tertiary Chinese hospitals adopt premium dynamic contour units, creating a bifurcated opportunity spectrum. Africa and South America, while smaller, receive spillover supply as vendors expand distribution networks to drive volume growth.

Competitive Landscape
The tonometer market is moderately fragmented. The top five suppliers—Carl Zeiss Meditec, Topcon, Revenio/iCare, Nidek, and Reichert—collectively hold about 60% share, with hundreds of regional and startup firms dividing the remainder. Strategic focus is shifting from hardware differentiation to data-platform control. Carl Zeiss Meditec’s FORUM integrates imaging, surgical, and diagnostic data into one cloud workspace, locking buyers into its ecosystem. Topcon’s Harmony platform, delivered on Microsoft Azure, embeds oculomic AI algorithms to detect systemic diseases from eye images, broadening the value proposition beyond glaucoma. Revenio leverages EyRIS’s SELENA+ AI in its ILLUME suite to automate diabetic-retinopathy triage, demonstrating how smaller players use partnerships to stay competitive.
White-space opportunities center on continuous IOP monitoring, self-testing, and low-cost, portable units for emerging markets. Implandata’s EYEMATE-IO targets refractory-glaucoma patients and could spawn annuity revenue from sensor-data subscriptions. Startups racing to produce non-contact optical devices aim to leapfrog infection-control barriers. FDA Class II predicates keep entry barriers manageable, but vendors must prove software usability and electromagnetic safety, favoring those with seasoned regulatory teams. As tonometry embeds into multimodal diagnostic workflows, pure-play tonometer firms face the risk of commoditization unless they pivot into software, analytics, or subscription services.
Tonometer Industry Leaders
Haag-Streit Group
Topcon Corporation
Revenio Group Plc (iCare)
AMETEK Inc. (Reichert)
Carl Zeiss Meditec AG
- *Disclaimer: Major Players sorted in no particular order

Recent Industry Developments
- November 2025: Topcon Healthcare, Inc., one of the global leaders in ophthalmic medical devices and digital health solutions, announced the U.S. FDA 510(k) clearance and commercial launch of OMNIA, a fully automated 4-in-1 pretesting solution that seamlessly integrates objective refraction, keratometry, tonometry, and pachymetry into a single compact device.
- September 2024: iCare announced the release of the iCare ST500, a slit-lamp-based tonometer that brings the features of iCare’s rebound tonometry technology into a modern design.
- May 2024: Reichert Technologies announced the availability of the Tono-Vera Tonometer with ActiView Positioning System in the United States. Tono-Vera is a new handheld tonometer designed to provide quick, automated, and reliable IOP measurements utilizing rebound tonometer technology, which eliminates the need for topical anesthetic.


Global Tonometer Market Report Scope
As per the scope of the report, the tonometer is an instrument used to determine intraocular pressure, or the pressure of the fluid within the eye. Tonometry is a diagnostic test primarily used to detect glaucoma.
The tonometer market is segmented by technology (application tonometry, indentation tonometry, rebound tonometry, and other technologies), portability type (desktop and handheld), end user (hospitals and ophthalmic centers), type (direct and indirect), and geography (North America, Europe, Asia-Pacific, Middle East and Africa, and South America). The market report also covers the estimated market sizes and trends for 17 countries across major regions globally. The report offers the value (in USD million) for the above segments.
| Applanation Tonometry |
| Indentation Tonometry |
| Rebound Tonometry |
| Dynamic Contour Tonometry |
| Other Technologies |
| Direct |
| Indirect |
| Desktop |
| Handheld |
| Hospitals |
| Ophthalmic Centers & Eye-Care Chains |
| Home-Care / Self-Monitoring |
| Other End-Users |
| North America | United States |
| Canada | |
| Mexico | |
| Europe | Germany |
| United Kingdom | |
| France | |
| Italy | |
| Spain | |
| Rest of Europe | |
| Asia-Pacific | China |
| Japan | |
| India | |
| Australia | |
| South Korea | |
| Rest of Asia-Pacific | |
| Middle East & Africa | GCC |
| South Africa | |
| Rest of Middle East & Africa | |
| South America | Brazil |
| Argentina | |
| Rest of South America |
| By Technology | Applanation Tonometry | |
| Indentation Tonometry | ||
| Rebound Tonometry | ||
| Dynamic Contour Tonometry | ||
| Other Technologies | ||
| By Measurement Type | Direct | |
| Indirect | ||
| By Portability Type | Desktop | |
| Handheld | ||
| By End User | Hospitals | |
| Ophthalmic Centers & Eye-Care Chains | ||
| Home-Care / Self-Monitoring | ||
| Other End-Users | ||
| Geography | North America | United States |
| Canada | ||
| Mexico | ||
| Europe | Germany | |
| United Kingdom | ||
| France | ||
| Italy | ||
| Spain | ||
| Rest of Europe | ||
| Asia-Pacific | China | |
| Japan | ||
| India | ||
| Australia | ||
| South Korea | ||
| Rest of Asia-Pacific | ||
| Middle East & Africa | GCC | |
| South Africa | ||
| Rest of Middle East & Africa | ||
| South America | Brazil | |
| Argentina | ||
| Rest of South America | ||


Key Questions Answered in the Report
How fast is the tonometer market expected to grow between 2026 and 2031?
The market is projected to expand at a 4.88% CAGR, adding roughly USD 105 million in new revenue.
Which technology segment shows the strongest momentum?
Rebound tonometry is forecast to register a 6.74% CAGR, the fastest among all technology categories.
Why are handheld tonometers gaining traction?
Handheld devices lower capital cost, eliminate the need for slit-lamp stations, and allow screening in retail stores, mobile clinics, and home settings.
What role will continuous IOP monitoring play?
Implantable or wearable sensors are moving from research to clinical routines because they capture peak and fluctuation patterns that office visits often miss.
Which region presents the highest growth opportunity?
Asia-Pacific, driven by expanding primary eye-care infrastructure in China and India, is expected to grow at a 5.65% CAGR through 2031.
How has reimbursement pressure influenced purchasing decisions?
Flat or declining reimbursement rates push practices toward multimodal, subscription-priced diagnostic suites and cost-efficient handheld devices.
Page last updated on:


