Thyroid Cancer Therapeutics Market Size and Share
Market Overview
| Study Period | 2020 - 2031 |
|---|---|
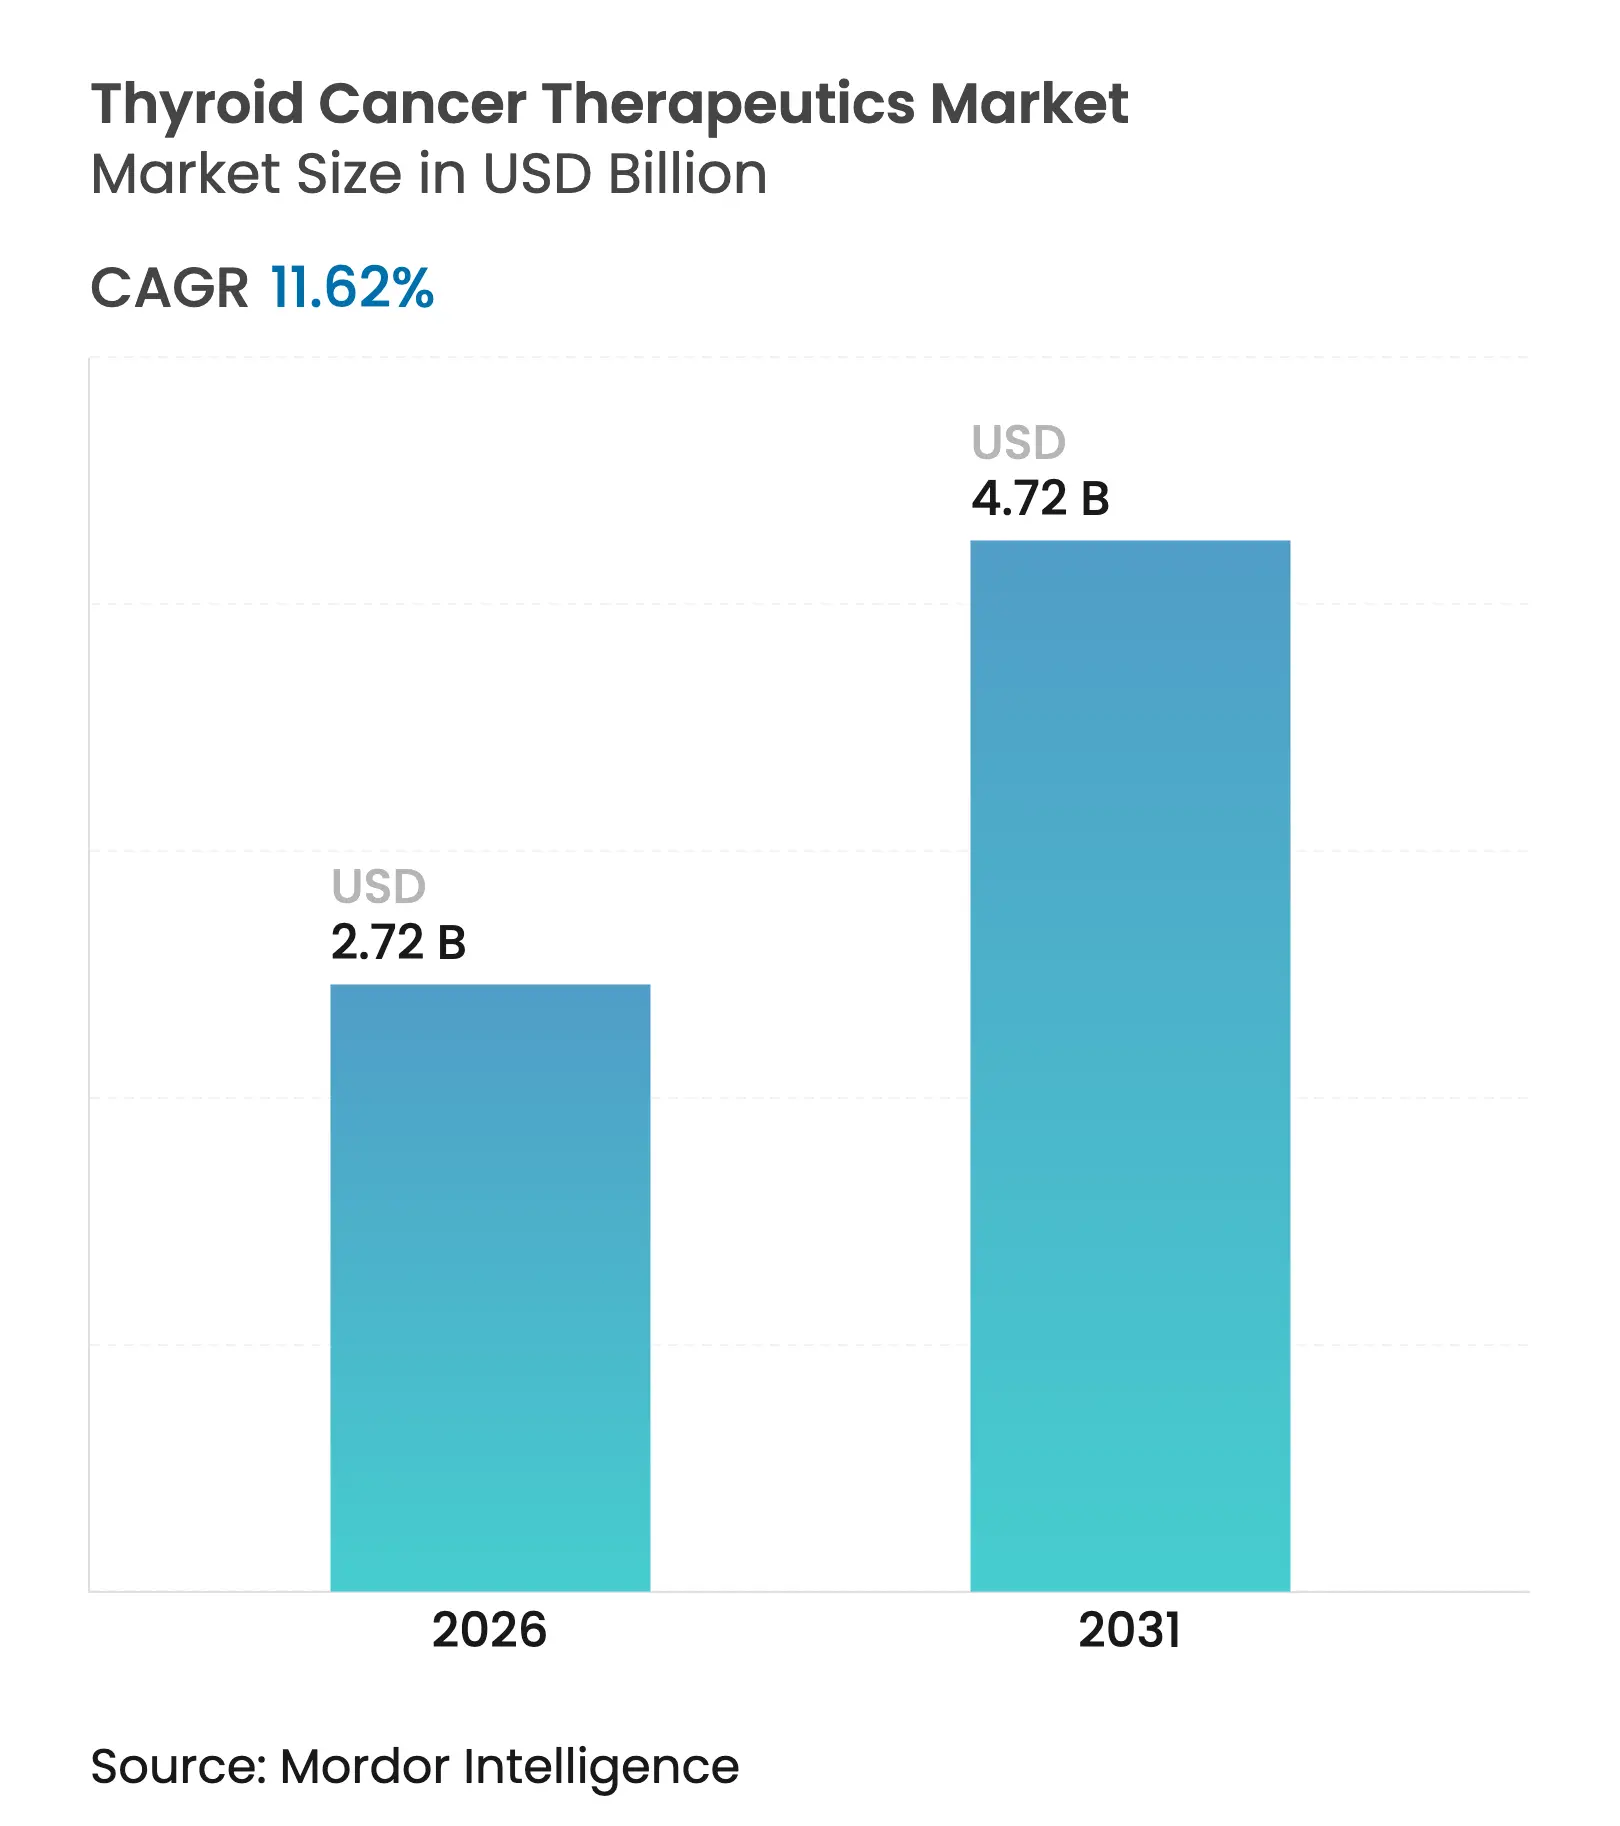
| Market Size (2026) | USD 2.72 Billion |
| Market Size (2031) | USD 4.72 Billion |
| Growth Rate (2026 - 2031) | 11.62 % CAGR |
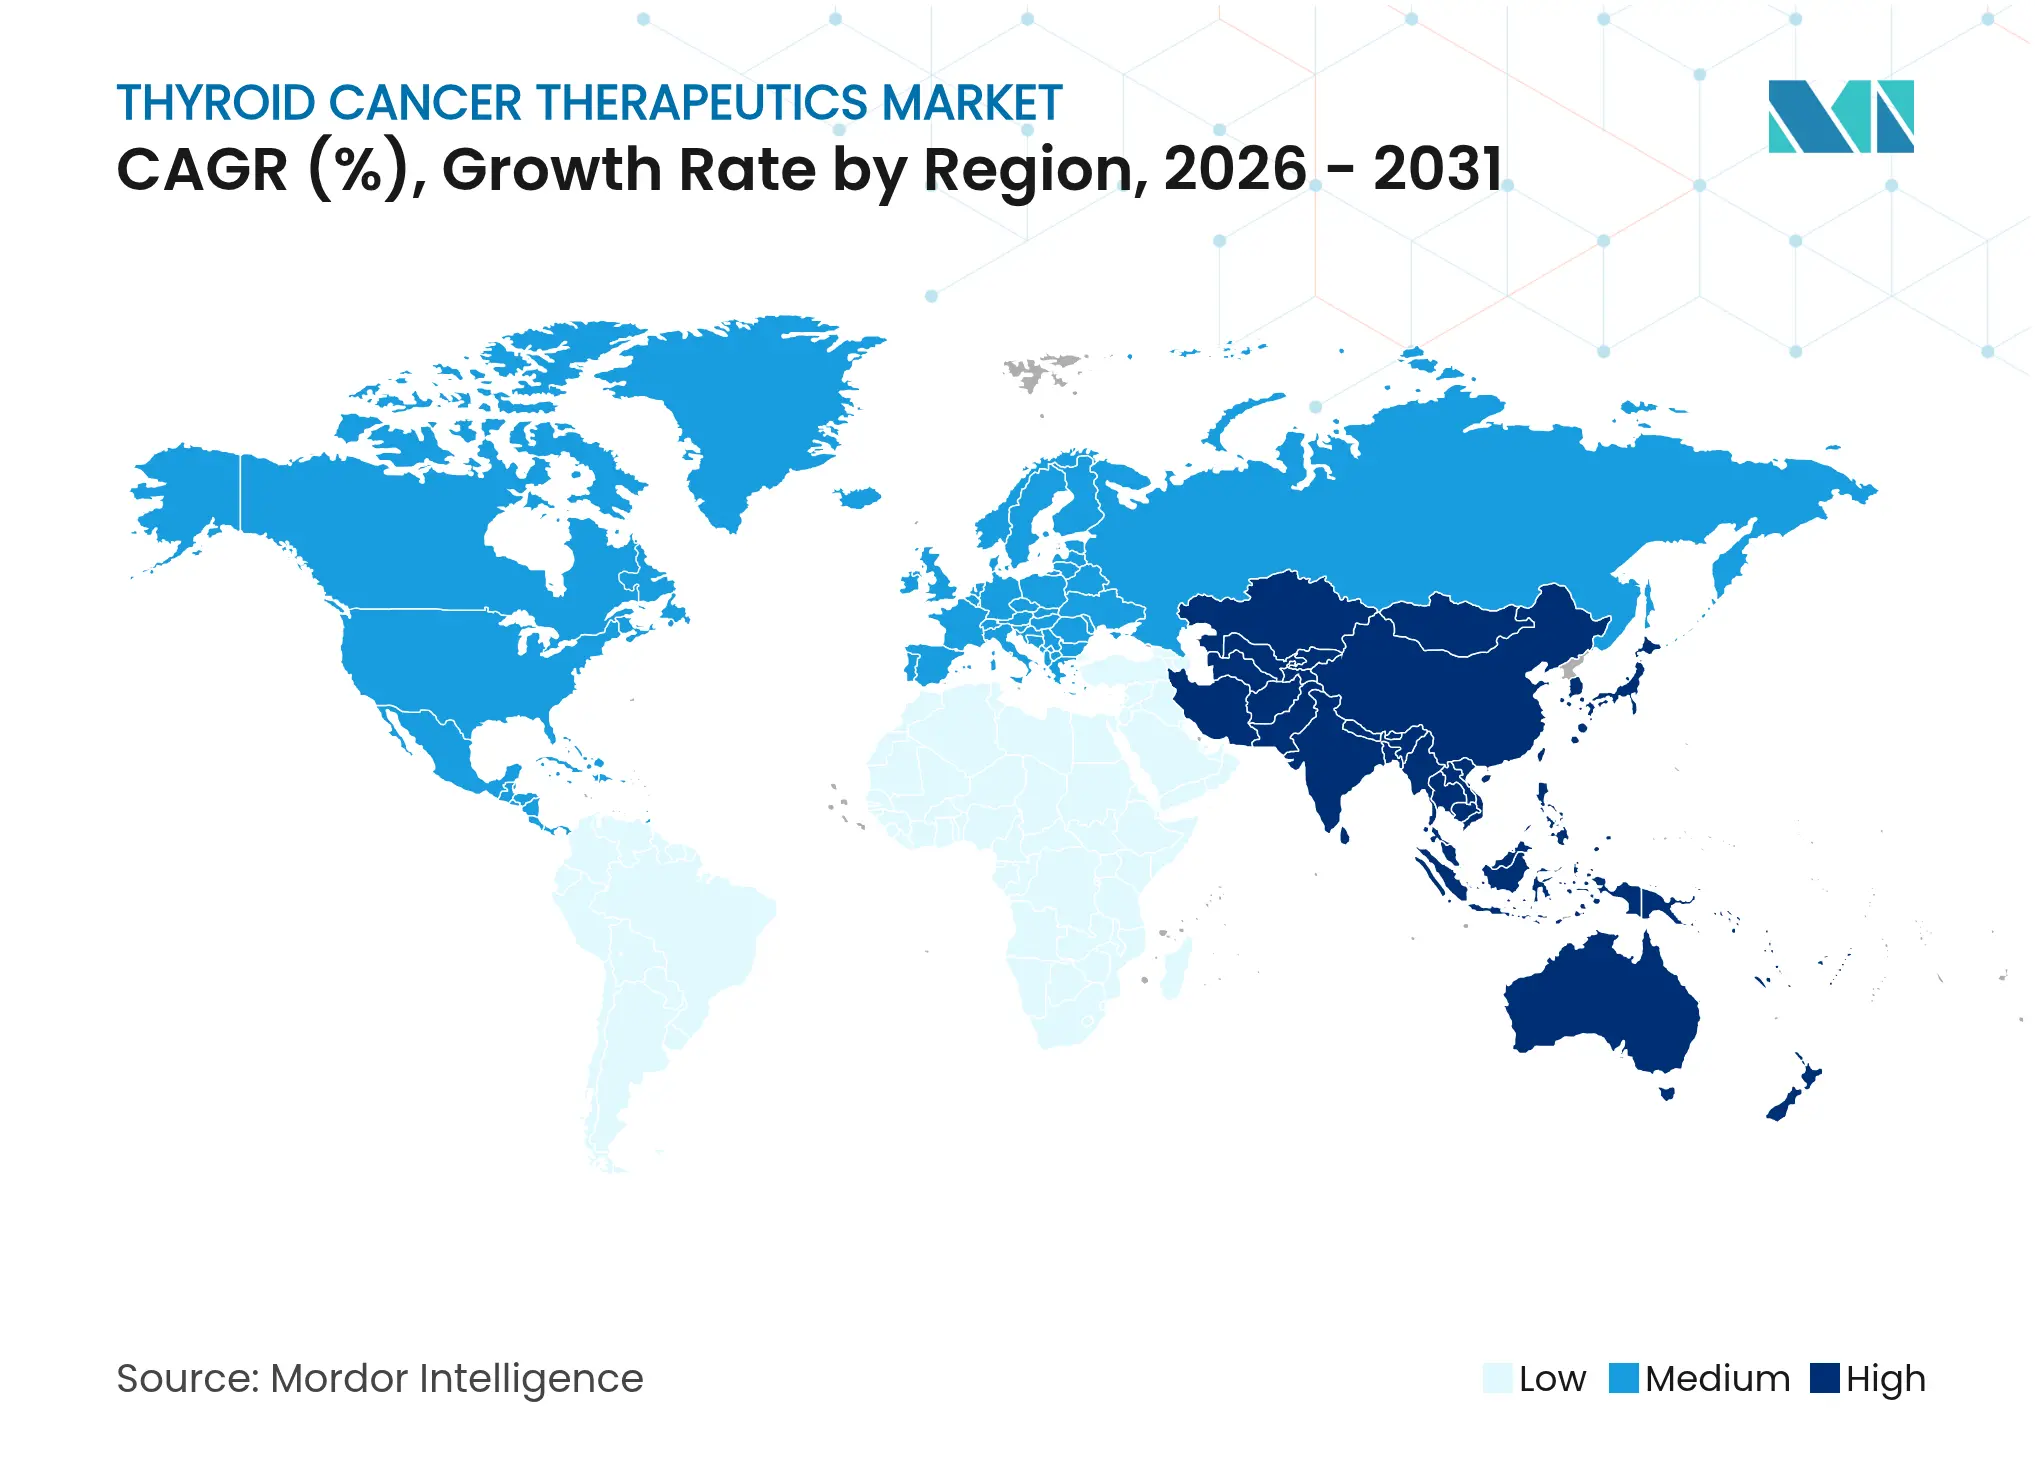
| Fastest Growing Market | Asia Pacific |
| Largest Market | North America |
| Market Concentration | Medium |
Major Players *Disclaimer: Major Players sorted in no particular order. Image © Mordor Intelligence. Reuse requires attribution under CC BY 4.0. |
Thyroid Cancer Therapeutics Market Analysis by Mordor Intelligence
The thyroid cancer therapeutics market size is expected to grow from USD 2.44 billion in 2025 to USD 2.72 billion in 2026 and is forecast to reach USD 4.72 billion by 2031 at 11.62% CAGR over 2026-2031. This steady climb reflects the combined impact of rising global disease incidence, earlier detection, and the commercialization of highly selective targeted and radiotheranostic agents. Precision approaches that overcome radioiodine resistance now complement older radioiodine regimens, enabling durable responses in difficult-to-treat cases. Rapid regulatory approvals, favorable reimbursement shifts, and the scale-up of isotope supply chains reinforce the momentum, while hospital systems and outpatient centers adapt to deliver complex therapies efficiently. In parallel, strategic acquisitions in radiopharmaceuticals and alpha-emitting ligands reshape competitive positioning, indicating continued capital flow into the thyroid cancer therapeutics market.
Key Report Takeaways
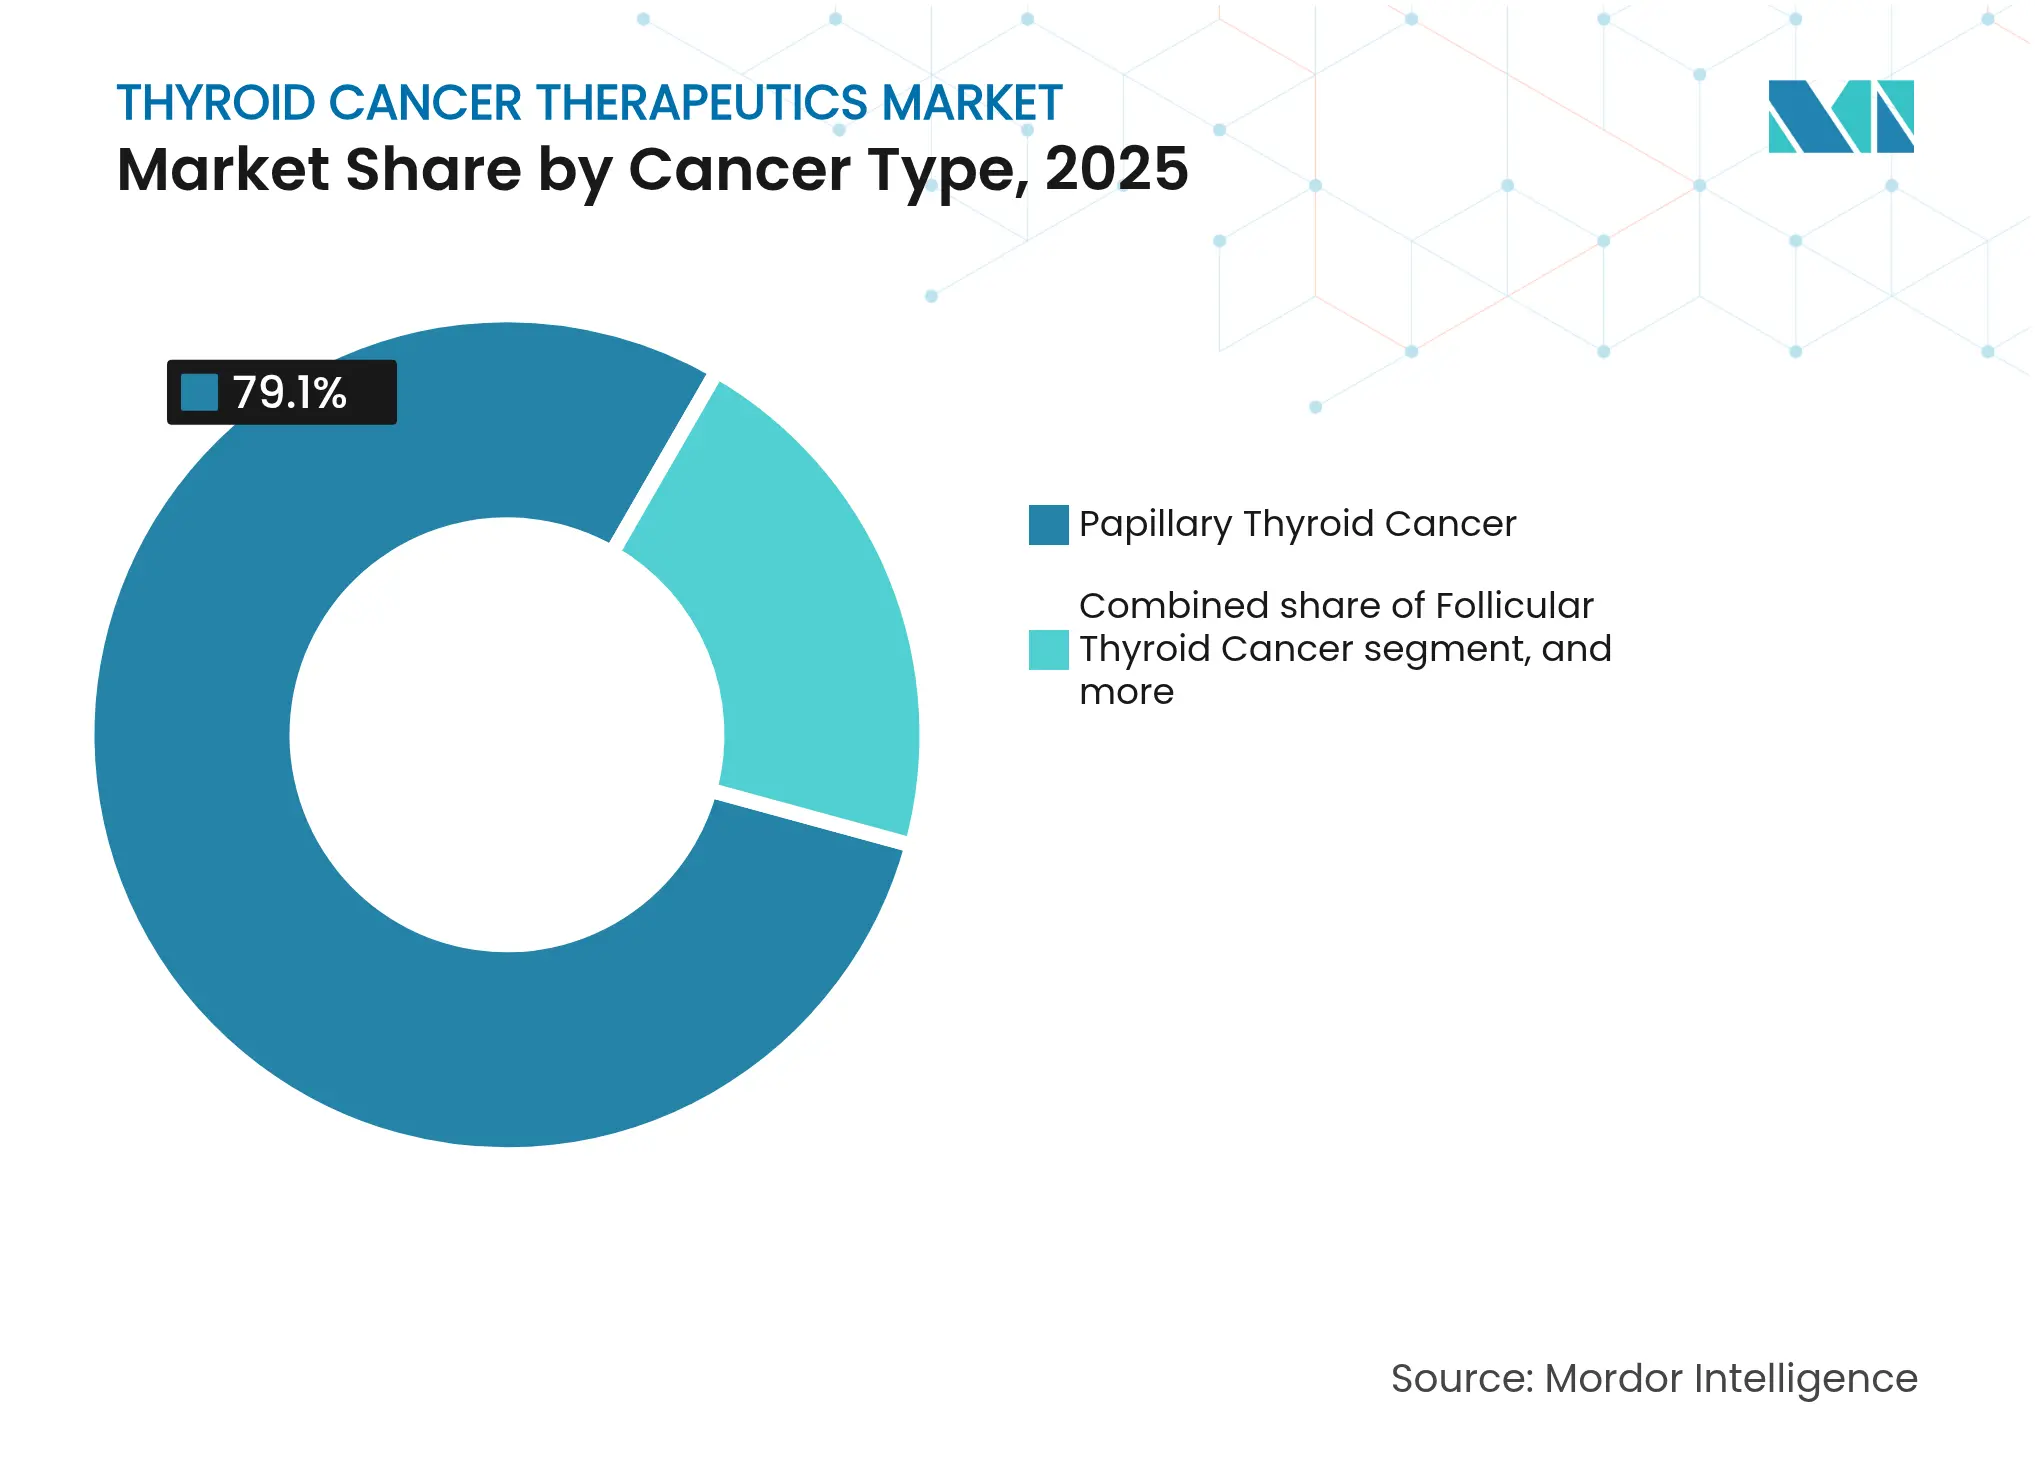
- By cancer type, papillary disease led with 79.10% revenue share in 2025, whereas anaplastic is forecast to expand at a 11.98% CAGR through 2031.
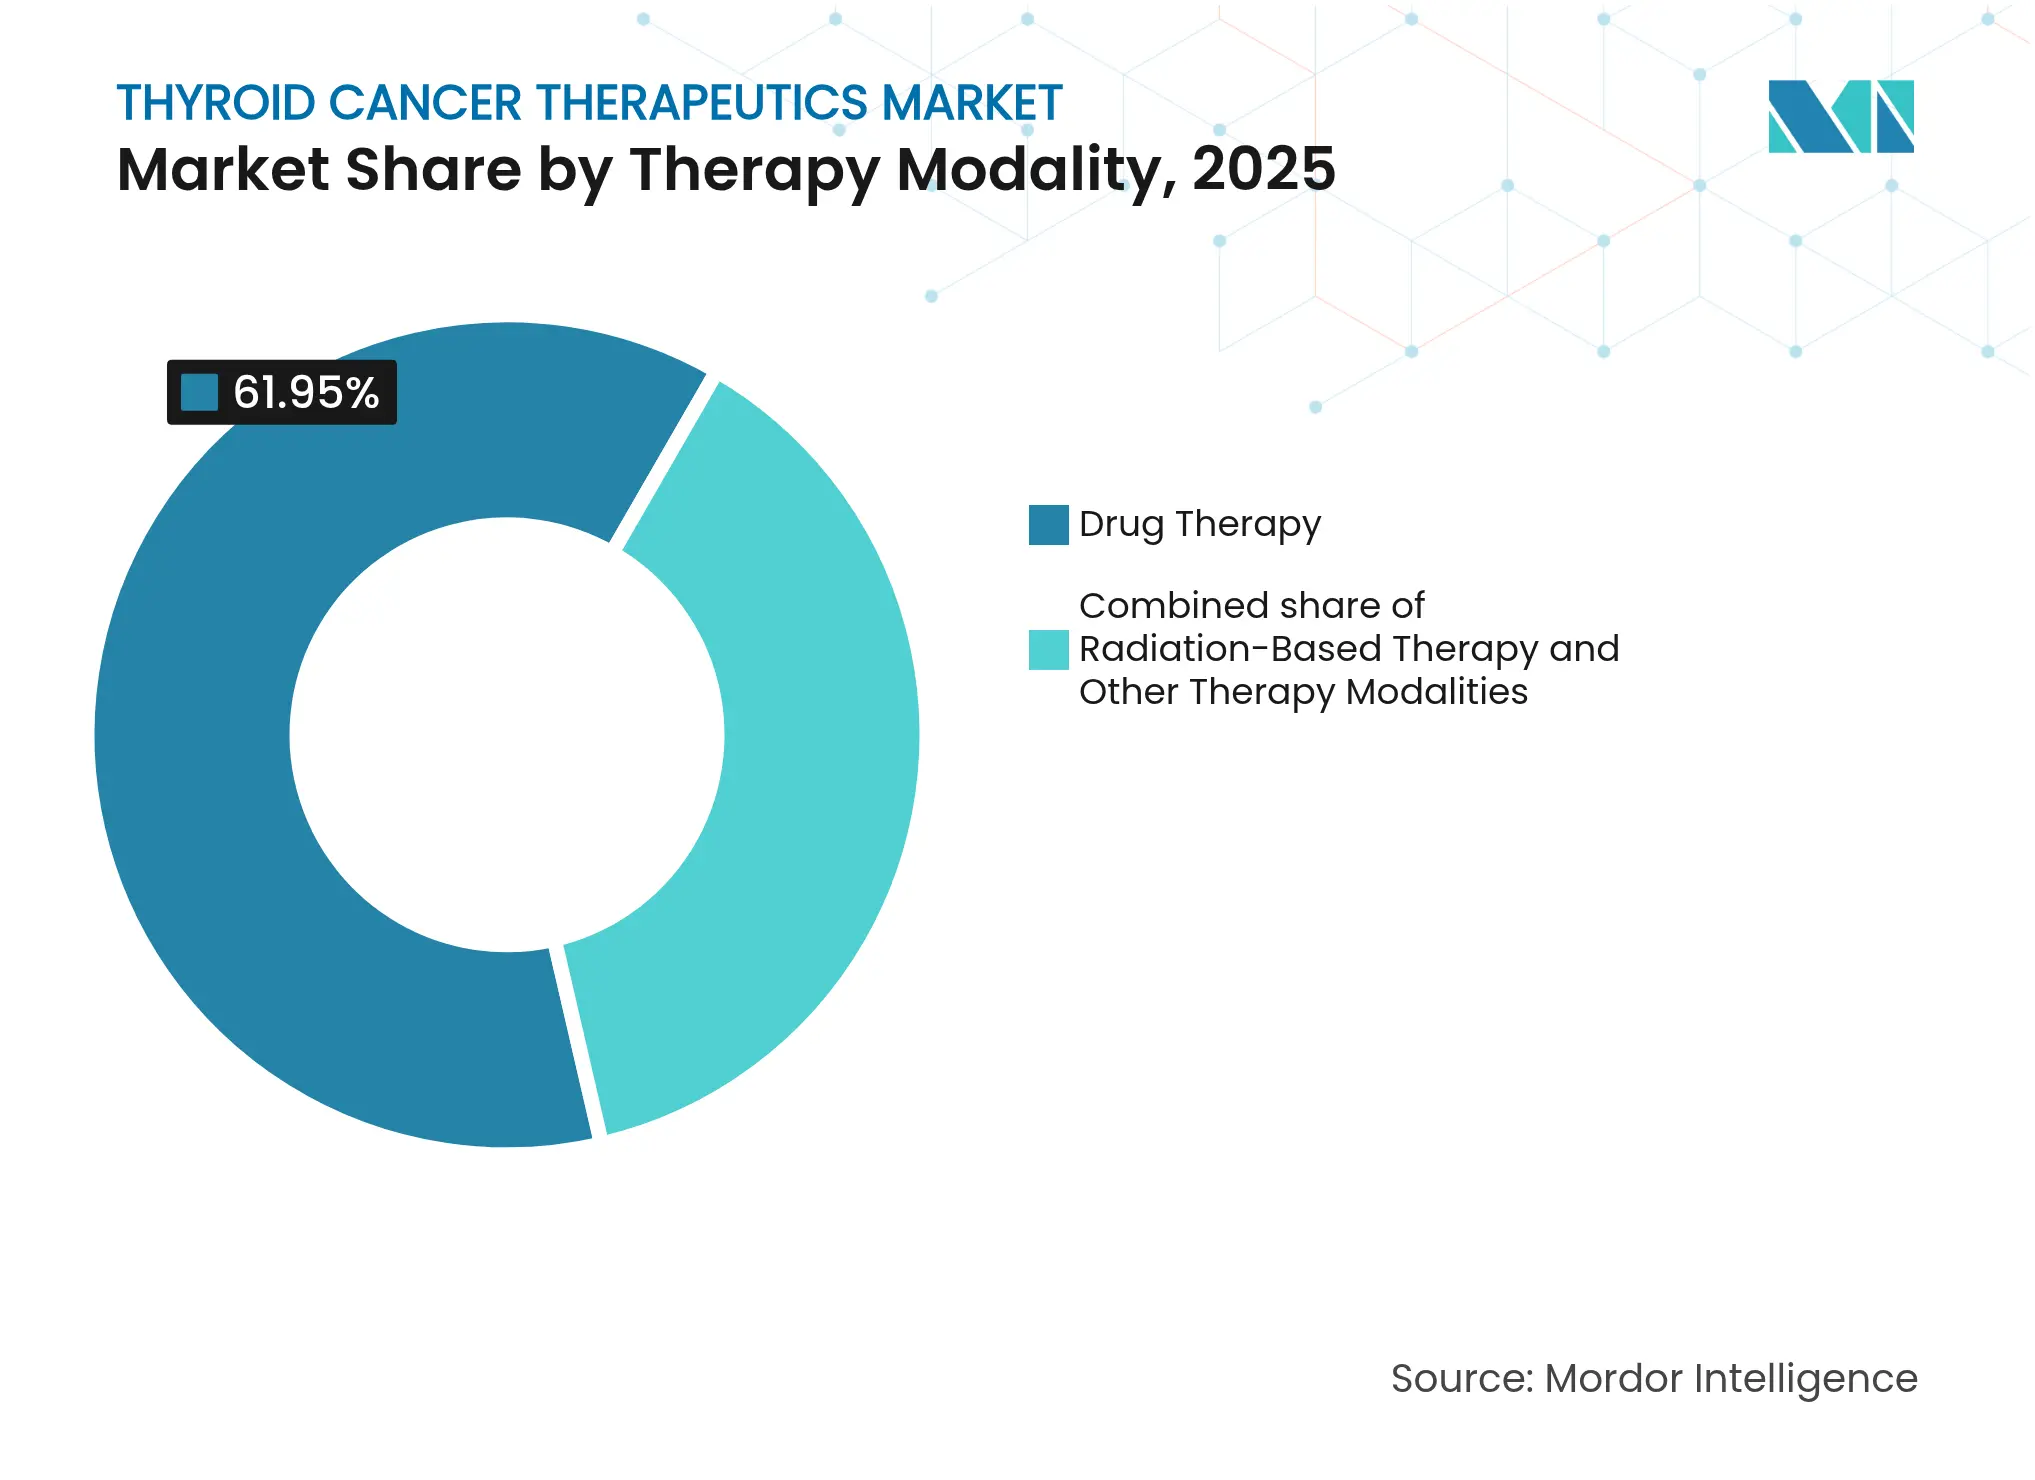
- By therapy modality, drug-based regimens held 61.95% of the thyroid cancer therapeutics market share in 2025; radiation-based protocols are expected to grow at a 10.25% CAGR to 2031.
- By end user, hospitals retained 44.20% share of the thyroid cancer therapeutics market size in 2025, while ambulatory surgical centers are poised to grow at an 11.95% CAGR through 2031.
- By geography, North America accounted for 35.10% of revenues in 2025; Asia-Pacific is projected to record the fastest 9.18% CAGR to 2031.
- AstraZeneca, Novartis, Sanofi, and Eisai collectively controlled a mid-double-digit share of the thyroid cancer therapeutics market in 2025.
Note: Market size and forecast figures in this report are generated using Mordor Intelligence's proprietary estimation framework, updated with the latest available data and insights as of 2026.
Global Thyroid Cancer Therapeutics Market Trends and Insights
Driver Impact Analysis
| Drivers Impact Analysis | (~) % Impact on CAGR Forecast | Geographic Relevance | Impact Timeline | |||
|---|---|---|---|---|---|---|
Rising global thyroid-cancer burden & earlier detection Rising global thyroid-cancer burden & earlier detection | 1.80% | North America, Asia-Pacific | Medium term (2-4 years) | (~) % Impact on CAGR Forecast:1.80% | Geographic Relevance:North America, Asia-Pacific | Impact Timeline:Medium term (2-4 years) |
Expansion of targeted & immuno-oncology therapy approvals Expansion of targeted & immuno-oncology therapy approvals | 2.10% | North America, European Union, expanding to Asia-Pacific | Short term (≤2 years) | |||
Favorable reimbursement frameworks & oncology funding Favorable reimbursement frameworks & oncology funding | 1.40% | North America, European Union, emerging in Asia-Pacific | Medium term (2-4 years) | |||
Rapid adoption of molecular companion-diagnostic testing Rapid adoption of molecular companion-diagnostic testing | 1.20% | Global, led by developed markets | Short term (≤2 years) | |||
Scale-up of radiotheranostic manufacturing capacity Scale-up of radiotheranostic manufacturing capacity | 1.00% | United States & European Union production hubs, spill-over global | Long term (≥4 years) | |||
Emerging-market sponsorship of thyroid-cancer clinical trials Emerging-market sponsorship of thyroid-cancer clinical trials | 0.80% | Asia-Pacific core, spill-over to Middle East & Latin America | Long term (≥4 years) | |||
| Source: Mordor Intelligence | ||||||
Rising Global Thyroid-Cancer Disease Burden & Earlier Detection
Thyroid cancer incidence continues to climb as ultrasound screening, AI-enhanced image triage, and molecular cytology find more early-stage lesions. An artificial-intelligence classifier from the University of Hong Kong exceeded 90% diagnostic accuracy and cut pathology preparation time in half, permitting clinicians to triage greater caseloads with fewer delays. Earlier diagnosis shifts demand toward long-duration targeted therapy courses that prevent metastatic conversion. Health-system protocols increasingly pair fine-needle aspiration with molecular profiling, ensuring high-risk variants enter treatment sooner. In emerging Asia-Pacific markets, universal ultrasound programs have begun catching microcarcinomas that previously escaped detection. Diagnostic gains thus act as a structural driver for the thyroid cancer therapeutics market, sustaining double-digit growth in precise therapy categories.
Expansion of Targeted & Immuno-Oncology Therapy Approvals
Breakthrough and priority-review pathways shorten drug-to-market cycles. Selpercatinib received multiple United States Food and Drug Administration approvals in 2024 after showing 96% responses in untreated RET-fusion thyroid cancer cohorts[1]U.S. Food and Drug Administration, “FDA Grants Accelerated Approval to Selpercatinib for RET Fusion-Positive Thyroid Cancer,” fda.gov. Pembrolizumab-lenvatinib combinations produced 65.5% objective responses and 26.8-month median progression-free survival in radioiodine-refractory cases[2]American Association for Cancer Research, “Lenvatinib Plus Pembrolizumab Shows Durable Responses in Radioiodine-Refractory Thyroid Cancer,” aacrjournals.org. AIC100, the first CAR-T directed at ICAM-1, earned RMAT status following clinically meaningful activity in heavily pretreated anaplastic cancer patients. Each green-lighted indication adds immediate revenue while encouraging copycat submissions across Europe and Asia. The result is an expanding therapeutic toolkit that propels the thyroid cancer therapeutics market beyond legacy multikinase inhibitors.
Favorable Reimbursement Frameworks & Oncology Funding
Payers now recognize that targeted agents can avert high-cost metastatic complications. Medicare began covering thyroid radiofrequency ablation in 2025, alleviating patient co-pays for outpatient nodule destruction. China removed import tariffs on anti-cancer drugs in 2024, slicing retail prices and widening access to next-generation inhibitors[3]National Medical Products Administration, “2024 Drug Approval Report,” nmpa.gov.cn. Commercial insurers in the United States expanded formulary inclusion for Thyrogen and other adjuvants despite premium list prices. These moves decrease out-of-pocket burden, improve adherence, and lengthen therapy courses, thereby bolstering revenue lines for suppliers within the thyroid cancer therapeutics market.
Rapid Adoption of Molecular Companion-Diagnostic Testing
Molecular panels now guide first-line choice. ThyroSeq v3 recorded 89.6% sensitivity and 73.7% specificity in Southeast Asian biopsies, uncovering distinct mutation patterns that steer regional treatment algorithms. Detection of BRAF V600E plus TERT promoter double mutations flags high radioiodine failure risk, prompting upfront multikinase or checkpoint blockade. Growing liquid-biopsy use lets clinicians monitor minimal residual disease without repeated biopsies, speeding escalation when molecular relapse appears. The diagnostic boom underpins a precision-first standard that expands high-value prescription volumes across the thyroid cancer therapeutics market.
Restraints Impact Analysis
| Restraints Impact Analysis | (~) % Impact on CAGR Forecast | Geographic Relevance | Impact Timeline | |||
|---|---|---|---|---|---|---|
Patent expiries triggering generic price erosion Patent expiries triggering generic price erosion | -1.50% | Developed markets | Short term (≤2 years) | (~) % Impact on CAGR Forecast:-1.50% | Geographic Relevance:Developed markets | Impact Timeline:Short term (≤2 years) |
Dose-limiting toxicities reducing long-term therapy adherence Dose-limiting toxicities reducing long-term therapy adherence | -1.10% | Global, especially elderly population | Medium term (2-4 years) | |||
Fragile global supply chain for medical radio-isotopes Fragile global supply chain for medical radio-isotopes | -0.90% | Global, with acute exposure in regions reliant on imports | Short term (≤2 years) | |||
Affordability gaps for next-gen precision therapies in LMICs Affordability gaps for next-gen precision therapies in LMICs | -0.70% | Low- and middle-income countries | Long term (≥4 years) | |||
| Source: Mordor Intelligence | ||||||
Patent Expiries Triggering Generic Price Erosion
As core assets such as lenvatinib near loss-of-exclusivity, generic entrants prepare filings that could chop innovator revenues by up to 90% inside a year. Eisai’s patent wall for lenvatinib faces challenge in several jurisdictions, prompting lifecycle management programs built around novel combinations. While therapy volumes may rise due to lower prices, overall value creation for the thyroid cancer therapeutics market could diminish. Innovators respond via radioligand acquisitions and new delivery formats that refresh intellectual-property clocks, yet pricing pressure remains an unavoidable restraint in the short run.
Dose-Limiting Toxicities Reducing Long-Term Therapy Adherence
Hypertension, proteinuria, and cardiac events continue to force dose reductions with multikinase inhibitors. In a pooled analysis, lenvatinib induced grade 3-4 hypertension in 73% and cardiac dysfunction in 3% of users, placing older patients at elevated discontinuation risk. Interruptions create therapeutic gaps where residual lesions can progress. Overlapping adverse-event profiles in new doublet regimens require sophisticated monitoring that strains smaller practices. Under-managed toxicity thus erodes real-world effectiveness and trims attainable revenue inside the thyroid cancer therapeutics market over the medium term.
Segment Analysis
By Cancer Type: Innovation Accelerates in Anaplastic Segment
Papillary disease accounted for 79.10% of 2025 therapy revenues inside the thyroid cancer therapeutics market, reaffirming its status as the most prevalent subtype. Anaplastic cancer, though rare, is projected to climb at a 11.98% CAGR as CAR-T, pembrolizumab-lenvatinib, and other breakthrough regimens unlock survival gains. The thyroid cancer therapeutics market size for anaplastic subtypes is therefore expected to outpace overall growth between 2026 and 2031. Follicular and medullary malignancies benefit from refined ultrasound classification and RET-selective inhibitors, broadening precision options across the spectrum.
Molecular profiling now outranks histology when selecting therapy. BRAF/MEK combinations help shrink bulky papillary tumors to resectable volumes, while ICAM-1-targeted CAR-T has already obtained RMAT designation for treatment-refractory anaplastic cases. Such gains equalize prognoses across subtypes and pull previously hopeless cohorts into the active-treatment funnel, reinforcing multiyear expansion of the thyroid cancer therapeutics market.
Note: Segment shares of all individual segments available upon report purchase
By Therapy Modality: Radiotheranostics Reshape Standards
Drug regimens supplied 61.95% of 2025 expenditure yet radiation-based products are on track for a 10.25% CAGR through 2031. The thyroid cancer therapeutics market size for radiotheranostics could rise sharply as alpha-emitting ligands reach mainstream use. Orano Med’s €250 million thorium plant under construction in France symbolizes scaled isotope verticalization. Meanwhile, Novartis is erecting dual radioligand facilities in Wisconsin and Indiana to safeguard supply for its therapy pipeline.
Traditional radioiodine remains an essential post-surgical option, especially with new dosimetry software that individualizes activity and lowers off-target exposure. Integrative protocols that marry selpercatinib or lenvatinib with low-dose radiation are also entering trials. Collectively, these transitions widen modality choice and inject new revenue into the thyroid cancer therapeutics market.
Note: Segment shares of all individual segments available upon report purchase
By End User: Ambulatory Centers Gain Ground
Hospitals preserved 44.20% of global receipts in 2025 as complex surgeries and combination infusions favor large centers. Yet ambulatory surgical facilities are forecast to post an 11.95% CAGR to 2031, the highest among care settings. The thyroid cancer therapeutics market share captured by ambulatory venues will grow as Medicare reimbursement for office-based ablation became effective in 2025.
Minimally invasive radiofrequency ablation and single-dose radioligand injections suit outpatient workflows, cutting inpatient stays and total cost of care. Tele-oncology follow-up further supports decentralization. These operational efficiencies attract payer preference and patient demand, guaranteeing sustained uptake of outpatient-compatible products across the thyroid cancer therapeutics market.
Geography Analysis
North America generated 35.10% of worldwide revenue in 2025, a lead built on early access to FDA-cleared agents, broad insurance coverage, and a dense trial network. Multiple selpercatinib label expansions in 2024 quickly converted into prescribing momentum across United States endocrine oncology practices. Federal programs to build domestic molybdenum-99 capacity further protect isotope supply, insulating health systems from global shortages.
Canada aligns closely with United States trends, with provincial formularies adding lenvatinib and cabozantinib to public plans in 2025. Region-wide, multidisciplinary tumor boards and precision diagnostic centers ensure rapid uptake of novel regimens, keeping North America a demand anchor for the thyroid cancer therapeutics market.
Asia-Pacific is the fastest-advancing region at a 9.18% CAGR through 2031. China’s National Medical Products Administration cleared 84 oncology drugs in 2024—an unprecedented volume signifying regulatory modernization nature.com. Removal of anti-cancer drug import duties the same year slashed retail prices and spurred utilization. Japan’s universal health coverage now reimburses selpercatinib for pediatric RET-fusion cases, widening addressable populations. India’s streamlined trial rules led to 1,832 oncology studies since 2019, boosting domestic evidence generation. Together, these milestones elevate Asia-Pacific’s strategic importance within the thyroid cancer therapeutics market.
Europe exhibits balanced growth rooted in cohesive healthcare funding and technical leadership in radiopharmaceuticals. Orano Med and Eckert & Ziegler expanded thorium-212 and actinium-225 infrastructure in 2024, cementing Europe as an isotope hub. The European Medicines Agency maintains accelerated assessment for therapies holding significant benefit, streamlining continental launches. National reimbursement bodies, though cost-conscious, increasingly reward companion-diagnostic–guided prescribing.
Latin America, the Middle East, and Africa remain smaller but rising contributors. Brazil authorized its first domestic radioiodine capsule facility in 2025, aiming to cut import reliance. Gulf Cooperation Council states fund cross-border treatment packages that fly patients to high-volume European centers, indirectly stimulating therapy sales. As regional diagnostic capabilities grow, latent demand could unlock incremental revenue for the thyroid cancer therapeutics market.

Competitive Landscape
Market Concentration
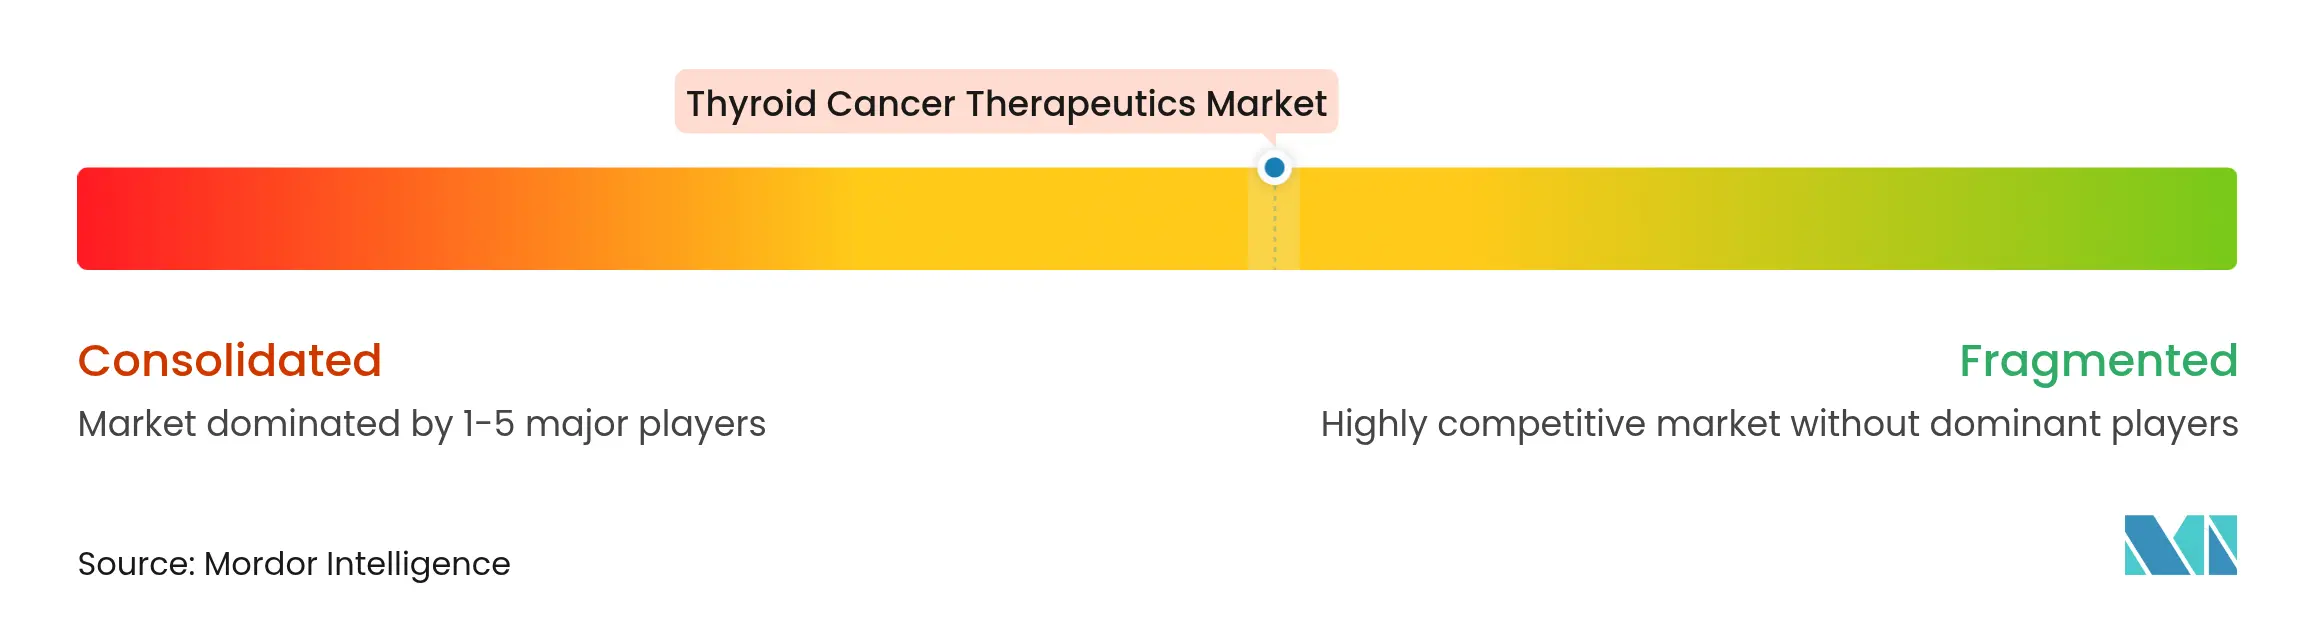
Competition sits at a moderate level: the top tier of Eisai, Novartis, AstraZeneca, and Sanofi collectively holds a mid-double-digit share, while mid-cap radiopharmaceutical specialists and early-stage cell-therapy developers jostle for differentiation. Novartis invested more than USD 1 billion in 2024 to erect dedicated radioligand plants, demonstrating commitment to guaranteed supply and faster cycle times. Sanofi partnered with Orano Med in a €300 million deal to co-develop thorium-based conjugates, signaling its pivot toward alpha-emitting platforms.
AstraZeneca’s USD 2 billion purchase of Fusion Pharmaceuticals gave it a proprietary actinium platform plus a pipeline of thyroid and solid-tumor radioligands. Lantheus Holdings followed by acquiring Evergreen Theragnostics for USD 1 billion, vertically integrating its isotope production and therapy packaging operations. Such moves show that supply-chain ownership is now a key differentiator in the thyroid cancer therapeutics market.
Start-ups deploy artificial-intelligence image classifiers, micro-fluidic companion diagnostics, and off-the-shelf CAR-T constructs. While their revenue remains small, they capture investor attention and can license technology to larger firms seeking pipeline breadth. Intellectual-property cliffs continue to shape strategy: as lenvatinib’s exclusivity wanes, Eisai advances a next-generation oral multikinase inhibitor in phase II aimed at TERT-mutant lesions. Across 2024-2025, more than USD 10 billion in radiopharmaceutical deal value closed, underscoring long-term confidence in targeted radiation as a growth pillar for the thyroid cancer therapeutics market.
Thyroid Cancer Therapeutics Industry Leaders

*Disclaimer: Major Players sorted in no particular order
Recent Industry Developments
- March 2025: FDA granted full approval to cabozantinib for advanced neuroendocrine tumors, expanding the drug’s thyroid-related oncology footprint fda.gov.
- Jan 2025: Lantheus Holdings agreed to acquire Evergreen Theragnostics for USD 1 billion to secure radioligand manufacturing capacity.
- January 2025: GSK moved to buy IDRx for USD 1.15 billion, adding a precision kinase asset that complements thyroid cancer pipeline work.
- January 2025: Lantheus Holdings agreed to acquire Evergreen Theragnostics for USD 1 billion to secure radioligand manufacturing capacity.
- December 2024: Eckert & Ziegler commenced commercial-scale actinium-225 production to relieve global isotope shortages.
Table of Contents for Thyroid Cancer Therapeutics Industry Report
1. Introduction
- 1.1Study Assumptions & Market Definition
- 1.2Scope of the Study
2. Research Methodology
3. Executive Summary
4. Market Landscape
- 4.1Market Overview
- 4.2Market Drivers
- 4.2.1Rising Global Thyroid-Cancer Disease Burden & Earlier Detection
- 4.2.2Expansion Of Targeted & Immuno-Oncology Therapy Approvals
- 4.2.3Favorable Reimbursement Frameworks & Oncology Funding
- 4.2.4Rapid Adoption of Molecular Companion-Diagnostic Testing
- 4.2.5Scale-Up of Radiotheranostic Manufacturing Capacity
- 4.2.6Emerging-Market Sponsorship of Thyroid-Cancer Clinical Trials
- 4.3Market Restraints
- 4.3.1Patent Expires Triggering Generic Price Erosion
- 4.3.2Dose-Limiting Toxicities Reducing Long-Term Therapy Adherence
- 4.3.3Fragile Global Supply Chain for Medical Radio-Isotopes
- 4.3.4Affordability Gaps for Next-Gen Precision Therapies In LMICS
- 4.4Regulatory Landscape
- 4.5Porter's Five Forces Analysis
- 4.5.1Threat of New Entrants
- 4.5.2Bargaining Power of Buyers/Consumers
- 4.5.3Bargaining Power of Suppliers
- 4.5.4Threat of Substitute Products
- 4.5.5Intensity of Competitive Rivalry
5. Market Size & Growth Forecasts (Value, USD)
- 5.1By Cancer Type
- 5.1.1Papillary Thyroid Cancer
- 5.1.2Follicular Thyroid Cancer
- 5.1.3Medullary Thyroid Cancer
- 5.1.4Anaplastic Thyroid Cancer
- 5.1.5Hurthle Cell Cancer
- 5.2By Therapy Modality
- 5.2.1Drug Therapy
- 5.2.1.1Tyrosine Kinase Inhibitors
- 5.2.1.2RET-Selective Inhibitors
- 5.2.1.3Multi-Kinase Inhibitors
- 5.2.1.4Immune Checkpoint Inhibitors
- 5.2.1.5Radio-iodine Adjunct Drugs
- 5.2.2Radiation-Based Therapy
- 5.2.2.1Radioiodine Ablation (RAI)
- 5.2.2.2External Beam Radiation
- 5.2.2.3Targeted Alpha Therapy
- 5.2.3Other Therapy Modalities
- 5.3By End User
- 5.3.1Hospitals
- 5.3.2Specialty Cancer Centers
- 5.3.3Ambulatory Surgical Centres
- 5.4Geography
- 5.4.1North America
- 5.4.1.1United States
- 5.4.1.2Canada
- 5.4.1.3Mexico
- 5.4.2Europe
- 5.4.2.1Germany
- 5.4.2.2United Kingdom
- 5.4.2.3France
- 5.4.2.4Italy
- 5.4.2.5Spain
- 5.4.2.6Rest of Europe
- 5.4.3Asia-Pacific
- 5.4.3.1China
- 5.4.3.2Japan
- 5.4.3.3India
- 5.4.3.4Australia
- 5.4.3.5South Korea
- 5.4.3.6Rest of Asia-Pacific
- 5.4.4Middle East & Africa
- 5.4.4.1GCC
- 5.4.4.2South Africa
- 5.4.4.3Rest of Middle East & Africa
- 5.4.5South America
- 5.4.5.1Brazil
- 5.4.5.2Argentina
- 5.4.5.3Rest of South America
6. Competitive Landscape
- 6.1Market Concentration
- 6.2Market Share Analysis
- 6.3Company Profiles (includes Global-level Overview, Market-level Overview, Core Segments, Financials, Strategic Information, Market Rank/Share, Products & Services, Recent Developments)
- 6.3.1Sanofi (Genzyme)
- 6.3.2Eisai Co., Ltd
- 6.3.3Bayer AG
- 6.3.4Novartis AG
- 6.3.5AbbVie Inc
- 6.3.6F. Hoffmann-La Roche Ltd.
- 6.3.7Pfizer Inc
- 6.3.8Exelixis Inc
- 6.3.9Bristol-Myers Squibb Co.
- 6.3.10Eli Lilly and Co.
- 6.3.11Viatris Inc
- 6.3.12Blueprint Medicines Corp.
- 6.3.13Loxo@Lilly
- 6.3.14Amgen Inc
- 6.3.15Merck & Co., Inc
- 6.3.16CStone Pharmaceuticals
- 6.3.17HUTCHMED
- 6.3.18Ipsen Pharma
- 6.3.19Helsinn Group
- 6.3.20Sumitomo Pharma
7. Market Opportunities & Future Outlook
- 7.1White-space & Unmet-Need Assessment
Research Methodology Framework and Report Scope
Market Definitions and Key Coverage
Our study defines the global thyroid cancer therapeutics market as all pharmacological and radiation-based interventions intended to eradicate or control malignancies originating in the thyroid gland, including papillary, follicular, medullary, anaplastic, and Huerthle cell cancers, across all disease stages, lines of therapy, and major care settings.
Scope exclusion: purely surgical procedures and diagnostics are outside the value pool modeled here.
Segmentation Overview
- By Cancer Type
- Papillary Thyroid Cancer
- Follicular Thyroid Cancer
- Medullary Thyroid Cancer
- Anaplastic Thyroid Cancer
- Hurthle Cell Cancer
- Papillary Thyroid Cancer
- By Therapy Modality
- Drug Therapy
- Tyrosine Kinase Inhibitors
- RET-Selective Inhibitors
- Multi-Kinase Inhibitors
- Immune Checkpoint Inhibitors
- Radio-iodine Adjunct Drugs
- Tyrosine Kinase Inhibitors
- Radiation-Based Therapy
- Radioiodine Ablation (RAI)
- External Beam Radiation
- Targeted Alpha Therapy
- Radioiodine Ablation (RAI)
- Other Therapy Modalities
- Drug Therapy
- By End User
- Hospitals
- Specialty Cancer Centers
- Ambulatory Surgical Centres
- Hospitals
- Geography
- North America
- United States
- Canada
- Mexico
- United States
- Europe
- Germany
- United Kingdom
- France
- Italy
- Spain
- Rest of Europe
- Germany
- Asia-Pacific
- China
- Japan
- India
- Australia
- South Korea
- Rest of Asia-Pacific
- China
- Middle East & Africa
- GCC
- South Africa
- Rest of Middle East & Africa
- GCC
- South America
- Brazil
- Argentina
- Rest of South America
- Brazil
- North America
Detailed Research Methodology and Data Validation
Primary Research
Mordor analysts interviewed oncologists, nuclear-medicine specialists, reimbursement advisors, and procurement heads across North America, Europe, and key Asia-Pacific centers. These conversations validated uptake curves for newer RET and BRAF inhibitors, typical radio-iodine dose regimens, and regional co-payment burdens that influence therapy adherence.
Desk Research
We began with publicly available epidemiology series from bodies such as the WHO Cancer Observatory, SEER, and GLOBOCAN, which anchor incidence, prevalence, and survival curves. Treatment-utilization patterns were mapped through prescribing audits from government pharmaceutical benefit schemes, while import-export codes for radio-isotopes and tyrosine-kinase inhibitors, available from UN Comtrade and Volza, helped size non-retail channels. Financial disclosures in 10-Ks, EMA and FDA approval dossiers, and investor decks supplied price points, launch timing, and patent-life data. Subscription databases, D&B Hoovers for company revenue splits and Questel for active thyroid-oncology patents, rounded out competitive inputs. This list is illustrative; many other open sources were reviewed to cross-check and clarify data.
Market-Sizing & Forecasting
A top-down prevalence-to-treated-patient build estimated annual therapy courses, which are then reconciled with a bottom-up roll-up of sampled average selling price multiplied by volume from supplier checks. Key variables include mutation-guided therapy penetration, radio-isotope production capacity, generic erosion timelines, macro exchange-rate shifts, and guideline revisions on first-line TKIs. Forecasts employ a multivariate regression that links therapy courses to secular incidence growth, aging cohorts, and payer policy indices, with scenario analysis stress-testing price and uptake assumptions.
Data Validation & Update Cycle
Outputs flow through variance and outlier screens before senior analyst review. We refresh the dataset each year and trigger interim updates if material events, such as an accelerated approval or supply disruption, shift the baseline.
Why Mordor's Thyroid Cancer Therapeutics Baseline Inspires Confidence
Benchmark comparison
Published estimates often diverge because providers select different inclusion criteria, price bases, and refresh cadences.
Key gap drivers for this market include whether radiation therapies are counted, how patient share for multikinase inhibitors is projected, the currency year used for ASPs, and the speed at which newly approved RET or BRAF agents are layered into models.
| Market Size | Anonymized source | Primary gap driver | ||
|---|---|---|---|---|
USD 2.44 B (2025) | Mordor Intelligence | - | Anonymized source:Mordor Intelligence | Primary gap driver:- |
USD 2.26 B (2024) | Industry Research Firm A | Excludes radiation-based therapy values and assumes flat ASP erosion through forecast period | ||
USD 0.71 B (2022) | Regional Consultancy B | Focuses only on branded drug sales, uses older base year, no adjustment for generic entry lag |