
Market Overview
| Study Period | 2020 - 2031 |
|---|---|
| Forecast Data Period | 2026 - 2031 |
| Base Year Market Size (2025) | USD 2.60 Billion |
| Market Size (2026) | USD 2.84 Billion |
| Market Size (2031) | USD 4.38 Billion |
| Growth Rate (2026 - 2031) | 9.08 % |
| Market Concentration | Medium |
Major Players *Disclaimer: Major Players sorted in no particular order Image © Mordor Intelligence. Reuse requires attribution under CC BY 4.0. | |

Thailand Ride Hailing Market Analysis by Mordor Intelligence
The Thailand ride-hailing market size is expected to grow from USD 2.60 billion in 2025 to USD 2.84 billion in 2026 and is forecast to reach USD 4.38 billion by 2031 at 9.08% CAGR over 2026-2031. Sustained tourism recovery for 2025 continues to lift trip volumes across Bangkok, Phuket, and Chiang Mai. E-payments accelerate transaction velocity as PromptPay recorded notable transfers through 2024, delivering frictionless booking experiences. Super-app bundling keeps users within a single ecosystem, with integrated customers generating higher ride frequency, reinforcing stickiness in the Thailand ride-hailing market.
Key Report Takeaways
- By vehicle type, passenger cars captured 80.62% of the Thailand ride-hailing market share in 2025; two-wheelers are forecast to expand at an 10.74% CAGR through 2031.
- By booking type, online channels controlled 91.85% of the Thailand ride-hailing market share in 2025 and are advancing at a 10.12% CAGR to 2031.
- By end-use, personal trips held 67.48% of the Thailand ride-hailing market share in 2025, while commercial usage is growing at 11.58% CAGR.
- By payment method, digital wallets led with 68.32% of the Thailand ride-hailing market share in 2025, and will advance at a 11.06% CAGR to 2031.
- By region, the Bangkok Metropolitan region retained 54.71% of the Thailand ride-hailing market share in 2025; Northern Thailand is rising at 9.86% CAGR through 2031 on platform expansion.
Note: Market size and forecast figures in this report are generated using Mordor Intelligence’s proprietary estimation framework, updated with the latest available data and insights as of 2026.
Thailand Ride Hailing Market Trends and Insights
Drivers Impact Analysis*
| Driver | (~) % Impact on CAGR Forecast | Geographic Relevance | Impact Timeline |
|---|---|---|---|
| Super-App Cross-Service Bundling | +2.1% | Bangkok Metropolitan Region and national urban centers | Medium term (2-4 years) |
| E-Payment Penetration Growth | +1.8% | Nationwide tourist corridors | Short term (≤2 years) |
| Tourism Rebound Post-COVID | +1.6% | Bangkok and southern resort hubs | Short term (≤2 years) |
| Government Push for EV Two-Wheelers | +1.4% | Bangkok and Central Thailand | Medium term (2-4 years) |
| High-Resolution Traffic Data APIs | +1.2% | Major urban areas | Medium term (2-4 years) |
| Ride-Hailing Mass-Transit Integration | +0.9% | Bangkok, expanding to secondary cities | Long term (≥4 years) |
| Source: Mordor Intelligence | |||
Super-App Cross-Service Bundling Accelerates Rider Acquisition
Platforms that package ride-hailing, food delivery, and financial services deepen wallet share and raise user retention, a pattern most visible in Grab’s S.M.A.R.T. 2025 roadmap [1]. Integrated customers show higher transaction frequency, pushing revenue per user upward while reducing unit marketing costs. Cross-service data flows fuel targeted promotions and dynamic pricing models, enabling efficient acquisition in the Thailand ride-hailing market. Shared payment rails ensure frictionless checkout and promote loyalty. Competitive gaps widen between multi-service ecosystems and single-vertical providers.
E-Payment Penetration Lowering Transaction Frictions
In 2023, PromptPay processed 47.42 trillion baht in Thailand, underlining widespread digital wallet adoption. TrueMoney alone commands a significant share of wallet transactions, making cash settlements increasingly rare in the Thailand ride-hailing market. Instant driver payouts improve supply-side loyalty, and cashless safety benefits resonate with tourists. Interoperable QR standards backed by the Bank of Thailand remove platform-specific friction and allow seamless cross-border spend for visitors from Malaysia and Singapore [2]. Reduced abandonment rates translate directly into higher completed trip volumes.
Tourism Rebound Post-COVID Boosting Trip Volumes
Visitors gravitate toward app-based rides for transparent pricing and GPS tracking, adding resilient demand to the Thailand ride-hailing market. New events like the Formula One street race approved for Bangkok aim to draw higher-spending audiences. Government investments in airports and hotel capacity extend the length of stay, sustaining ride frequency beyond peak seasons. Diversified source markets from China, India, and ASEAN dampen seasonality risks.
Government Push for EV Two-Wheelers in Bangkok
The EV 3.5 scheme delivers subsidies and slashes excise tax, lowering the total cost of ownership for electric motorcycles. Charging infrastructure scaled to 11,622 points across 3,720 stations by March 2025, resolving range anxiety. Carbon pricing that starts at 200 baht per tonne of CO2 raises the comparative appeal of electric fleets. Platform operators in the Thailand ride-hailing market gain cost savings on fuel and maintenance while meeting emerging sustainability mandates.
Restraints Impact Analysis*
| Restraint | (~) % Impact on CAGR Forecast | Geographic Relevance | Impact Timeline |
|---|---|---|---|
| Driver Supply Crunch | -1.8% | Nationwide, acute in Bangkok | Short term (≤2 years) |
| Urban Congestion Regulations | -1.4% | Bangkok, spreading to other cities | Medium term (2-4 years) |
| Digital-Services VAT | -1.1% | National | Medium term (2-4 years) |
| Consumer Privacy Backlash | -0.9% | National | Long term (≥4 years) |
| Source: Mordor Intelligence | |||
Driver Supply Crunch Amid Fuel-Price Volatility
Traditional taxi registrations fell below 4,000 annually since 2020, down from 8,000-15,000 before 2020, underscoring a shrinking professional driver pool. Fuel swings push daily breakeven levels to 9-13 trips at 10-kilometer averages, tightening supply in the Thailand ride-hailing market. Platforms respond with micro-lending and subsidies, yet margin compression persists. Elevated household debt and stricter auto-loan criteria restrict new entrants. Transitioning to electric motorcycles offers relief but requires upfront capital.
Intensifying Urban Congestion Regulations
Bangkok imposed 60 km/h limits citywide and 50 km/h zones near the Grand Palace, paired with AI speed cameras, creating speed-related fines that deter drivers. A planned 40-50 baht congestion charge could dampen discretionary trips. New Electronic Transactions Development Agency rules taking effect in October 2025 mandate daily facial recognition, GPS logging, and 24-hour hotlines, raising compliance budgets. These hurdles raise barriers for smaller entrants yet add operating complexity for incumbents.
*Our forecasts treat driver/restraint impacts as directional, not additive. The impact forecasts reflect baseline growth, mix effects, and variable interactions.
Segment Analysis
By Vehicle Type: Two-Wheeler Electrification Gains Speed
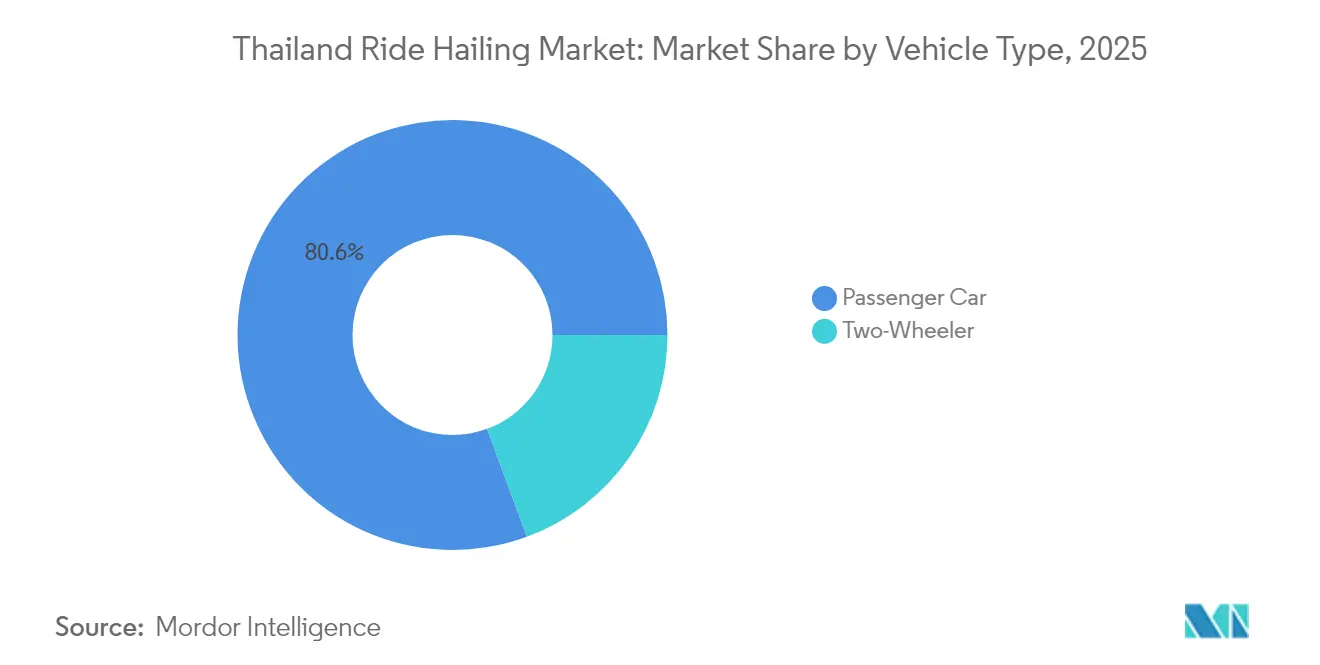
Passenger cars controlled 80.62% of the Thailand ride-hailing market share in 2025, reflecting user preference for air-conditioned comfort across long Bangkok commutes. At the same time, two-wheelers are projected to deliver an 10.74% CAGR, underpinned by the EV subsidy and excise reductions that elevate adoption economics in the Thailand ride-hailing market.
Government incentives slash upfront purchase costs, and operating savings on electricity versus petrol further tip the balance. The charging density of 11,622 public points mitigates range anxiety. Two-wheelers thrive on maneuverability that beats congestion, boosting driver earnings by enabling more trips per shift. Traditional motorcycle taxis are onboarding digital platforms to widen customer access, while incumbents launch dedicated bike categories to capture price-sensitive riders.

By Booking Type: Online Becomes Default
Online reservations captured 91.85% of the Thailand ride-hailing market share in 2025, enabled by growing smartphone penetration and reliable 4G coverage. Offline street-hail fell in Bangkok and tourist hubs as users embraced app transparency and fare security in the Thailand ride-hailing market.
Sustained 10.12% CAGR stems from ongoing feature upgrades such as multilingual interfaces and one-tap rebooking. Rural programs that improve digital literacy, plus declining smartphone prices, erode the last pockets of offline demand. Real-time analytics power surge pricing that balances supply while protecting customer experience.
By End-Use: Commercial Adoption Accelerates
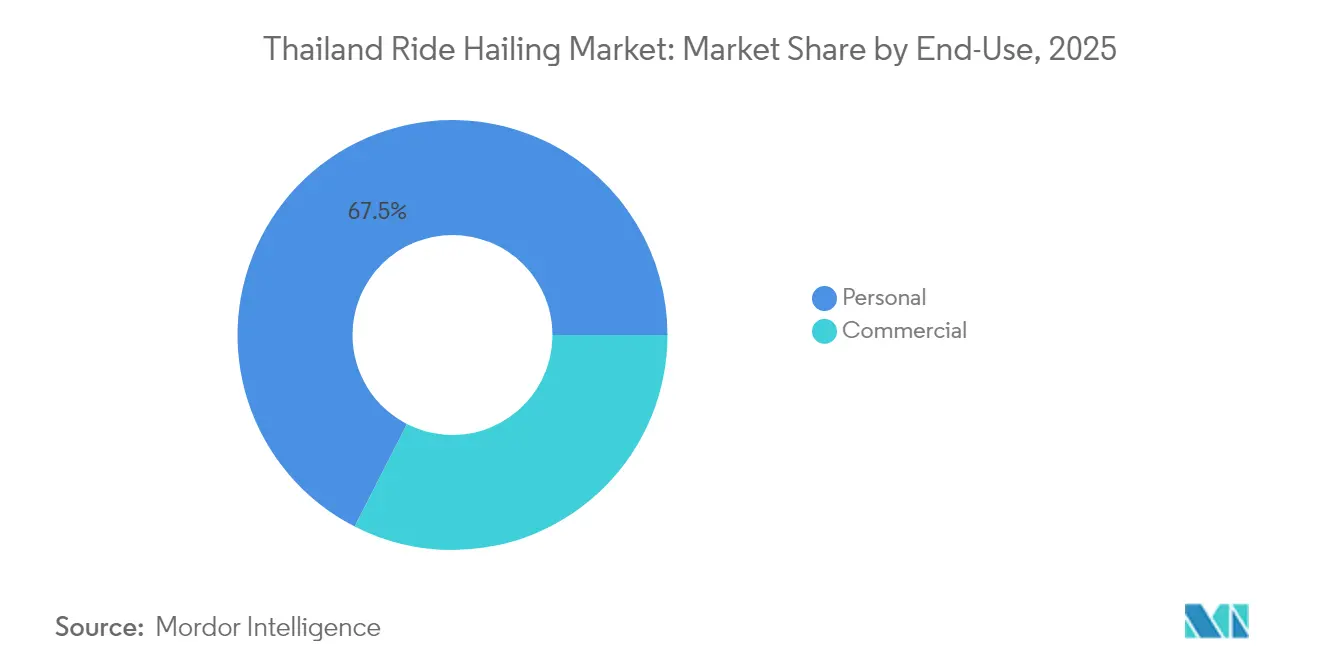
Personal travel remained dominant at 67.48% of the Thailand ride-hailing market share in 2025, driven by commuting and tourism flows. Yet commercial usage is on track for a 11.58% CAGR through 2031 as firms integrate rides into mobility budgets in the Thailand ride-hailing market.
Corporate dashboards streamline expense reconciliation, and flexible billing aligns with hybrid work schedules. Hotels package rides with room bookings to assure guest mobility, while retailers employ platforms for last-mile delivery surges. Growth aligns with Thailand 4.0 ambitions to digitize enterprise workflows.
By Payment Method: Digital Wallets Anchor Cashless Shift
Digital wallets accounted for 68.32% of Thailand's ride-hailing market share in 2025 and are forecast to grow at an 11.06% CAGR. PromptPay’s rail interoperability underpins friction-free settlement, reinforcing digital primacy in the market.
Instant payout features cut driver cash risk, enhancing retention. Cross-border QR links invite tourists to spend without currency exchange headaches. Card-based payments stagnate as QR codes dominate retail acceptance and young demographics bypass plastic.
Geography Analysis
Bangkok Metropolitan Region accounted for 54.71% of the 2025 revenue and remains the nucleus of the Thailand ride-hailing market thanks to high population density, tourist concentration, and advanced digital infrastructure. The approved Formula One street circuit and megaproject investments illustrate the government's intent to keep the capital on global itineraries. Despite a significant rail footprint, first-and-last-mile gaps persist, preserving ride-hailing share.
Northern Thailand, led by Chiang Mai and expanding secondary cities, posts the fastest CAGR at 9.86%, reflecting platform incentives and provincial infrastructure upgrades. Bolt’s low commission strategy appeals to drivers seeking margin relief. Southern islands and beach cities recapture international arrivals, increasing airport transfers and hotel pick-ups. This geographic diversification cushions operators against localized shocks and positions the Thailand ride-hailing market for sustainable nationwide scale.
Central Thailand outside Bangkok benefits from Eastern Economic Corridor factories that drive business travel, while proximity enables asset sharing with capital fleets. Pattaya’s rebound furnishes seasonal spikes that complement Bangkok’s baseline traffic.
Regulatory Landscape
Thailand has tightened oversight of app-based ride sharing, with the Electronic Transactions Commission (ETC) and the Electronic Transactions Development Agency (ETDA) enforcing the Ride Sharing Platform Notification effective March 31, 2026. A key shift is that platforms are treated as active service providers with legal accountability for safety and compliance, rather than as pure intermediaries, which increases governance requirements for incumbents and raises entry barriers.
The rules anchor compliance to the Department of Land Transport (DLT) vehicle categories and driver qualifications. This includes registration requirements (Ry. 17 for motorcycles and Ry. 18 for cars, with an age cap referenced in the notification) and public driving license requirements for drivers. A Transport Ministry directive issued in June 2026 gave platforms three months to remove unlicensed drivers (effectively by August 2026). Identity verification, for example via ThaID, along with criminal background screening involving the Royal Thai Police, strengthens know-your-driver controls and reduces fraud and account sharing across platforms.
Value Chain Analysis
The Thailand ride-hailing value chain centers on (1) rider acquisition and demand generation via apps and super-app ecosystems, (2) supply onboarding and asset access through driver recruitment plus vehicle sourcing and financing (including rentals), (3) trip execution enabled by mapping, dispatch, and digital payments (including PromptPay rails), and (4) post-trip trust layers such as refunds, dispute resolution, and safety tooling. Revenue flows primarily through commissions and service fees, while platforms also bundle adjacent services (food delivery and fintech) that can influence user retention and ride frequency.
Regulatory changes effective March 31, 2026 moved compliance activities upstream in the chain. Platforms now need tighter operational controls over driver vetting, vehicle eligibility verification (Ry. 17/18), and ongoing identity checks, supplemented by criminal record checks involving the Royal Thai Police. As a result, compliance operations, identity and verification vendors, and safety feature providers (hotlines, emergency support, and incident handling) become core inputs, while platforms also formalize partnerships that secure fleet access and reduce driver churn, including EV-related rental and charging ecosystems.
Competitive Landscape
Grab holds a notable share through first-mover advantages and continuous super-app diversification, encompassing rides, food delivery, and financial services. Consolidation quickened as several rivals exited Southeast Asia within a few months, allowing incumbents to scoop up latent demand. Bolt counters with a significant commission headline that undercuts legacy rates, courting driver allegiance in emerging cities [3].
Technology is the battleground: AI-assisted dynamic pricing, fraud mitigation, and high-resolution traffic routing differentiate experiences. To gain footholds, InDrive leverages a user-negotiated fare model and claims significant ROI on fraud controls. Super-app offerings anchor customer stickiness, letting platforms cross-subsidize promotions.
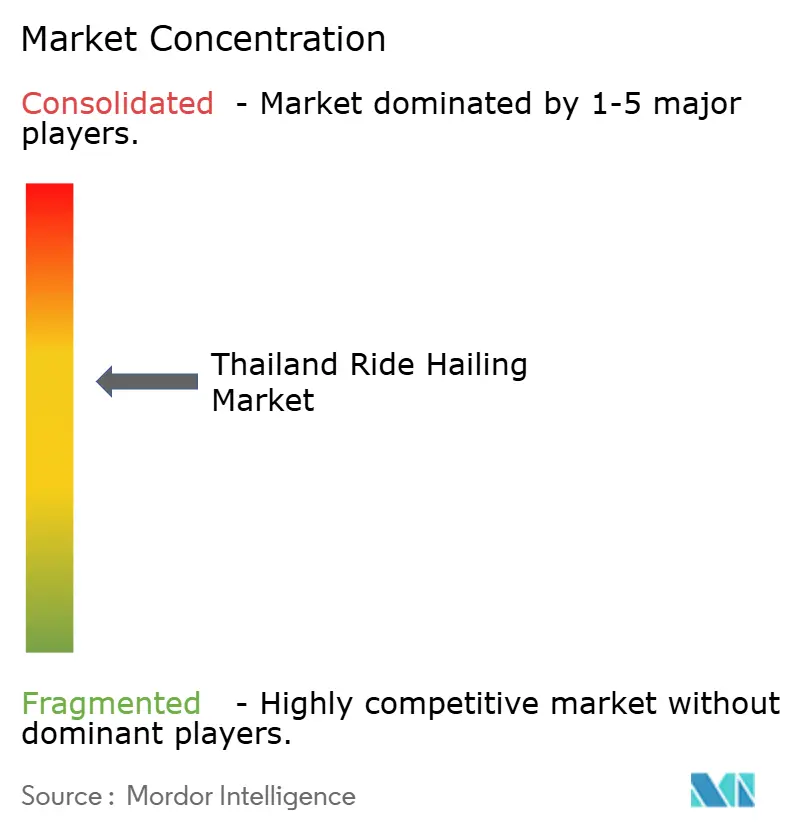
Regulatory shifts also shape positioning. For instance, the October 2025 ETDA rules mandate daily driver facial verification and 24-hour support lines, favoring firms with mature compliance architectures. Traditional taxi operators court relevance via a planned state-backed airport app, signaling a hybrid ecosystem. Overall, moderate concentration defines the arena, yet scale, data, and regulatory readiness are widening competitive moats in the Thailand ride-hailing market.
Thailand Ride Hailing Industry Leaders
-
Grab Holdings Inc.
-
Bolt Technology OÜ
-
AirAsia Super App Sdn Bhd
-
Robinhood
-
InDrive
- *Disclaimer: Major Players sorted in no particular order
Market Opportunities and Future Outlook
A clear whitespace is forming in compliant, safety-forward supply expansion after the 2026 regulatory reset that elevated platform accountability and tightened licensing enforcement. The June 2026 Transport Ministry direction to remove unlicensed drivers within three months creates an immediate incentive for platforms to invest in verification workflows, driver enablement, and compliant onboarding pathways, including public license readiness, identity checks, and vehicle eligibility. This supports opportunities for operators and partners that can reduce time-to-compliance while maintaining service levels in Bangkok and tourist corridors.
Fleet electrification and tourism-linked service differentiation are also active opportunity lanes tied to named programs and company actions. EV adoption is being operationalized through partnerships and onboarding targets, including Grab forming nine strategic partnerships with EV rental providers and charging operators in April 2026, and LINE MAN RIDE setting a goal to onboard more than 3,000 EV driver-partners by end-2026. On the demand side, Grab has outlined a 2026 strategy covering both mass-market and higher-spending segments, aligning product design with tourist use cases and premium categories, as the broader market continues shifting toward cashless experiences anchored by PromptPay interoperability and wallet-led payments.
Recent Industry Developments
- July 2026: LINE MAN Wongnai targets to onboard over 3,000 EV driver-partners to LINE MAN RIDE by end-2026, supported by rental and ownership programs. The move expands electric vehicle adoption in Thai ride-hailing. It accelerates EV fleet transition and expands platform capacity and green credentials.
- June 2026: Transport Ministry (Thai Government) issued a directive requiring all ride-hailing platforms to remove drivers without public transport licenses within three months. The directive heightens regulatory compliance pressure on operators and prompts a shift toward licensure based governance.
- April 2026: Grab Holdings formed nine strategic partnerships with EV rental providers and charging operators to accelerate its EV fleet program. The partnership network strengthens EV deployment and charging access, reducing driver acquisition risk and total cost of ownership.
Research Methodology Framework and Report Scope
Market Definition and Coverage
For this study, the market covers passenger ride-hailing services booked through app-based and other dispatch-led methods in Thailand, captured as the gross value of rides paid by users across key vehicle types and use cases.
Scope exclusions: This sizing does not count unrelated mobility services such as parcel delivery, food delivery, or vehicle rentals that are not priced and consumed as a point-to-point passenger ride.
Segmentation Overview
- By Vehicle Type
- Two-Wheeler
- Passenger Car
- By Booking Type
- Online
- Offline
- By End-Use
- Personal
- Commercial
- By Payment Method
- Digital Wallet
- Card
- Cash
- By Region
- Bangkok Metropolitan Region
- Central Thailand (ex-BMR)
- Northern Thailand
- Northeastern Thailand
- Southern Thailand
Data Sources, Market Sizing, and Validation
Desk Research
We started by building a fact base from Thailand travel demand, city mobility patterns, and digital payment readiness, since these inputs shape ride frequency and ticket size. Public sources such as Thailand tourism and visitor statistics, Bank of Thailand payment and macro series, national transport policy releases, and National Statistical Office labor and household data were used to ground realistic demand and affordability ranges.
We then added supporting reads from items like company filings and investor decks, reputable business press, app store trend signals, and association or regulator updates covering transport rules and safety requirements. Where needed, paid subscriptions were used for company financials and intelligence, news and financials screening, and selective patent database checks to track feature rollouts that can change take rates or trip conversion. The desk sources listed here are not exhaustive, and we reviewed other public references for data collection, validation, and cross-checking.
Primary Interviews and Surveys
To confirm how the market behaves in practice, we validated assumptions through expert interviews and structured surveys with platform-side operators, driver-side stakeholders, fleet and corporate travel coordinators, and mobility ecosystem experts. Coverage was balanced across Thailand regions, with extra attention to Bangkok and key tourist corridors, and the discussion focused on trip frequency, pricing behavior, incentive intensity, payment mix shifts, and how online and offline booking splits are changing.
Distribution of primary research fieldwork respondents
| Company type | Respondent position |
|---|---|
| Top tier: 37% | CXOs: 13% |
| Mid tier: 46% | Functional/Unit leaders: 43% |
| Smaller Players: 17% | Managers: 44% |
Market-Sizing & Forecasting
Sizing was built by first reconstructing the demand pool using Thailand level mobility and travel indicators, and then converting that into ride-hailing value through penetration and spending logic. In practice, the top-down approach begins with the likely trip universe by region and end-use, and then applies adoption by booking type and vehicle type, followed by typical fare per trip and the share of cash versus digital wallet or card payments.
To keep outputs realistic, the totals were corroborated with selective bottom-up approximations, including sampled price-per-trip checks, supply-side availability signals, and reasonableness checks from operator and driver economics. Inputs used in the model included tourism activity and seasonality, urban trip intensity in Bangkok versus other regions, payment method mix, average fare behavior by vehicle type (two-wheeler versus passenger car), and promotion or incentive pressure that can inflate or depress realized prices. Where direct data was thin for smaller regions or offline booking, we used proxy ranges from comparable provinces and then tightened final assumptions through primary feedback.
For forecasting, we ran scenario analysis around a base case, supported by short-run trend smoothing on key drivers such as trip growth and fare progression. The forward view was then adjusted using primary signals on expected regulation enforcement, payment adoption pace, and service availability changes, since these factors can move the market faster than longer historical series alone.
Data Validation & Update Cycle
Model outputs were cross-checked against independent signals, and any large jumps were investigated before finalization. We ran variance checks by region, vehicle type, and payment method, and then reviewed whether the implied trip volumes and fares looked consistent with real-world rider behavior shared during interviews.
Before sign-off, the work goes through multi-step internal reviews so assumptions stay consistent across the full model and narrative. If a material mismatch is detected, respondents are re-contacted to clarify the driver, and the model is re-balanced. Reports are refreshed annually, with interim updates triggered by major policy changes, pricing shocks, or demand disruptions, followed by a final pre-delivery pass so clients receive the latest updated view.
Mordor Intelligence's Thailand Ride Hailing Market Sizing Compared With Other Published Estimates
Published market sizes for Thailand ride-hailing can vary a lot because different studies do not always count the same revenue pool, and the assumptions behind pricing and trip activity can differ. Differences often come from how online versus offline booking is treated, whether personal and commercial use are both included, and how digital wallet versus cash transactions are translated into value.
The main gap comes from whether adjacent app-based mobility revenues are mixed into ride-hailing. Mordor Intelligence counts only passenger ride value and keeps delivery and other non-ride services out, and it refreshes the payment mix and fare assumptions by Thailand region to avoid overstating monetized trips.
Benchmark comparison
| Source | Market Size | Gaps in Research Methodology |
|---|---|---|
| Mordor Intelligence | USD 2.60 B (2025) | |
| Global Consultancy A | USD 1.50 B (2026) | Uses a narrower definition closer to e-hailing only, and appears to apply more conservative trip volume assumptions without a clear Thailand region-level calibration of fares and payment mix. |
| Industry Report Publisher B | USD 2.50 B (2023) | Anchors the value on an earlier year and may blend ride-hailing with broader mobility services, which can shift totals depending on whether non-ride revenue streams are included. |
The spread in the table mainly reflects scope and timing differences, and then how trip value is built from fares, promotions, and payment behavior. By keeping inputs tied to observable demand signals and by validating key assumptions with field feedback, the estimate stays traceable to clear steps that can be repeated as conditions change.
Key Questions Answered in the Report
What is the current value of the Thailand ride-hailing market?
The market was valued at USD 2.84 billion in 2026 and is forecast to reach USD 4.38 billion by 2031.
How fast is two-wheeler adoption growing in Thai ride-hailing services?
Two-wheeler bookings are projected to rise at an 10.74% CAGR through 2031 due to EV subsidies and urban congestion advantages.
Which region outside Bangkok shows the fastest ride-hailing growth?
Northern Thailand is expanding at about 9.86% CAGR as platforms like Bolt enter cities such as Nakhon Ratchasima and Khon Kaen.
How dominant are digital wallets in Thai ride payments?
Digital wallets processed 68.32% of ride fares in 2025 and continue to gain share because of PromptPay interoperability.