
Anti-Snoring Treatment Market Size and Share
Market Overview
| Study Period | 2020 - 2031 |
|---|---|
| Market Size (2026) | USD 2.25 Billion |
| Market Size (2031) | USD 3.69 Billion |
| Growth Rate (2026 - 2031) | 10.41 % |
| Fastest Growing Market | Asia Pacific |
| Largest Market | North America |
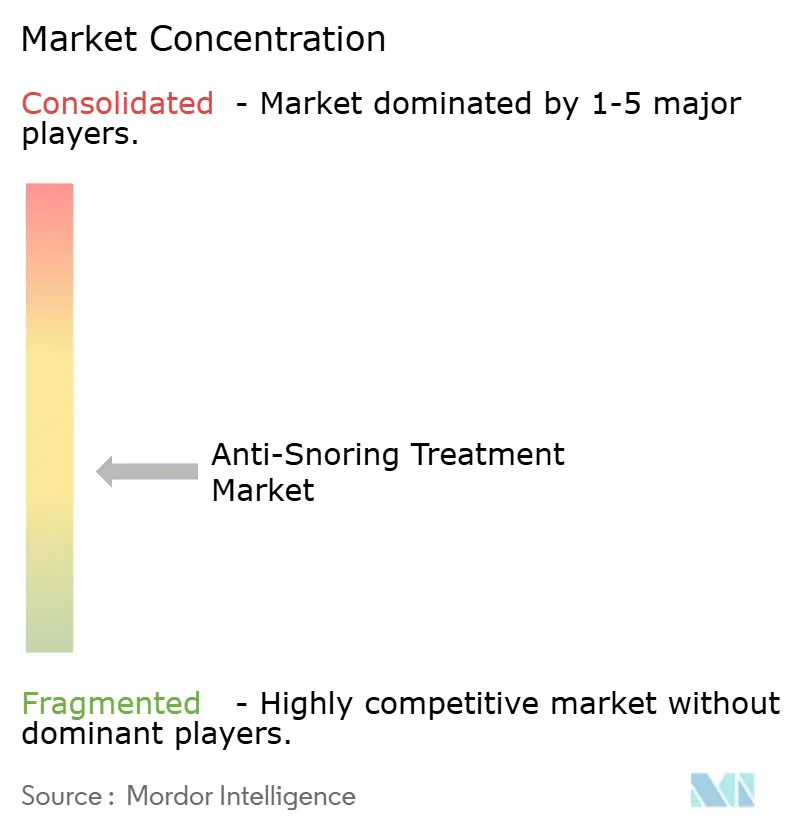
| Market Concentration | Medium |
Major Players *Disclaimer: Major Players sorted in no particular order Image © Mordor Intelligence. Reuse requires attribution under CC BY 4.0. | |
Anti-Snoring Treatment Market Analysis by Mordor Intelligence
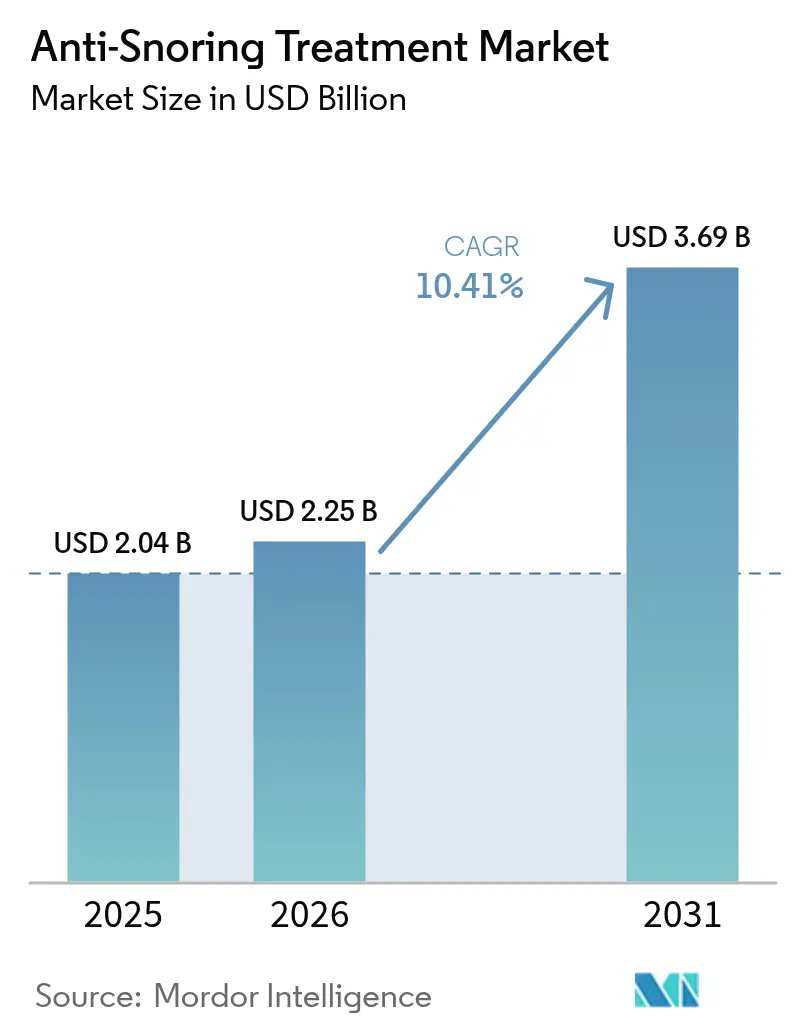
The anti-snoring treatment market size was valued at USD 2.04 billion in 2025 and estimated to grow from USD 2.25 billion in 2026 to reach USD 3.69 billion by 2031, at a CAGR of 10.41% during the forecast period (2026-2031). Demand growth links directly to rising obesity and aging cohorts, faster over-the-counter (OTC) approvals, and the diffusion of app-linked wearables that shorten time from diagnosis to therapy. Mandibular advancement devices (MADs) still anchor the therapeutic mix but the surge of connected positional trainers highlights consumer preference for low-profile, technology-enabled solutions. Home-care settings and online channels widen access and reduce per-patient costs, while hypoglossal nerve stimulation is redefining surgical options for Continuous Positive Airway Pressure (CPAP)–intolerant patients. CPAP adherence challenges and fragmented wellness-device regulations remain drag factors, yet overall market momentum is reinforced by corporate sleep-health programs that link therapy uptake with lower insurance premiums.
Key Report Takeaways
- By device type, mandibular advancement devices held 39.02% of the anti-snoring treatment market share in 2025. Smart wearables and positional trainers are forecast to post the fastest 13.92% CAGR to 2031.
- By surgical intervention, uvulopalatopharyngoplasty led with 30.12% revenue share in 2025, whereas hypoglossal nerve stimulation is projected to grow at 13.53% CAGR through 2031.
- By end-user, home-care settings captured 45.21% share of the anti-snoring treatment market size in 2025.
- By distribution channel, online platforms are expanding at a 14.22% CAGR through 2031.
- By technology, connected and app-enabled devices are advancing at the fastest 14.36% CAGR through 2031.
- By geography, North America retained leadership with 41.44% 2025 share; Asia-Pacific shows an 11.52% CAGR to 2031.
Note: Market size and forecast figures in this report are generated using Mordor Intelligence’s proprietary estimation framework, updated with the latest available data and insights as of 2026.
Market Trends and Insights
Drivers Impact Analysis of Anti-Snoring Treatment Market*
| Driver | (~) % Impact on CAGR Forecast | Geographic Relevance | Impact Timeline |
|---|---|---|---|
| Rapid growth of obesity & geriatric cohorts | +2.8% | North America & Europe; rising in APAC | Long term (≥ 4 years) |
| Rising diagnosis rates of mild OSA via home-sleep testing | +2.1% | North America & Europe; emerging in APAC | Medium term (2-4 years) |
| Acceleration of e-commerce DTC sales for OTC devices | +1.9% | North America and urban APAC | Short term (≤ 2 years) |
| FDA-cleared OTC MADs shortening Rx-to-therapy cycle | +1.6% | North America; regulatory spillover to Europe | Medium term (2-4 years) |
| Smart, app-linked positional & acoustic wearables | +1.4% | Developed markets; scaling globally | Long term (≥ 4 years) |
| Corporate sleep-health programmes lowering insurance premiums | +0.8% | North America & Europe; pilots in APAC | Medium term (2-4 years) |
| Source: Mordor Intelligence | |||
Rapid Growth of Obesity & Geriatric Cohorts
Escalating obesity prevalence intersects with aging physiology to magnify obstructive sleep apnea (OSA) incidence. Each BMI unit above 30 kg/m² accelerates apnea–hypopnea severity, while declining pharyngeal muscle tone in older adults raises airway collapsibility. U.S. modeling indicates a 26.7% increase in adult OSA prevalence between 2025 and 2030, amplifying demand for early intervention modalities that minimize downstream cardiovascular costs.
Rising Diagnosis Rates of Mild OSA via Home-Sleep Testing
Fifty-eight FDA-cleared home testing devices have lowered diagnostic barriers, with Type-3 monitors making up 84.5% of approvals[1]Park, J.H. et al., “FDA-cleared home sleep apnea testing devices,” Nature.com. At 20–30% lower cost than lab polysomnography, home tests surface mild OSA cases that often eschew CPAP, steering clinicians toward oral appliances and positional wearables.
Acceleration of E-Commerce DTC Sales for OTC Devices
Telehealth marketplaces pair remote impressions with custom MAD fulfilment, cutting wait times and bundling subscription coaching. Daybreak’s platform reports 90% snoring reduction feedback, illustrating how direct-to-consumer models strengthen long-term adherence.
FDA-Cleared OTC MADs Shortening Rx-to-Therapy Cycle
The 21 CFR 872.5575 rule set formalizes pathways for neuromuscular tongue stimulators and OTC oral devices, shrinking therapy initiation from months to days[2]U.S. Government, “21 CFR 872.5575,” ecfr.gov. Expanded consumer access raises self-selection risks, yet the same regulation has unlocked venture investment in smart intra-oral solutions.
Restraints Impact Analysis of Anti-Snoring Treatment Market*
| Restraint | (~) % Impact on CAGR Forecast | Geographic Relevance | Impact Timeline |
|---|---|---|---|
| High price of custom 3-D printed oral appliances | -1.8% | Most pronounced in emerging markets | Medium term (2-4 years) |
| Low long-term adherence to CPAP & chin-straps | -2.3% | Global; varies with support infrastructure | Long term (≥ 4 years) |
| Fragmented regulatory pathways for “wellness” devices | -1.2% | Differing jurisdictional standards | Short term (≤ 2 years) |
| Social stigma in emerging markets limiting care-seeking | -1.6% | APAC, MEA, Latin America | Long term (≥ 4 years) |
| Source: Mordor Intelligence | |||
High Price of Custom 3-D Printed Oral Appliances
Custom devices frequently exceed USD 1,500 before impression and follow-up fees, driving total out-of-pocket cost past USD 4,000 and curbing adoption in middle-income markets. Material, printer, and post-curing expenses still prevent scale economies.
Low Long-Term Adherence to CPAP & Chin-Straps
Six early-usage behaviors predict 62% dropout by month 3; 29–83% overall non-adherence persists despite remote monitoring[3]Mansell, S.K., “Six early CPAP-usage behavioural patterns…,” thorax.bmj.com. Anatomical obstructions and psychosocial barriers drive users toward alternative modalities, dampening CPAP revenue momentum.
*Our forecasts treat driver/restraint impacts as directional, not additive. The impact forecasts reflect baseline growth, mix effects, and variable interactions.
Anti-Snoring Treatment Market Segment Analysis
By Device Type:
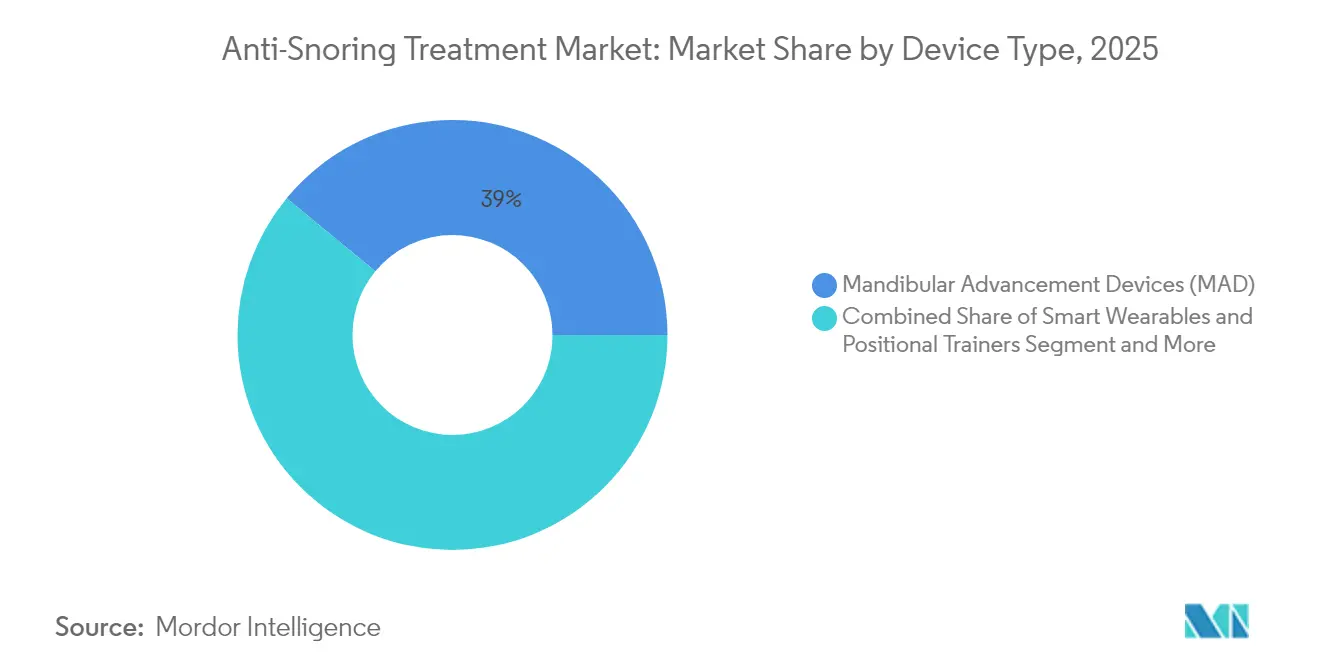
Technology-Enabled Wearables Challenge Mechanical MainstayMandibular advancement devices retained 39.02% 2025 anti-snoring treatment market share, while smart wearables and positional trainers chart a 13.92% CAGR, reflecting the digital pivot. Continuous Positive Airway Pressure units remain the reference for severe OSA, yet their comfort gap sustains a sizable pool for alternatives. Expiratory PAP valves and nasal dilators answer demand for minimalist airflow aids, and tongue-stabilizing tools serve anatomically specific niches.
Innovation momentum skews toward connected formats. Smart MADs layer sensors that validate nightly protrusion efficacy and transmit cloud analytics, reinforcing compliance loops. The anti-snoring treatment market size for connected oral devices is forecast to expand at 12.63% CAGR from USD 410 million in 2025, underpinned by OTC policy tailwinds. Conversely, the anti-snoring treatment industry still sees high abandonment of generic chin-straps, spotlighting design and materials upgrades as a retention lever.



By Surgical Intervention:
Nerve Stimulation Redraws the Invasive-Care MapUvulopalatopharyngoplasty held 30.12% surgical share in 2025, but hypoglossal nerve stimulation’s 13.53% future CAGR signals growing preference for device-guided neuromodulation. Somnoplasty and radio-frequency palatoplasty offer tissue-reduction routes with lower morbidity, while the pillar procedure fills the minimally invasive palate-stiffening niche.
Neuro-stimulation’s premium price bracket (USD 30,000–40,000) restricts volume yet secures reimbursement in select markets where CPAP intolerance is documented. The anti-snoring treatment market size for nerve stimulation is forecast to reach USD 575 million by 2031, emphasizing payer-policy alignment. Viral adoption hinges on further evidence of multi-year efficacy and streamlined outpatient implantation.
By End-user:
Home-Care Dominance Mirrors Healthcare ConsumerizationHome-care settings commanded 45.21% 2025 revenue, propelled by at-home diagnostics and remote coaching. Hospitals and sleep labs remain critical for complex case management and titration studies, whereas dental and ENT clinics capture appliance fitting and surgical referrals.
Digital ecosystems knit these access points together. NightOwl’s home test pipeline feeds data to cloud dashboards, enabling clinicians to iterate therapy without in-person follow-up. The anti-snoring treatment market share for home-care modalities is expected to edge past 49.35% by 2031 as reimbursement favor shifts to cost-efficient outpatient care. Providers must escalate educational content to ensure self-managed patients interpret device metrics correctly.
By Distribution Channel:
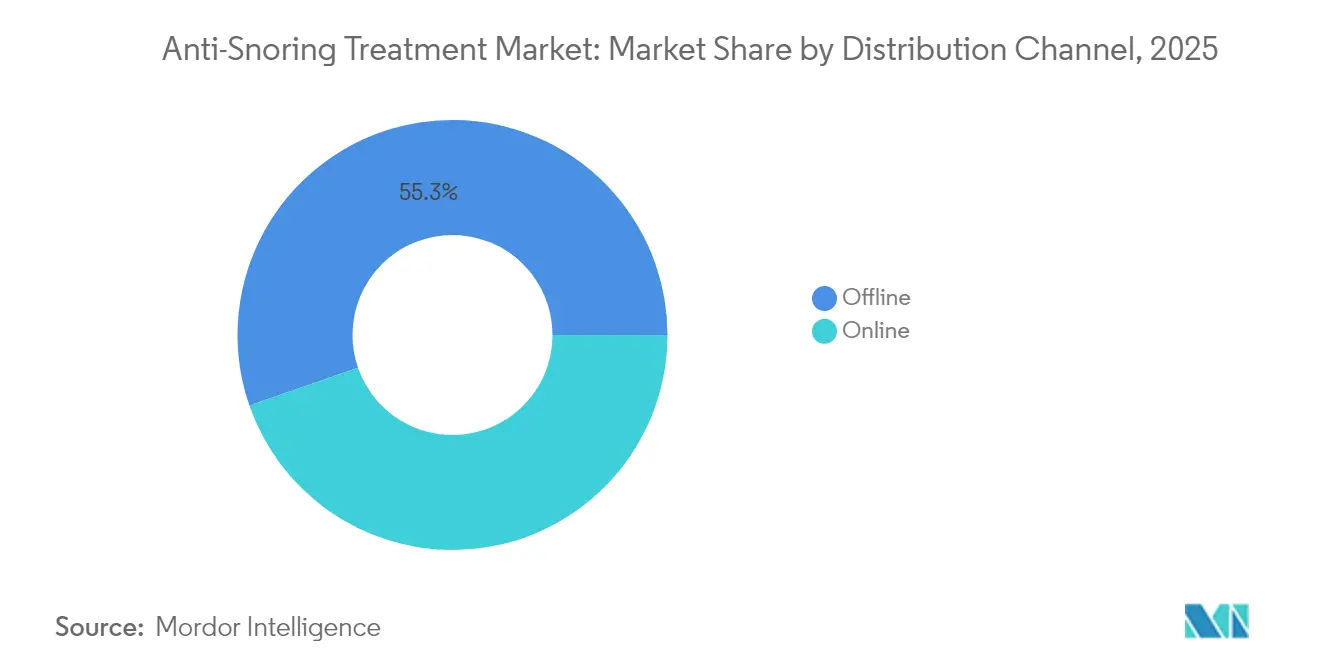
Digital Commerce Widens Geographic ReachOffline pharmacy and hospital outlets still handled 55.31% of 2025 deliveries, yet online portals clock a brisk 14.22% CAGR as consumers migrate to doorstep fulfillment. Subscription bundles couple device replacement cycles with virtual coaching, increasing lifetime value and retention.
Direct-to-consumer storefronts also penetrate markets lacking specialist clinics, stimulating first-time adoption. The anti-snoring treatment market size transacted via online channels is projected to climb from USD 910.68 million in 2025 to USD 2.02 billion in 2031. Compliance with cross-border device import rules and data-privacy mandates remains the principal hurdle for smaller entrants.
By Technology:
Connected Ecosystems Power Data-Driven CareNon-connected devices garnered 59.94% share in 2025, but app-enabled solutions log a 14.36% CAGR by leveraging artificial intelligence to personalize therapy. Cloud dashboards convey real-time adherence metrics, while generative AI assistants such as ResMed Dawn coach users on mask fit and nightly routines.
The anti-snoring treatment market share for connected systems is poised to touch 46.75% by 2031, contingent on cybersecurity frameworks and seamless EHR integration. Manufacturers funnel 7% of revenue into R&D for ecosystem features, underscoring the strategic premium placed on data ownership.
Geography Analysis
North America Anti-Snoring Treatment Market
North America led with 41.44% 2025 share thanks to comprehensive reimbursement, enterprise wellness initiatives, and early uptake of AI-enhanced wearables. Insurers now pilot value-based payment bundles that tie premium discounts to demonstrated adherence, reinforcing device replacement cycles. Yet CPAP drop-off rates push clinicians toward multimodal protocols, sustaining demand diversity.
APAC Anti-Snoring Treatment Market
Asia-Pacific posts the fastest 11.52% CAGR as demographic bulges meet rising disposable income and expanding private insurance. China alone counts 176 million OSA sufferers but only 10.25% CPAP penetration, spotlighting latent volume for lower-cost oral appliances and app-based diagnostics. Public-health campaigns now tackle entrenched cultural misperceptions; India’s “Stop the Snore” initiative partners with ENT societies to normalize screening.
EMEA and South America Anti-Snoring Treatment Market
Europe remains a steadier, protocol-driven environment. Harmonized CE marking accelerates connected-device rollouts, while sickness-fund reimbursement stabilizes adoption curves. Middle East & Africa and South America advance from low bases; gulf states invest in specialty sleep centers, whereas Brazil’s telemedicine law revisions aid remote MAD dispensing.


Regulatory Landscape
In the United States, anti-snoring intraoral devices are regulated by the FDA as Class II devices under product code LRK, with special controls defined through FDA guidance for intraoral devices for snoring and/or obstructive sleep apnea. This framework supports 510(k) market entry while raising expectations for biocompatibility, performance testing, labeling, and usability. In February 2026, the FDA Quality Management System Regulation (QMSR) also became effective, tightening quality-system alignment for manufacturers across the device life cycle.
In the European Union, Regulation (EU) 2017/745 (Medical Device Regulation, MDR) remains the central compliance framework, with ongoing updates reflected in the consolidated text in force as of 2026-01-01. MDR obligations on clinical evaluation, post-market surveillance, and traceability across economic operators shape commercialization timelines for both conventional oral appliances and connected or app-enabled devices, particularly where software functions, cybersecurity expectations, and data handling intersect with device claims.
Competitive Landscape
The market is structurally fragmented. ResMed, Philips, and Fisher & Paykel Healthcare shape the CPAP and connected-device tiers, while Inspire Medical Systems leads neuro-stimulation. Incumbents channel capital toward digital acquisitions; ResMed’s Somnoware buy deepens analytics capability and supports cross-selling across its 147 million cloud-connected nights per quarter.
Philips, still managing recall remediation, partners with Compumedics to seed pharmacy-based diagnostics, safeguarding brand equity while diversifying channel mix. Emerging disruptors package AI algorithms with off-the-shelf sensors to create under-USD 200 wearables targeting under-served geographies; fundraising momentum signals venture appetite for hardware-software hybrids.
Strategic themes now emphasize platform play over single-device sales. Offerings that blend self-testing, app coaching, and logistics automation promise higher recurring revenue and stickier consumer relationships. Competitive moats hinge on patent portfolios for sensor fusion and cloud architectures rather than plastic-hardware differentiation.
Anti-Snoring Treatment Industry Leaders
Fisher & Paykel Healthcare Limited
Koninklijke Philips NV
Resmed
Apnea Sciences
Tomed GmbH
- *Disclaimer: Major Players sorted in no particular order
Anti-Snoring Treatment Market Companies Covered in this Report
- Resmed
- Koninklijke Philips
- Fisher & Paykel Healthcare
- SomnoMed
- Apnea Sciences
- Whole You (Mitsui Chemicals)
- Tomed GmbH
- The Pure Sleep Company
- Signifier Medical Technologies
- ZQuiet (Sleeping Well LLC)
- Smart Nora
- Bleep LLC
- Good Sleep Co
- Rotech Healthcare
- Innovative Health
- Lear Corp (AccuMED)
- Meditas
- GlaxoSmithKline
- SnoreMeds (Pty) Ltd
- Tongue Lab

Market Opportunities and Future Outlook
Regulatory and clinical milestones are widening whitespace for differentiated, non-PAP alternatives that address adherence and comfort barriers. In March 2026, LivaNova received FDA premarket approval for the aura6000 System for proximal hypoglossal nerve stimulation therapy in moderate to severe OSA. In April 2026, 7-month OSPREY randomized controlled trial data were published in Annals of Internal Medicine, strengthening payer and provider confidence in neuromodulation pathways for CPAP-intolerant patients and expanding the addressable procedural ecosystem across sleep labs, ENT clinics, and outpatient surgical settings.
On the OTC and home-care side, additional 510(k) clearances for Class II intraoral anti-snoring mouth guards (for example, Koncept Innovators, Inc. receiving FDA clearance in May 2026) continue to add products in mandibular advancement and related oral-appliance categories that can be fulfilled through DTC and online channels. With home sleep testing and app-linked wearables shortening time from symptom recognition to therapy initiation, the key opportunity is in end-to-end workflows that combine screening, selection, and monitoring, alongside compliance requirements under QMSR and the EU MDR for devices that include diagnostic or algorithm-supported claims.
Recent Industry Developments in Anti-Snoring Treatment Market
- June 2026: ResMed completed the acquisition of Noctrix Health, adding Nidra Tonic Motor Activation therapy to its clinical sleep health portfolio. The deal broadens ResMed's reach beyond traditional PAP therapy into adjacent sleep-related conditions, supporting a more diversified, connected care offering across home and clinical settings.
- December 2025: ResMed received FDA clearance for Personalized Therapy Comfort Settings, marketed as Smart Comfort, an AI-enabled digital medical device intended to help personalize CPAP therapy. The clearance supports product differentiation around adherence and comfort, reflecting the competitive shift toward software-enabled therapy optimization.
- October 2024: The FDA cleared the Happy Ring by Happy Health, expanding over-the-counter choices for vibration-based snoring mitigation. The clearance adds momentum to consumer-led adoption of wearable and positional approaches that sit between wellness use cases and clinically oriented snoring reduction.


Anti-Snoring Treatment Market Report Scope and Research Methodology
Market Definition and Coverage
This market covers products and procedures used to reduce or stop habitual snoring by improving airflow through the upper airway. It is measured as the value of clinically marketed devices and snoring-related interventions sold to end users.
Scope exclusions: Cosmetic nose strips, smartphone sound-recording apps, and sprays are not counted in this sizing.
Segments Covered in This Report
- By Device Type
- Mandibular Advancement Devices (MAD)
- Tongue Stabilizing Devices (TSD)
- Continuous Positive Airway Pressure (CPAP) Devices
- Expiratory PAP (EPAP) & Nasal Dilators
- Smart Wearables & Positional Trainers
- Other Devices
- By Surgical Intervention
- Uvulopalatopharyngoplasty (UPPP)
- Somnoplasty
- Pillar Procedure
- Tonsillectomy & Adenoidectomy
- Radio-frequency Palatoplasty
- Hypoglossal Nerve Stimulation
- Laser-Assisted Uvuloplasty
- Others
- By End-user
- Home-care Settings
- Hospitals & Sleep Labs
- Dental & ENT Clinics
- By Distribution Channel
- Offline (Hospital/Retail Pharmacies)
- Online (E-commerce, DTC, Marketplaces)
- By Technology
- Connected / App-enabled Devices
- Non-connected Conventional Devices
- Geography
- North America
- United States
- Canada
- Mexico
- Europe
- Germany
- United Kingdom
- France
- Italy
- Spain
- Rest of Europe
- Asia-Pacific
- China
- Japan
- India
- South Korea
- Australia
- Rest of Asia-Pacific
- Middle East and Africa
- GCC
- South Africa
- Rest of Middle East and Africa
- South America
- Brazil
- Argentina
- Rest of South America
- North America
Data Sources, Market Sizing, and Validation
Desk Research
Desk work starts by mapping the demand pool and the typical care pathway, then matching it with how products are regulated and sold in major countries. We refer to public sources such as CDC health statistics, WHO datasets, NIH and PubMed clinical literature, national health service guidance pages, and customs or trade statistics where device categories are visible.
Next, supply and pricing signals are cross-checked using company annual reports, investor presentations, product catalogs, and resources from medical societies and sleep associations that discuss diagnosis and treatment practices. In a few cases, a paid subscription is used for company financials and patent lookups to validate innovation activity and approximate revenue exposure to sleep-related device lines. These desk research sources are illustrative, and we also used other public references for data collection, validation, and research clarification.
Primary Interviews and Surveys
Primary work was used to pressure-test the desk assumptions on what is actually prescribed, purchased, and replaced across home use and clinical channels. We spoke with a mix of manufacturers, distributors, sleep clinicians, dentists focused on oral appliances, and channel stakeholders across APAC, EMEA, and the Americas. This input helped align adoption rates, typical pricing ranges, and the realistic share of procedure-based solutions by region.
Distribution of primary research fieldwork respondents
| Company type | Respondent position | Region |
|---|---|---|
| Top tier: 29% | CXOs: 12% | APAC: 44% |
| Mid tier: 55% | Functional/Unit leaders: 38% | EMEA: 36% |
| Smaller Players: 16% | Managers: 50% | Americas: 20% |
Market-Sizing & Forecasting
The core build uses a top-down demand reconstruction, where diagnosed and addressable snoring and sleep-disordered breathing populations are translated into treated users based on therapy preference, access to care, and channel availability. Revenues for devices and interventions are then estimated using typical units per patient and average selling price ranges, and split by region using differences in healthcare access and purchasing patterns.
To keep totals realistic, we run selective bottom-up checks using sampled price points across key product groups (such as oral appliances, CPAP and EPAP solutions, nasal dilators, and positional therapy wearables). We then sanity-check against supplier exposure discussed in public filings. Market inputs that matter most include obesity prevalence trends, aging population share, diagnosis and referral rates to sleep clinics and dentists, home-care penetration, replacement cycles for devices and accessories, and the share shift toward online purchasing.
Forecasting is run using scenario analysis. Growth is tied to a small set of drivers that can be updated each year, including diagnosis expansion, comfort-driven switching between device types, and expected ASP movement as connected features spread. Where visibility is weak in smaller countries, gaps are filled by applying proxy adoption curves from similar healthcare systems, and then confirmed during expert calls before finalizing.
Data Validation & Update Cycle
Validation happens in several passes, starting with consistency checks across regions, treatment types, and the implied user counts. We then run variance checks against independent indicators such as procedure volumes and device shipment discussions in public sources. If an outlier appears, assumptions are reopened, and follow-up calls are triggered to confirm whether pricing, channel mix, or adoption is driving the difference.
Before sign-off, the model and key assumptions are reviewed by a second analyst to catch definition drift and math issues. We also check the narrative against the numbers so the reported logic matches the totals. Reports are refreshed annually, with interim updates for material events that change pricing, reimbursement, or clinical practice patterns. Right before delivery, we do a final pass so clients receive the latest updated view.
Mordor Intelligence's Anti Snoring Treatment Market Sizing Compared With Other Published Estimates
Published market sizes for anti-snoring treatment can look far apart, even when they point to the same end need, because the product boundary and the year chosen as the base do not always match. Differences also come from how procedure revenues are treated, how sleep apnea devices are handled when snoring-only use cases are mixed in, and whether pricing is modeled using list prices or more realistic transaction ranges.
The table shows a higher 2026 value than several 2025-based publications. In Mordor Intelligence's model, only clinically marketed devices and snoring-related interventions are counted, with cosmetic nose strips, simple recording apps, and sprays left out because they do not represent treatment spending. Another reason for spread is the conversion from addressable snorers to treated users, since some estimates apply aggressive uptake without checking dentist-led oral appliance use, CPAP adherence patterns, and regional channel mix.
Benchmark comparison
| Source | Market Size | Gaps in Research Methodology |
|---|---|---|
| Mordor Intelligence | USD 2.25 B (2026) | |
| Industry Publisher A | USD 1.45 B (2025) | Uses a 2025 base year and does not clearly separate clinically marketed therapies from broader wellness products, which can shift the total downward or upward depending on what is included. |
| Consulting Publisher B | USD 1.68 B (2025) | Builds the total from high-level device and channel splits with limited visibility into procedure share, replacement cycles, and price dispersion across regions, which can understate markets where oral appliances and positional therapies are growing faster. |
Overall, the comparison mainly reflects scope alignment and base-year choice, followed by how each model turns the addressable snoring population into paid treatment users. By tying inputs to diagnosis, adoption, replacement cycles, and realistic pricing ranges, the final total stays transparent and repeatable when assumptions are updated.


Key Questions Answered in the Report
What is the current value of the anti-snoring treatment market?
The anti-snoring treatment market is valued at USD 2.25 billion in 2026 and is projected to grow to USD 3.69 billion by 2031.
Which device category dominates revenue?
Mandibular advancement devices hold 39.02% 2025 anti-snoring treatment market share, maintaining leadership among therapeutic options.
Why are smart wearables gaining traction?
Smart wearables combine real-time snore detection with app coaching, fostering higher user adherence and posting a 13.92% forecast CAGR.
Which region will grow the fastest through 2031?
Asia-Pacific leads with an 11.52% CAGR due to large untreated OSA populations and expanding diagnostic access.
What limits widespread CPAP adoption?
Non-adherence rates of 29–83%, influenced by comfort issues and lifestyle fit, drive many patients toward alternative devices.
How are online platforms reshaping the market?
E-commerce and telehealth subscriptions compress delivery cycles, provide coaching, and are expanding at a 14.22% CAGR, especially in urban APAC and North America.
Page last updated on:





