
Market Overview
| Study Period | 2020 - 2031 |
|---|---|
| Forecast Data Period | 2026 - 2031 |
| Base Year Market Size (2025) | USD 15.68 Billion |
| Market Size (2026) | USD 16.40 Billion |
| Market Size (2031) | USD 20.34 Billion |
| Growth Rate (2026 - 2031) | 4.40 % |
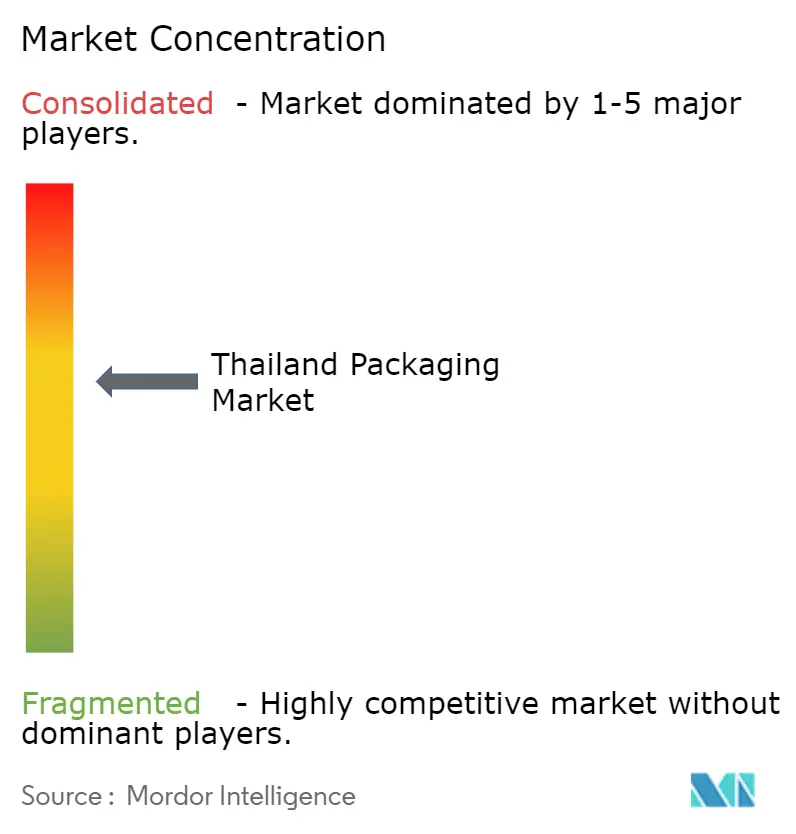
| Market Concentration | Medium |
Major Players *Disclaimer: Major Players sorted in no particular order Image © Mordor Intelligence. Reuse requires attribution under CC BY 4.0. | |
Thailand Packaging Market Analysis by Mordor Intelligence
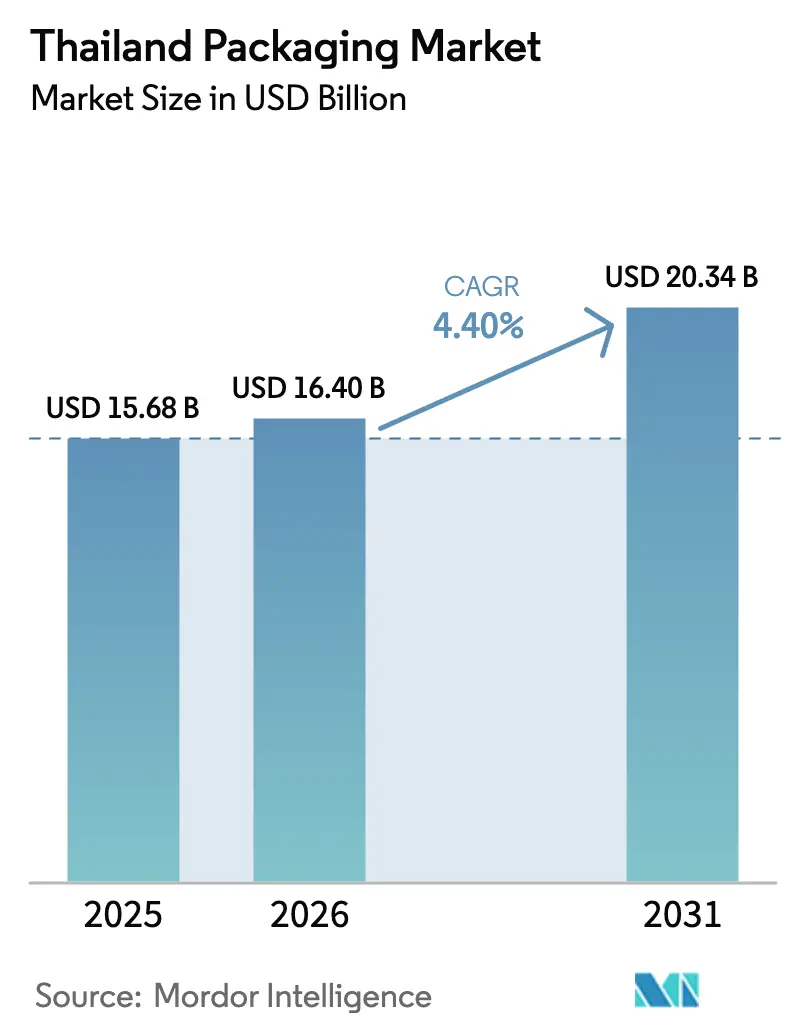
The Thailand packaging market size was valued at USD 15.68 billion in 2025 and is estimated to grow from USD 16.4 billion in 2026 to reach USD 20.34 billion by 2031, at a CAGR of 4.4% during the forecast period (2026-2031). The growth trajectory reflects Thailand’s dual role as a regional food-export powerhouse and a rising e-commerce hub, both of which stimulate demand for cost-efficient, sustainable packs. Capital inflows worth THB 721 billion (USD 20.6 billion) approved by the Board of Investment in 2024 channel fresh spending into food processing, automation, and, by extension, packaging lines. Converters are already redesigning portfolios to meet the draft Packaging Act’s anticipated extended producer responsibility targets, which favour lighter, mono-material structures over heavy, rigid formats. Meanwhile, daily parcel volumes topping 7 million accelerate the adoption of mailers and stand-up pouches that curb freight charges and minimize damage.
Key Report Takeaways
- By material type, plastic captured 42.18% of Thailand packaging market share in 2025, while recycled polyethylene terephthalate is forecast to expand at a 4.92% CAGR through 2031.
- By product type, pouches accounted for the fastest growth at a 5.01% CAGR, whereas bags led with 28.24% revenue share of the Thailand packaging market size in 2025.
- By packaging format, flexible packs dominated with 63.78% value in 2025 and are projected to widen their lead by growing at 5.25% through 2031.
- By end-user industry, food held 35.39% of 2025 revenue, yet cannabis-infused food and beverage is poised to record a 4.98% CAGR once regulatory clarity returns.
Note: Market size and forecast figures in this report are generated using Mordor Intelligence’s proprietary estimation framework, updated with the latest available data and insights as of 2026.
Thailand Packaging Market Trends and Insights
Drivers Impact Analysis*
| Driver | (~) % Impact on CAGR Forecast | Geographic Relevance | Impact Timeline |
|---|---|---|---|
| Rising Food and Beverage Output | +1.20% | National, with concentration in Central and Eastern regions | Medium term (2-4 years) |
| Growth of E-commerce and Parcel Volumes | +1.00% | National, with urban density in Bangkok, Chiang Mai, Phuket | Short term (≤ 2 years) |
| Demand for Convenient and Flexible Packs | +0.80% | National, accelerated in urban centers | Medium term (2-4 years) |
| Sustainability and Circular-Economy Mandates | +0.70% | National, with early adoption in export-oriented sectors | Long term (≥ 4 years) |
| BOI Incentives for Packaging Automation | +0.50% | National, with priority zones in Eastern Economic Corridor | Medium term (2-4 years) |
| Cannabis-Infused Food and Beverage Requires Child-Safe Packs | +0.20% | National, regulatory uncertainty limits near-term impact | Long term (≥ 4 years) |
| Source: Mordor Intelligence | |||
Rising Food and Beverage Output
Thailand shipped USD 32.8 billion worth of food products in 2024, a performance that lifts packaging demand because shelf-stable exports need multilayer barrier films that preserve flavour during long transit.[1] Capacity-utilization in domestic food factories climbed to 78% in 2025, sustaining orders for corrugated shippers, stand-up pouches, and aseptic cartons.[2] Hotels, restaurants, and institutional buyers spent USD 35.4 billion in 2025 as tourism rebounded, strengthening local pull for ready-to-eat meal kits that rely on microwaveable trays.[3] The dual export-domestic engine allows converters to transfer resin cost swings into pricing without volume loss. Consequently, rising food throughput is expected to add 1.2 percentage points to the Thailand packaging market CAGR between 2026 and 2031.
Growth Of E-Commerce and Parcel Volumes
Courier leader Kerry Express handled 7 million-8 million parcels daily during 2025, reflecting a double-digit volume climb since 2022.[4] Each parcel uses a polyethylene mailer or corrugated box, and the shift toward same-day service favours pre-formed, lightweight solutions that shorten pack-to-ship cycles. National gross-merchandise value touched THB 100 billion (USD 2.9 billion) in 2025, with fashion and health-and-beauty goods recording the highest reorder rates. Parcel carriers now request recyclable or biodegradable mailers to meet corporate climate pledges, spurring demand for paper-based bubble mailers and compostable air pillows. As the last-mile network saturates Bangkok and expands to provincial hubs, e-commerce will continue to contribute about 1 percentage point to market growth through 2028.
Demand For Convenient and Flexible Packs
Single-serve pouches, resealable bags, and portion-controlled formats increased their slice of flexible-packaging value from 22% in 2022 to 28% in 2025, mirroring smaller household sizes and on-the-go eating habits. Retail chains widen chilled and ambient meal-kit shelves, relying on multi-compartment pouches that separate sauces from proteins and capture a 15%-20% price premium over rigid trays. Modern-trade stores already represent 65% of packaged-food sales and are growing at 6% annually, further tilting demand toward value-added flexible packs. Converters integrate laser scoring, tamper-evident seals, and QR-code traceability to justify higher margins. The convenience trend is projected to lift the Thailand packaging market CAGR by 0.8 percentage points in the medium term.
Sustainability And Circular-Economy Mandates
Thailand’s draft Packaging Act, slated for 2027 enforcement, will obligate producers to fund collection and recycling proportional to tonnage placed on the market. SCG Packaging aligned early, pledging a 100% recyclable portfolio by 2030 and net-zero emissions by 2050. The Asian Development Bank estimates a USD 1.2 billion annual upside in plastic-waste valorisation if consumer participation exceeds 40%. First movers adopting mono-material films and ISO 14001 processes will capture shelf space from laggards once EPR fees start. Accordingly, sustainability mandates are set to add 0.7 percentage points to long-term market growth.
Restraints Impact Analysis*
| Restraint | (~) % Impact on CAGR Forecast | Geographic Relevance | Impact Timeline |
|---|---|---|---|
| Single-Use-Plastic Bans and Eco Taxes | -0.60% | National, with stricter enforcement in Bangkok and tourist zones | Short term (≤ 2 years) |
| Volatile Petrochemical Resin Prices | -0.50% | National, with spillover from regional crude-oil markets | Short term (≤ 2 years) |
| Shortage of Food-Grade rPET Feedstock | -0.30% | National, import dependency on Japan and South Korea | Medium term (2-4 years) |
| Low-Cost Import Competition From Vietnam and China | -0.40% | National, concentrated in corrugated and flexible-film segments | Medium term (2-4 years) |
| Source: Mordor Intelligence | |||
Single-Use-Plastic Bans and Eco Taxes
A nationwide prohibition on oxo-degradable bags, polystyrene food boxes, and plastic straws took effect on 1 January 2025, with fines up to THB 100,000 (USD 2,857) per infraction. Retailers pivoted to paper straws and bagasse containers that cost 20%-40% more, squeezing food-service margins. The ban removed roughly 50,000 metric tons of annual polystyrene demand, forcing extruders to idle lines or retool toward polypropylene. Planned eco-tax surcharges of THB 2-THB 5 per kilogram (USD 0.06-USD 0.14) on virgin resin could deepen the cost burden. Combined, these factors shave 0.6 percentage points from the Thailand packaging market CAGR in the near term.
Volatile Petrochemical Resin Prices
Polypropylene spot prices oscillated between USD 950 and USD 1,150 per metric ton during 2025, a 15%-20% quarterly swing triggered by crude-oil volatility and outages in regional crackers. PET bottle-grade resin peaked at USD 1,050 per metric ton in Q2 2025 before sliding back to USD 920 at year-end. Converters, hedged with 30-60-day supply contracts, struggled to pass spikes through annual deals, eroding gross margins by up to 300 basis points and inflating working-capital needs. Consequently, resin turbulence subtracts 0.5 percentage points from projected CAGR.
*Our forecasts treat driver/restraint impacts as directional, not additive. The impact forecasts reflect baseline growth, mix effects, and variable interactions.
Segment Analysis
By Material Type: Recycled Content Reshapes Plastic Dominance
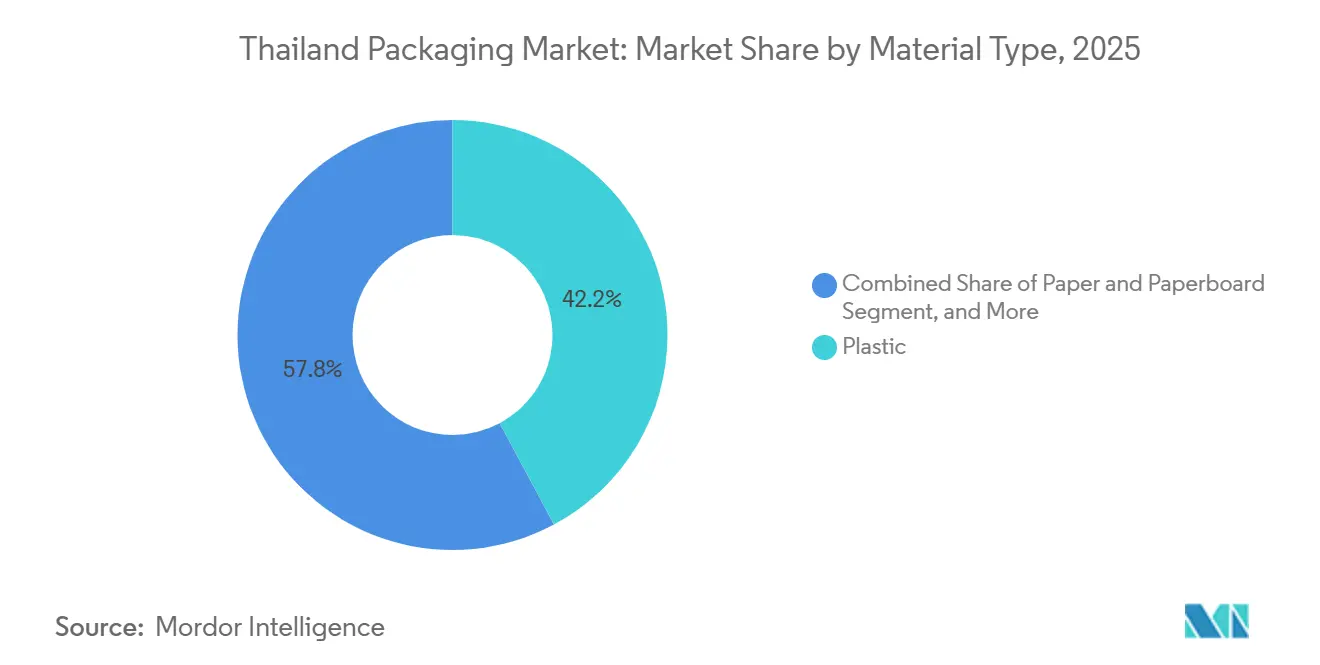
Plastic captured 42.18% of value in 2025, yet recycled PET is racing ahead at a 4.92% CAGR, underlining the pivot to circular feedstock as global brands chase 25%-50% post-consumer-resin targets. The Thailand packaging market size for rPET bottles alone is projected to grow faster than virgin equivalents because Indorama Ventures commissioned a 50,000 metric-ton food-grade line in late 2025. Polypropylene and high-density polyethylene grow in the low-4% range but face eco-tax headwinds, while polystyrene demand collapsed post-ban.
Paper and paperboard represented about 28% of 2025 value, buoyed by 5.2% output growth at domestic mills that meet surging e-commerce box orders. Metal held 18%, its advance tied to Thai Beverage Can and Ball Corporation investments in lightweight aluminium technology. Glass followed at 12%, with BG Container Glass banking on furnace-upgrade efficiencies but conceding share to lighter PET bottles. Altogether, material dynamics demonstrate how sustainability premiums and logistics economics reshape the Thailand packaging market.

By Product Type: Pouches Outpace Bags in Flexible Segment
Bags accounted for 28.24% of 2025 revenue, yet pouches grow quicker at 5.01% as consumers favour resealable, shelf-standing formats. The Thailand packaging market share for pouches benefits from 12%-15% converter margins, higher than commodity bag lines, because of zipper and spout features. Films and wraps rise 4.7% thanks to export palletization and greenhouse farming in the Eastern Economic Corridor.
Rigid plastics bottles, jars, and caps collectively post a 4.2% CAGR, aided by beverage and personal-care demand. Tethered caps add USD 0.01-USD 0.02 each yet prevent littering and meet forthcoming EPR rules. Corrugated boxes, folding cartons, and molded-fiber takeaway packs round out paper products, leveraging the January 2025 foam ban to win food-service contracts. The product landscape signals a continuing tilt toward value-added formats within the Thailand packaging market.
By Packaging Format: Flexible Dominance Widens on Cost and Sustainability
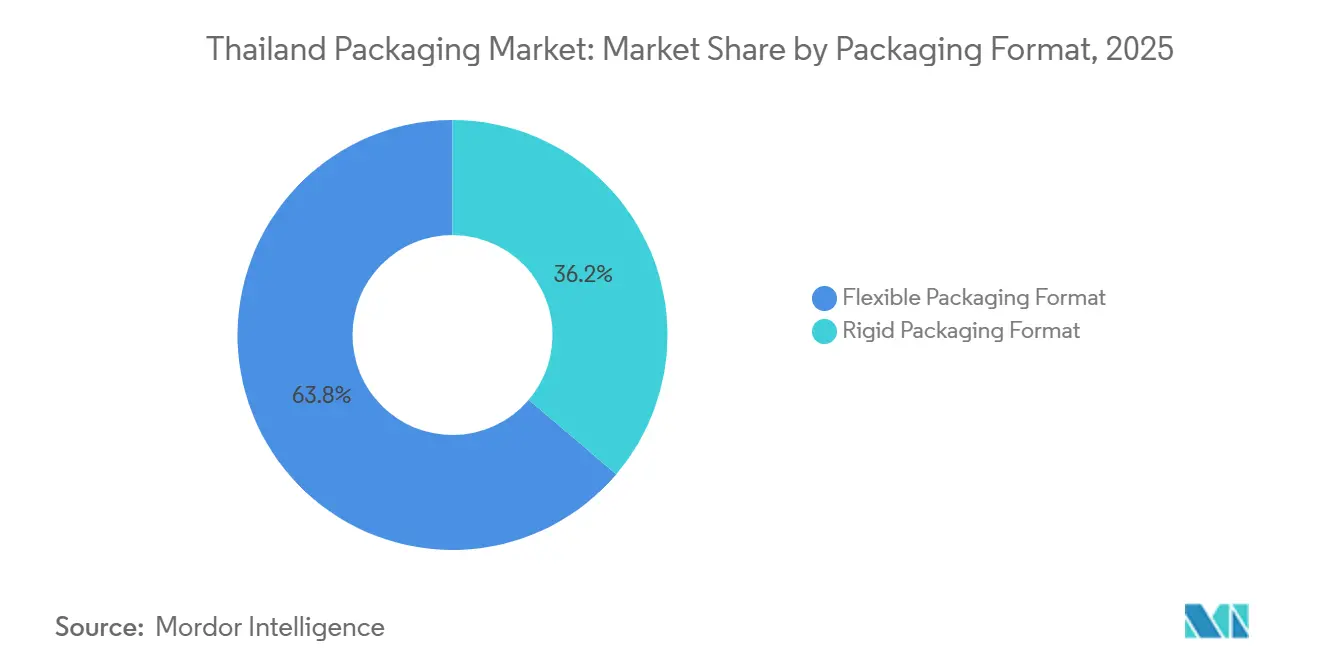
Flexible packs delivered 63.78% of 2025 value and should extend to nearly two-thirds by 2031, growing at 5.25%. Each stand-up pouch or mailer uses up to 80% less material weight and slashes freight carbon, advantages magnified by 7-8 million daily parcels. Thailand packaging market share gains for flexible converters also stem from their 14%-16% EBITDA margins versus 10%-12% for rigid lines.
Rigid formats keep relevance in beverages and pharmaceuticals, yet single use bans and heavier EPR fees cap growth at 4%. Once the Packaging Act imposes weight-based levies, analysts expect another 50-100 basis-point swing toward flexible options. The format contest will thus hinge on recyclability credentials and design-for-reuse innovations.
By End-User Industry: Food Leads, Cannabis Uncertainty Clouds Outlook
Food commanded 35.39% of 2025 value, riding record exports of ready-to-eat meals and coconut water that need aseptic cartons, MAP pouches, and microwaveable trays. Beverage ranked second with 22%, propelled by aluminium-can expansion catering to energy drinks. Pharmaceutical packs grew 4.8% on blister, vial, and child-resistant-closure adoption, while cosmetics leaned on refillable compacts for a 4.6% CAGR.
Industrial and agriculture segments move in the high-3% to low-4% bracket as petrochemical and greenhouse investments rise. Cannabis-infused products, although a small base, still boast a 4.98% forecast CAGR contingent on policy reset after the late-2024 recriminalization that stranded child-resistant-closure inventory. End-use diversity cushions the Thailand packaging market against cyclical jolts.
Geography Analysis
The Central and Eastern regions, home to Bangkok and the Eastern Economic Corridor, generate the bulk of Thailand packaging market revenue because they host food-processing clusters, petrochemical complexes, and the highest parcel densities. E-commerce fulfilments centers near Bangkok’s ring roads amplify demand for corrugated shippers and polyethylene mailers. Meanwhile, coastal ports in Chonburi and Rayong drive export flows that favour moisture-barrier films and seaworthy stretch wraps.
Northern hubs such as Chiang Mai and Chiang Rai exhibit rising consumption of on-the-go snacks and ready-to-drink beverages, expanding local need for stand-up pouches and lightweight cans. Logistics operators extend same-day delivery to these secondary cities, thereby multiplying parcel mailer requirements. The Northeast, historically agrarian, starts to adopt silage films and fertilizer bags as greenhouse projects spread under government irrigation initiatives.
In the South, Phuket and Hat Yai record high tourist turnover that accelerates single-serve beverage sales, pushing aluminium-can lines toward full capacity. The border trade with Malaysia channels corrugated boxes and returnable glass bottles into cross-border supply chains. Altogether, geographical dispersion balances the Thailand packaging market, ensuring growth is not overly reliant on any single province.
Regulatory Landscape
Thailand’s packaging regulations are tightening around food-contact safety and circularity. In February 2026, the Thailand Food and Drug Administration proposed amendments to the Ministry of Public Health Announcement No. 92 (1985) on food containers, with stronger migration-limit focus for substances including lead, cadmium, BPA, and PFAS. This raises compliance requirements for plastics, paper, inks, and coatings used in direct food contact.
On sustainability, the Ministry of Natural Resources and Environment is developing the Draft Sustainable Packaging Management Act to formalize extended producer responsibility (EPR), set sustainable-design criteria, and establish a Sustainable Packaging Management Policy Committee. Export-facing players are also monitoring external compliance triggers, including the EU Packaging and Packaging Waste Regulation applying from August 12, 2026, which is feeding back into material choices and documentation practices across Thailand’s packaging supply chain.
Competitive Landscape
Thailand’s packaging arena is moderately concentrated: the top five suppliers control roughly 40%-45% of market value yet compete alongside 200 smaller converters. SCG Packaging leverages vertical integration with petrochemical affiliates to secure resin at stable pricing and co-develop recyclable designs with multinational brand owners. BG Container Glass banks on furnace modernization to trim gas use by 8% and raise throughput 15%, offsetting glass’s weight disadvantage. TPAC Packaging specializes in custom PET bottles and has implemented predictive-maintenance sensors that lift line uptime by 10%.
International players intensify rivalry. Amcor rolled out mono-material polyethylene snack pouches and pilots in-store film collection bins in Bangkok and Phuket. Huhtamaki introduced a compostable bagasse clamshell that wins contracts from quick-service restaurants affected by the foam ban. Sealed Air markets fiber-based and mono-material cushioning that satisfies courier recyclability mandates. Ball Corporation scales lightweight two-piece cans to trim aluminium input by 10%, curbing exposure to metal price spikes.
Smaller firms still find room by offering agile, short-run services and specialty tooling for pharma, cosmetics, and child-resistant formats. However, upcoming EPR fees and ISO 14001 requirements may raise compliance costs, accelerating consolidation as under-capitalized players exit or merge. Technology adoption digital twins, vision inspection, and automated plate-mounting will likely separate winners from laggards over the next five years.
Thailand Packaging Industry Leaders
-
SCG Packaging Public Co. Ltd
-
BG Container Glass Public Co. Ltd
-
TPAC Packaging Public Co. Ltd
-
Thai Beverage Can Co. Ltd
-
TBPI Public Co. Ltd
- *Disclaimer: Major Players sorted in no particular order
Market Opportunities and Future Outlook
EPR-readiness and food-contact compliance are creating whitespace for converters that can shift quickly to mono-material structures and validated food-safe materials, particularly in flexible packaging where redesign can reduce weight-based obligations. The February 2026 FDA proposal to update food-container requirements (MOPH Announcement No. 92) also increases demand for testing capability, traceability, and compliant inks and adhesives in food, beverage, and home-care applications.
Capability build-out is tracking these needs. SCG Packaging (SCGP) stated a 2026 investment budget of THB 10,000 million to expand consumer packaging, integrate production, and implement automation and artificial intelligence, indicating a push toward higher productivity and more complex pack formats. Industry bodies are also expanding the talent and export pipeline: the Thai Packaging Association launched the Packaging Future Skills Initiative (design for recyclability, data-driven production, sustainable materials), while the Department of International Trade Promotion and the Thai Packaging Association continue programs such as the Printing and Packaging Pavilion to support international trade opportunities and regulatory compliance for global market entry.
Recent Industry Developments
- June 2026: SCG Packaging (SCGP) collaborated with Kao Thailand, SCGC, and Dow Thailand to unveil a mono-material refill bag for Magiclean floor cleaner. The shift from multi-layer flexible packaging to a polyethylene-compatible structure supports recyclability pathways and provides a reference design for other consumer-goods packs facing EPR and brand sustainability targets.
- May 2026: SCGP announced a THB 748 million investment to expand a fiber packaging production base in southern Vietnam, including corrugated-container capacity planned at 26,800 tons per year with commercial operation targeted for September 2027. The added regional capacity strengthens SCGP’s integrated ASEAN supply footprint and increases competitive pressure on lead times and service levels for corrugated and e-commerce shipper demand served from Thailand.
- April 2026: BG Container Glass (BGC) completed the acquisition of an additional 25.90% stake in Bangkok Can Manufacturing Co., Ltd. from Toyo Seikan Co., Ltd., taking its ownership to 51%. This deepens BGC’s position in beverage cans and supports a broader packaging portfolio approach alongside its glass operations, aligning with brand shifts toward lightweight, on-the-go formats.
Research Methodology Framework and Report Scope
Market Definition and Coverage
This market covers packaging products sold in Thailand across major materials and formats, counted as the value of packaging supplied to end users such as food, beverages, pharma, and other industries.
Scope exclusions: It does not count non-packaging machinery, nor does it treat recycling and waste management services as part of packaging sales.
Segmentation Overview
- By Material Type
- Paper and Paperboard
- Plastic
- Polypropylene (PP)
- HDPE and LDPE
- PET
- PVC
- PS
- Other Plastics
- Metal
- Container Glass
- By Product Type
- Paper and Paperboard Product
- Folding Carton and Rigid Boxes
- Corrugated Boxes and Containers
- Single-Use Paper Products
- Other Paper and Paperboard Types
- Plastic Product
- Rigid Plastics
- Bottles and Jars
- Caps and Closures
- Bulk-Grade Products
- Other Rigid Plastics
- Flexible Plastics
- Pouches
- Bags
- Films and Wraps
- Other Flexible Plastics
- Rigid Plastics
- Metal Product
- Cans
- Caps and Closures
- Aerosol Containers
- Other Metal Products
- Container Glass Product
- Bottles
- Jars
- Paper and Paperboard Product
- By Packaging Format
- Rigid Packaging Format
- Flexible Packaging Format
- By End-User Industry
- Food
- Beverage
- Pharmaceutical and Medical
- Personal Care and Cosmetics
- Industrial and Chemical
- Agriculture
- Automotive
- Other End-User Industries
Data Sources, Market Sizing, and Validation
Desk Research
Desk research was used to set market boundaries and to anchor the model to Thailand-specific demand and production signals. We relied on public sources such as Thailand's National Statistical Office, the Ministry of Commerce trade statistics, Board of Investment announcements, and customs trade releases, which help explain packaging-linked output movements.
To translate these signals into a sizing-ready view, we also reviewed packaging and materials information from sources such as relevant industry association publications, peer-reviewed journals on packaging materials, and official environmental policy notes that influence material substitution. Company annual reports, investor presentations, and reputable business press were used to cross-check capacity additions, pricing commentary, and end-market exposure. Select paid subscriptions were used only for company financials, patent lookups, and shipment-level trade context. These desk sources are illustrative, and other public references were also used to collect, validate, and clarify data points during the work.
Primary Interviews and Surveys
Primary work focused on validating volumes, the pricing logic, and mix shifts by format and material, since these drivers can change faster than headline GDP or industrial production. We spoke with converters, raw material participants, brand owners, and channel experts across Thailand, and then ran follow-up checks to confirm where assumptions differed by end-use demand cycles and sustainability requirements.
Distribution of primary research fieldwork respondents
| Company type | Respondent position |
|---|---|
| Top tier: 38% | CXOs: 20% |
| Mid tier: 40% | Functional/Unit leaders: 25% |
| Smaller Players: 22% | Managers: 55% |
Market-Sizing & Forecasting
Sizing starts from a top-down view, where Thailand packaging demand is reconstructed from end-use output and consumption signals, and then allocated into packaging needs using practical intensity and mix assumptions. To keep totals realistic, we corroborate results with selective bottom-up checks, such as sampled price per kg or price per unit and supplier and converter roll-ups in the most visible categories.
Key model inputs include packaging material mix shifts (paper, plastics, metal, and glass), rigid versus flexible format trends, food and beverage output indicators, export-oriented manufacturing momentum, and e-commerce shipment growth that increases the share of transit packaging in the mix. Pricing is handled through observed resin, paper, and energy cost direction, followed by interview-based confirmation of pass-through timing, which is then reflected in average selling price progression.
Forecasting uses scenario analysis supported by simple regression-style relationships between packaging demand and end-use production and trade trends, and then gets adjusted using expert consensus on regulation-led substitution and capacity utilization. Where bottom-up visibility is weaker for smaller converters and informal supply, gaps are handled through conservative share-based allocation tied back to the top-down demand pool, and then rechecked in primary follow-ups.
Data Validation & Update Cycle
Outputs are tested through triangulation across independent signals, so sudden jumps are flagged and explained before figures are finalized. We compare model results with trade movements, input cost direction, and observed end-use production patterns, and then run variance checks so category totals reconcile back to the overall market.
A second analyst review is completed to stress-test assumptions with the largest impact, such as price progression and material mix shifts. When outliers appear, we re-contact interviewees for clarification. Reports are refreshed annually, with interim updates when material events occur, and a final pre-delivery pass is completed so clients receive the latest updated view.
Mordor Intelligence's Thailand Packaging Market Size Measured Against Other Published Estimates
Published packaging market estimates for Thailand can vary even when they refer to the same country and time period, because packaging is used across many industries and the definition can be applied differently. Differences usually come from what is counted as packaging value, how prices are converted into USD, and how quickly assumptions are refreshed when material costs and demand mix change.
The main gap comes from scope choices around whether adjacent activities and non-packaging value are bundled into the total, along with how rigid and flexible packaging are priced and blended across end uses. Here, Mordor Intelligence counts only packaging product value supplied in Thailand and keeps price progression tied to material and format mix checks rather than broad inflation multipliers.
Benchmark comparison
| Source | Market Size | Gaps in Research Methodology |
|---|---|---|
| Mordor Intelligence | USD 16.40 B (2026) | |
| Trade Journal A | USD 15.70 B (2025) | Uses a different base year and is presented as an approximate headline value, with limited visibility on how rigid versus flexible mix and material pricing were normalized across end uses. |
| Industry Portal B | USD 26.30 B (2023) | Likely reflects a broader industry revenue view that can blend packaging products with adjacent activities and local-currency reporting, which can inflate totals when converted to USD and compared to packaging-only value. |
The spread across figures is mainly explained by what gets counted as packaging sales versus a wider packaging-related economy, and by base-year and currency handling. By keeping inputs tied to observable demand drivers like end-use output, mix by material and format, and realistic ASP movement, the final number remains traceable to repeatable steps that can be rechecked when conditions change.
Key Questions Answered in the Report
What is the projected value of the Thailand packaging market by 2031?
Forecasts indicate the market will reach USD 20.34 billion by 2031, supported by food exports, e-commerce, and sustainability mandates.
Which packaging format is growing faster in Thailand?
Flexible formats lead with a 5.25% CAGR through 2031, widening their share beyond the current 63.78%.
How significant is recycled PET in Thailand's packaging landscape?
Recycled PET is the fastest-growing plastic substrate at a 4.92% CAGR, fueled by brand commitments to integrate up to 50% post-consumer resin.
What impact do single-use plastic bans have on local converters?
The January 2025 bans eliminated 50,000 metric tons of polystyrene demand and raised costs 20%-40% for alternative materials, trimming near-term margins.
Who are the leading companies in Thailand's packaging sector?
SCG Packaging, BG Container Glass, TPAC Packaging, Thai Beverage Can, and Amcor together hold roughly 40%-45% of market value.
How is e-commerce shaping packaging demand?
Daily parcel volumes above 7 million drive adoption of lightweight mailers and stand-up pouches, adding around 1 percentage point to overall CAGR in the short term.