Secondary Packaging Market Size and Share
Market Overview
| Study Period | 2020 - 2031 |
|---|---|
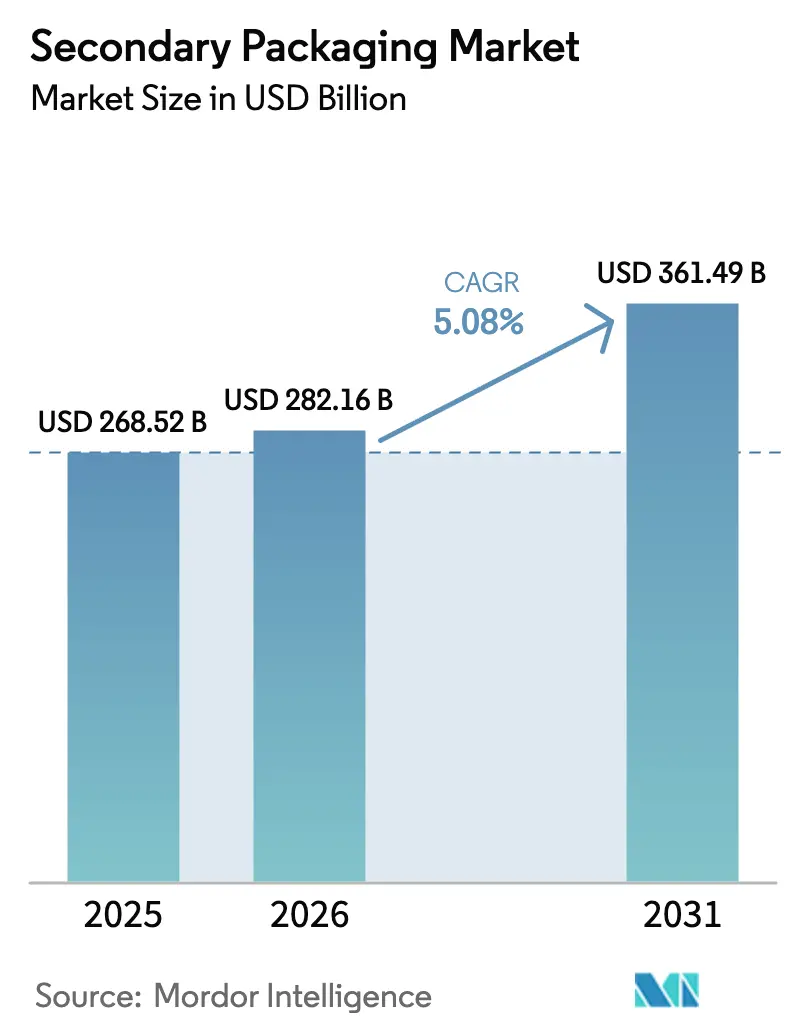
| Market Size (2026) | USD 282.16 Billion |
| Market Size (2031) | USD 361.49 Billion |
| Growth Rate (2026 - 2031) | 5.08% CAGR |
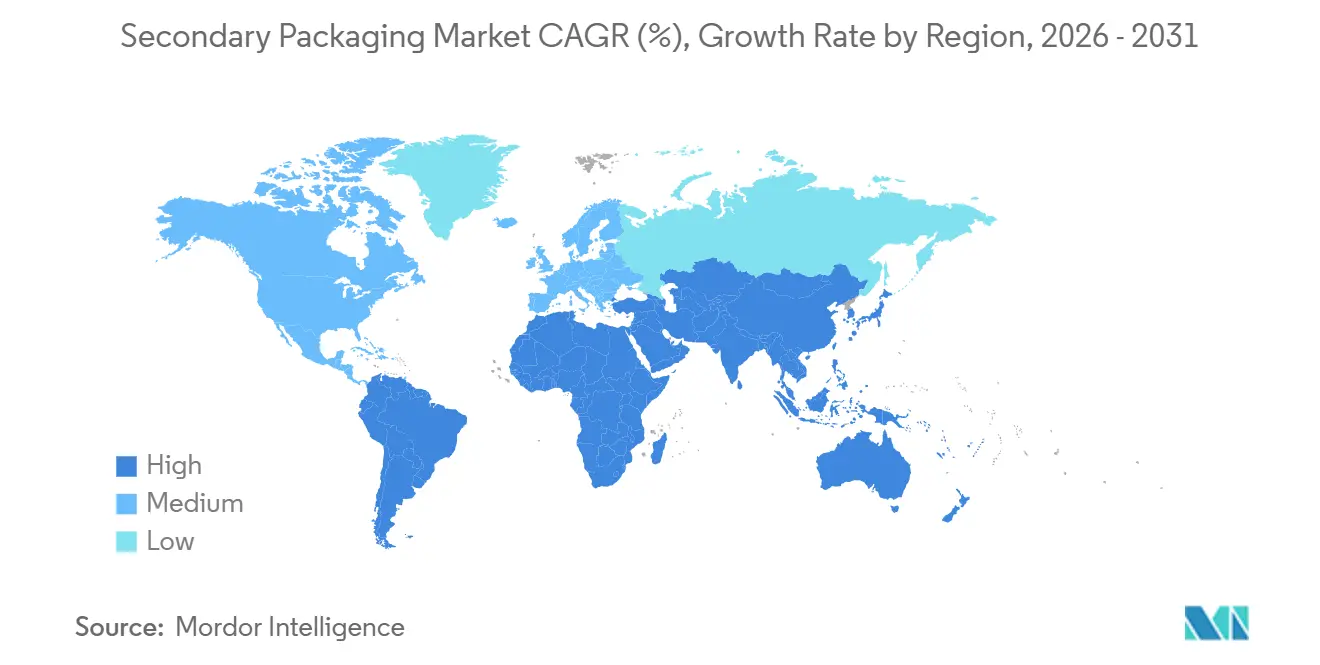
| Fastest Growing Market | Asia Pacific |
| Largest Market | Asia Pacific |
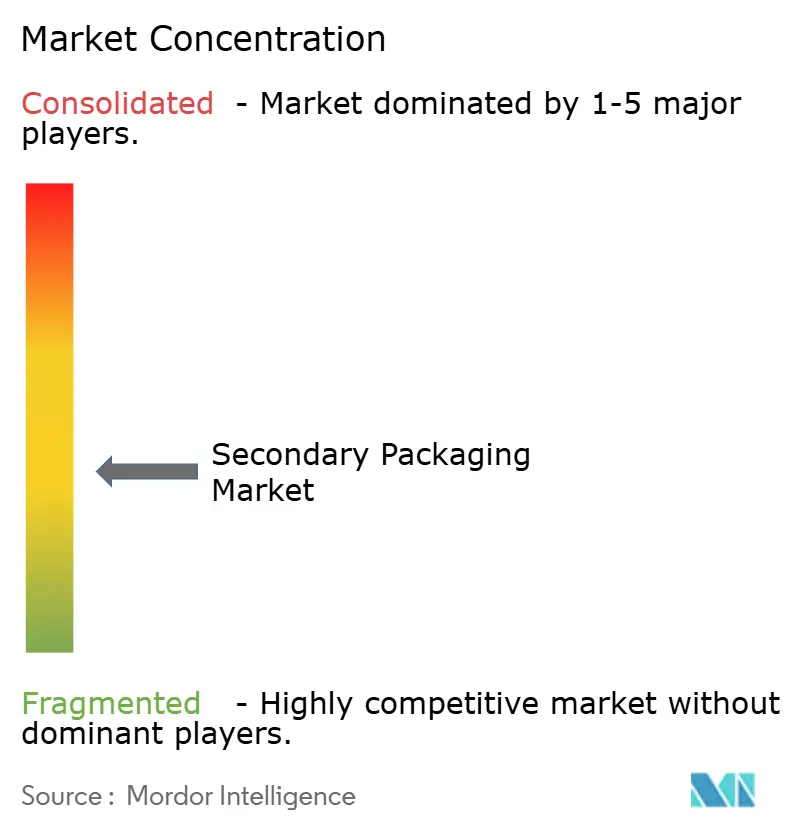
| Market Concentration | Medium |
Major Players *Disclaimer: Major Players sorted in no particular order Image © Mordor Intelligence. Reuse requires attribution under CC BY 4.0. | |
Secondary Packaging Market Analysis by Mordor Intelligence
The Secondary packaging market size was valued at USD 268.52 billion in 2025 and estimated to grow from USD 282.16 billion in 2026 to reach USD 361.49 billion by 2031, at a CAGR of 5.08% during the forecast period (2026-2031). Robust e-commerce fulfillment, regulatory pressure for reusable transport formats, and capital migration toward fully automated packing lines are reshaping demand patterns. Corrugated converters are slimming flute profiles to cut fiber use while preserving crush resistance, a shift that lowers freight costs and aligns with last-mile dimensional-weight rules. Brand owners are specifying shelf-ready cartons that double as point-of-sale displays, reducing in-store labor and advancing merchandising consistency. At the same time, retailers’ zero-waste mandates are accelerating the pivot toward returnable transit packaging, rigid plastic crates, and water-based barrier coatings that assure recyclability without compromising moisture and oxygen protection. Investment in robotics, machine vision, and predictive maintenance is compressing payback horizons, enabling even mid-tier converters to justify automation retrofits and meet the cycle-time targets of micro-fulfillment centers.
Key Report Takeaways
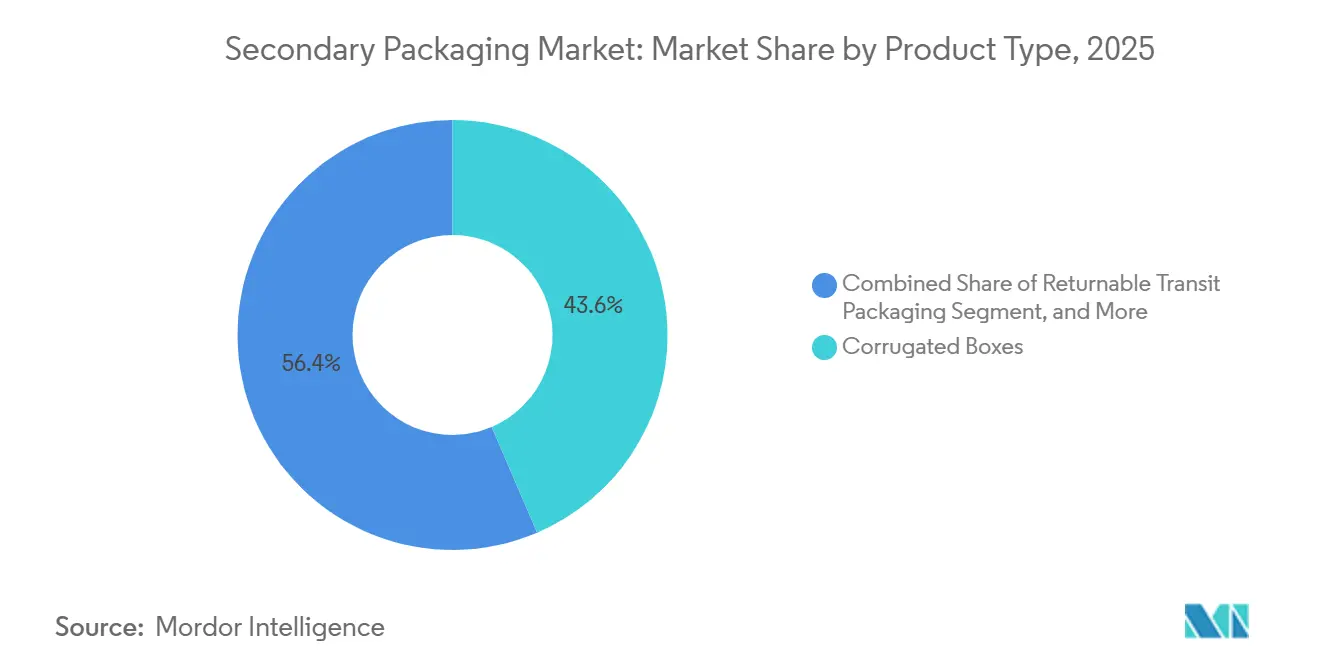
- By product type, corrugated boxes led with 43.56% of the Secondary packaging market share in 2025, while returnable transit packaging is advancing at a 6.07% CAGR through 2031.
- By material, paper and paperboard accounted for 54.89% of the Secondary packaging market size in 2025, whereas hybrid and multi-material solutions are expanding at a 6.12% CAGR over the same period.
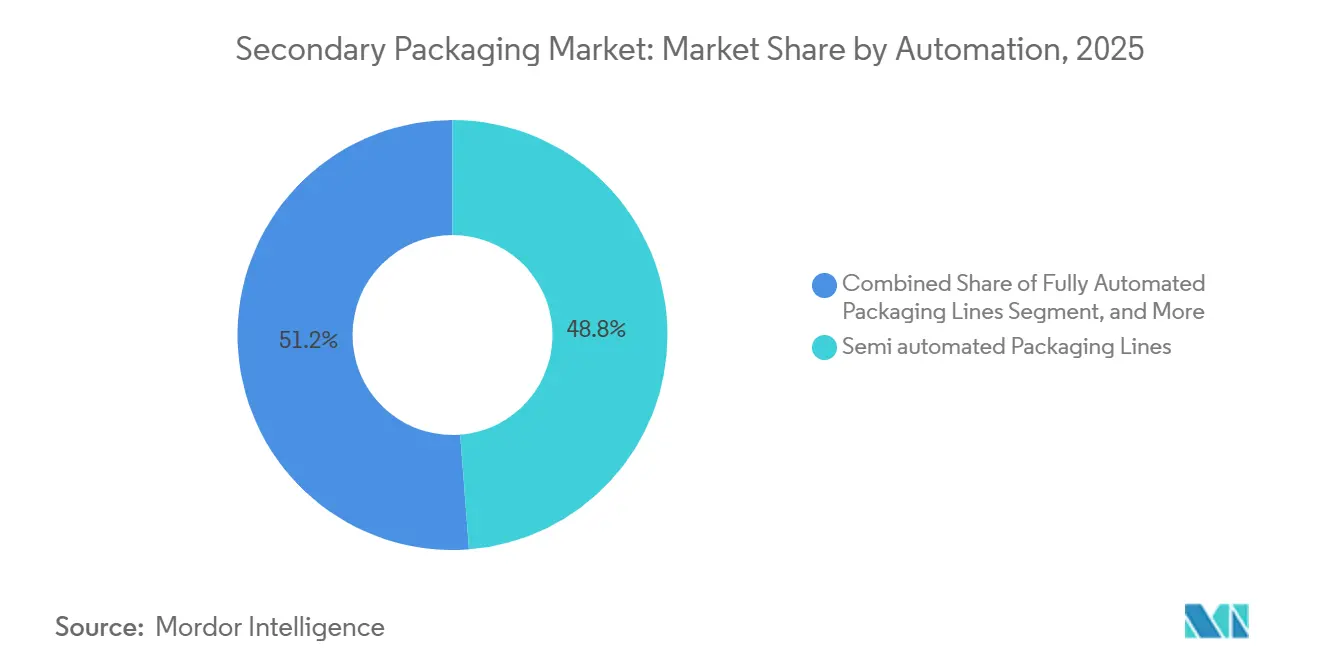
- By automation level, semi-automated lines accounted for 48.77% of revenue share in 2025; fully automated lines posted the fastest growth at a 5.67% CAGR through 2031.
- By end-user industry, e-commerce and logistics registered the highest projected CAGR at 6.44% through 2031, surpassing food, which remained the largest consumer at 29.83% in 2025.
- By geography, Asia Pacific captured 36.71% revenue in 2025 and is poised to grow at a 6.09% CAGR, outpacing North America and Europe during 2026-2031.
Note: Market size and forecast figures in this report are generated using Mordor Intelligence’s proprietary estimation framework, updated with the latest available data and insights as of 2026.
Global Secondary Packaging Market Trends and Insights
Drivers Impact Analysis*
| Driver | (~) % Impact on CAGR Forecast | Geographic Relevance | Impact Timeline |
|---|---|---|---|
| E-commerce boom fueling corrugated demand | +1.2% | Global, concentrated in North America, Europe, and Asia Pacific urban corridors | Short term (≤ 2 years) |
| Shift to automation-ready pack formats | +0.9% | North America and Europe, extending to Asia Pacific manufacturing hubs | Medium term (2-4 years) |
| Brand owner push for shelf-ready solutions | +0.6% | North America and Europe retail chains, emerging in Asia Pacific modern trade | Medium term (2-4 years) |
| Retailers’ zero-waste mandates | +0.8% | Europe under PPWR, North America state-level EPR, Asia Pacific voluntary commitments | Long term (≥ 4 years) |
| Micro-fulfillment centers driving case-ready | +0.5% | North America and Europe urban centers, pilot rollouts in Asia Pacific | Short term (≤ 2 years) |
| AI-enabled online quality inspection | +0.4% | Global, with early adoption in North America and Europe automated facilities | Medium term (2-4 years) |
| Source: Mordor Intelligence | |||
E-Commerce Boom Fueling Corrugated Demand
Surging parcel volumes continue to push baseline corrugated case consumption higher. The European Packaging and Packaging Waste Regulation enforces 40% reuse targets by 2030 alongside strict void-space limits, compelling shippers to right-size cartons and adopt reusable formats.[1]European Commission, “Packaging and Packaging Waste Regulation,” europa.eu Amazon’s global network, which favors frustration-free packaging, has boosted demand for on-demand die-cutting systems that switch SKUs in seconds, enabling converters to supply minimal-material boxes that still meet burst-strength criteria. Last-mile carriers’ dimensional-weight fees reward lighter, smaller packages, pushing adoption of cartonization software that typically trims board usage 12-18%. Coupled with containerboard capacity additions in China exceeding 6 million tons, this demand keeps linerboard mills at high utilization despite regional slowdowns.
Shift to Automation-Ready Pack Formats
Collaborative robots and autonomous mobile robots are now standard on new secondary lines, with return on investment often achieved within 18 months for high-throughput sites. Converters are standardizing case footprints, so robotic grippers can operate at full speed, trading SKU-specific customization for the repeatability automation requires. Micro-fulfillment centers such as Ocado’s facilities process up to 50,000 orders per week within tight urban footprints, mandating cartons that can be erected, loaded, sealed, and palletized without human touch.[2]Ocado Group, “Automated Fulfillment Technology,” ocadogroup.com Equipment suppliers who demonstrate total cost of ownership advantages, lower scrap, fewer injuries, and reduced downtime gain preference as brand owners insist on two-year payback horizons.
Brand Owner Push for Shelf-Ready Solutions
Retail chains are shifting replenishment labor to the supply chain by specifying perforated tear-strips, pre-scored panels, and high-impact graphics that convert shippers into ready-to-display trays. ISO 21067 standards now guide structural performance and visual presentation, giving multinational brands an avenue to harmonize pack designs across regions. Converters skilled in rapid structural prototyping capture price premiums because shelf-ready formats must withstand pallet compression while opening cleanly in the aisle. Early adopters report 30-40% reductions in in-store restocking time, translating into lower operating expenses for retailers and repeat business for qualified packaging suppliers.
Retailers’ Zero-Waste Mandates
Extended producer responsibility laws in California, Oregon, Maine, and Colorado shift end-of-life costs to brand owners, motivating designs that reduce mass and improve recyclability. Europe’s PPWR assigns recyclability grades that may restrict market access, accelerating the phase-out of laminated paper-plastic-foil composites. Converters respond with water-based barrier coatings such as Michelman’s TopScreen that enable grease- and moisture-resistant paperboard without polyethylene layers. Reusable container poolers like IFCO, which operate 380 million crates globally, deliver carbon footprint reductions of up to 60% compared with single-use corrugated, positioning returnables as a compliance pathway.[3]IFCO Systems, “Reusable Plastic Container Operations,” ifco.com
Restraints Impact Analysis*
| Restraint | (~) % Impact on CAGR Forecast | Geographic Relevance | Impact Timeline |
|---|---|---|---|
| Surplus paperboard capacity in Europe | -0.7% | Europe with spillover to North America and Asia Pacific export lanes | Short term (≤ 2 years) |
| Rising cost volatility of recycled fiber | -0.5% | Global, acute in North America and Europe where collection rates have slid | Medium term (2-4 years) |
| Persistent plastics tax uncertainty | -0.3% | Europe own-resource levy, UK PRN, emerging Asia Pacific levies | Long term (≥ 4 years) |
| Capex hurdle for robotics retrofits | -0.4% | North America and Europe legacy facilities facing space and utility constraints | Medium term (2-4 years) |
| Source: Mordor Intelligence | |||
Surplus Paperboard Capacity in Europe
CEPi recorded a 1.5% drop in European paper and board output during 2025, with folding-carton tonnage sliding 5.6% as post-pandemic inventory destocking continued. Utilization hovering near 75% keeps pricing pressure on mills, many of which battle elevated energy and carbon-compliance costs. Asian producers added 16 million tons of containerboard capacity between 2020-2025, diverting surplus into European ports and undercutting domestic pricing. German and Czech mills have announced selective idle shifts, but oversupply remains until permanent closures or grade conversion ease the imbalance.
Rising Cost Volatility of Recycled Fiber
Old corrugated container prices whipsawed between USD 75-95 per ton domestically and USD 136-139 per ton on export lanes in early 2025 amid freight disruptions in the Red Sea and tight bale supply. Municipal curbside recovery of corrugated boxes in the United States fell to 20% in 2025 from 32% in 2023 as budget-driven service cuts and contamination worsened. Simultaneously, mill closures by Pixelle, International Paper, and Georgia-Pacific removed demand, periodically flooding the market with low-priced fiber but foreshadowing tighter supply when new recycled-content mandates mature after 2027. This volatility complicates converter pricing and margin management.
*Our forecasts treat driver/restraint impacts as directional, not additive. The impact forecasts reflect baseline growth, mix effects, and variable interactions.
Segment Analysis
By Product Type: Reusable Formats Gain Traction
Corrugated boxes delivered 43.56% of the Secondary packaging market revenue in 2025, anchored by e-commerce and food-service distribution. Automotive, grocery, and pharmaceutical supply chains are increasingly adopting returnable transit packaging, which is driving a compound annual growth rate (CAGR) of 6.07%. These industries are leveraging the advantages of pooling loops, enabling them to achieve cost savings ranging from 10% to 30% while simultaneously reducing their carbon footprints.
Technology upgrades propel adoption. Corrugated boxes now ship with pre-scored panels and RFID-enabled labels that unlock robotic case erector speeds below 10 seconds per cycle, helping micro-fulfillment hubs meet 15-minute dispatch targets. Returnable crate operators embed tracking chips, cutting loss rates to under 1% and raising cycle velocity while shrinking the container pool required for steady operations. Folding cartons retain niche growth in pharmaceuticals and cosmetics, where tamper evidence and premium graphics matter, whereas wraps and shrink sleeves persist where transparency and barcode readability are essential.


By Material: Fiber Substrates Layer Functional Barriers
Paper and paperboard captured 54.89% of revenue in 2025, yet hybrid structures are growing at 6.12% as converters deploy bio-based coatings and polymer laminates that preserve recyclability. Michelman’s TopScreen and Stora Enso’s FibreForm coatings provide an advanced solution by enabling paperboard trays to effectively handle greasy or moist foods without requiring polyethylene extrusion. This innovation positions fiber formats to achieve PPWR grade-A recyclability, aligning with sustainability goals and enhancing their applicability in environmentally conscious packaging solutions.
Plastics remain vital for reusable crates and pallet wraps, but demand for single-use plastic film is plateauing amid consumer scrutiny and impending levies. Metals maintain a stable share in aerosol and beverage packs, while glass sees incremental gains in premium segments but suffers breakage risk in direct-to-consumer channels. Hybrid laminates of paper-foil-polymer deliver barrier excellence but now confront grade-C recyclability hurdles, motivating research into mono-material alternatives with water-soluble or mechanically delaminable layers.
By Automation Compatibility: Robotics Reshape Line Economics
Semi-automated lines still account for 48.77% of revenue due to an entrenched base of case erectors and palletizers that require manual changeovers. Micro-fulfillment centers are encountering significant challenges in achieving sub-15-minute operational cycles when utilizing hybrid labor models. Consequently, these centers are increasingly adopting fully automated configurations, which are experiencing an annual growth rate of 5.67% in implementation.
Brand owners increasingly demand two-year paybacks, forcing equipment OEMs to quantify labor savings, scrap reduction, and uptime improvements in hard dollars. Collaborative robots bridge the gap for mid-tier sites, handling repetitive tasks such as carton loading or label application without requiring wholesale footprint changes. Machine vision from Cognex and Keyence spots print defects or seal gaps at 200 cartons per minute, curbing rework and retailer chargebacks.
By End-User Industry: E-Commerce Outpaces Legacy Channels
Food retained 29.83% demand share in 2025, driven by chilled proteins and shelf-stable staples shipped in ventilated corrugated. As parcel traffic stabilizes above pre-pandemic levels and dimensional-weight regulations increasingly favor the use of optimized secondary packaging, the e-commerce and logistics sector demonstrates the highest compound annual growth rate (CAGR) at 6.44%.
Healthcare and pharmaceutical buyers specify folding cartons with serialized barcodes and temperature indicators to satisfy DSCSA and EU Falsified Medicines Directive compliance. Beverage brands migrate from shrink-wrapped trays to shelf-ready cartons, eliminating restock labor and capturing front-of-store visibility. Consumer electronics suppliers develop cushioning inserts that double as unboxing experiences, mitigating 15-20% return rates common in online sales. Industrial goods continue to favor reusable plastic totes and steel racks, although capital intensity restricts pooling adoption to predictable, high-volume flows.
Geography Analysis
Asia Pacific contributed 36.71% of global revenue in 2025 and is projected to expand at a 6.09% CAGR to 2031, powered by China’s 6 million-ton containerboard build-out and India’s corrugated sector growing 8-10% annually. E-commerce heavyweights Alibaba, JD.com, and Flipkart foster demand for lightweight corrugated engineered for parcel sortation. Cold-chain build-outs across Indonesia, Vietnam, and Thailand boost insulated secondary formats that protect proteins and vaccines during last-mile delivery. Japan’s aging demographic pivots packaging toward smaller, tamper-evident pharmaceutical cartons, while South Korea’s electronics clusters require anti-static inserts and returnable tote systems to shuttle semiconductors between fab and assembly lines. Regulatory harmonization lags; China’s province-level enforcement of recycled-content rules complicates supply-chain planning but signals long-term upside for fiber-recycling infrastructure.
North America commands roughly one-quarter of the Secondary packaging market, yet growth is moderating as e-commerce maturity slows volume gains. State-level extended producer responsibility laws now impose packaging-waste fees that rise with unit mass and non-recyclability, steering converters toward mono-material designs and incentivizing returnables. Amazon and Walmart continue to expand automated fulfillment hubs, sustaining investment in robotics-friendly shippers that assemble, load, and seal without manual touches. Mexico’s export-oriented manufacturing is driving the adoption of reusable transit packaging along automotive and white-goods corridors to the United States, squeezing corrugated demand but boosting service revenue for poolers.
Europe holds a similar revenue slice, yet surplus paperboard capacity and stringent PPWR mandates result in divergent country-level trends. Germany and the Nordics accelerate adoption of reusable plastic crates for grocery logistics, while Southern Europe invests in digital printing to enable converters to supply seasonal SKU micro-runs to Mediterranean produce exporters. The United Kingdom’s evolving Packaging Recovery Note scheme adds administrative overhead as mass-balance accounting becomes compulsory. Eastern European mills leverage lower energy costs to produce linerboard for Western converters, tightening regional cost spreads.
South America, the Middle East, and Africa collectively represent under 15% of the Secondary packaging market, but post solid mid-single-digit growth. Brazil benefits from agribusiness exports that use ventilated corrugated, returnable plastic bulk bins. Nigeria, Kenya, and South Africa expand cold-chain footprints, catalyzing insulated secondary formats and serialized labels. The United Arab Emirates and Saudi Arabia invest in logistics parks that trans-ship goods to East Africa and South Asia, demanding sturdy packs compatible with multiple handling points. Currency volatility and import tariffs remain structural hurdles, yet foreign direct investment into e-commerce and grocery retail upgrades packaging quality standards.
Mordor Intelligence provides coverage of the secondary packaging market across other key regional markets, including North America, each with their regulatory frameworks and demand patterns.

Competitive Landscape
Industry structure tightened sharply after 2024’s two mega-mergers. Smurfit WestRock formed via an USD 11.2 billion combination, delivering the scale to integrate virgin-fiber mills, recycled-linerboard plants, and more than 350 corrugating facilities. International Paper’s USD 7.2 billion purchase of DS Smith created a comparable force across North America and Europe, adding shelf-ready expertise and recycled containerboard capacity. Graphic Packaging folded in Americraft Carton for USD 130 million, augmenting folding-carton reach in U.S. food-service channels. Amcor’s USD 6.5 billion acquisition of Berry Global broadened its flexible-packaging suite, opening cross-selling between films, rigid containers, and paperboard specialties.
Market leaders now deploy machine vision and predictive-maintenance analytics to extract incremental uptime from legacy assets, a capability smaller independents struggle to match. Integrated giants secure recycled fiber at favorable prices, shielding margins when recovered-paper markets spike. Mid-tier converters respond by specializing in shelf-ready, digitally printed, and quick-turn micro-runs that require agility rather than sheer scale.
White-space opportunities remain attractive in temperature-controlled pharmaceuticals, where reusable crates with data-logging sensors capture only 20% of the addressable lanes. Software-driven on-demand box platforms from Packsize and Ranpak let fulfillment centers cut corrugated waste by 20-30% by producing custom cases at pack-out, challenging integrated producers optimized for batch runs. As robotics diffuses, converters fluent in automation-friendly carton engineering will capture share even in commodity grades, because downtime penalties in 24-7 e-commerce hubs dwarf modest board differentials.
Secondary Packaging Industry Leaders
Smurfit Westrock PLC
Packaging Corporation of America
Stora Enso Oyj
International Paper Company
Graphic Packaging Holding Co.
- *Disclaimer: Major Players sorted in no particular order

Recent Industry Developments
- January 2026: Mondi commissioned the EUR 350 million (USD 374 million) upgrade at its Štětí mill, adding 100 000 tons of recycled containerboard capacity and advanced effluent treatment.
- December 2025: Smurfit Kappa completed a USD 140 million expansion at Zaragoza, Spain, installing a high-speed corrugator and digital print line to serve Southern Europe’s direct-to-consumer brands.
- August 2025: International Paper advanced its USD 200 million Riverdale mill modernization, achieving a 20% reduction in natural-gas consumption and higher recycled-fiber yield on the rebuilt pulping line.
- July 2025: WestRock finished the 200 000-ton kraftliner expansion at Tres Barras, Brazil, aimed at agricultural exporters and growing e-commerce fulfillment.


Global Secondary Packaging Market Report Scope
The Secondary Packaging Market Report is Segmented by Product Type (Folding Cartons, Corrugated Boxes, Plastic Crates and Totes, Wraps Films and Shrink Sleeves, Returnable Transit Packaging), Material (Paper and Paperboard, Plastics, Metals, Glass, Hybrid and Multi-material), Automation Compatibility (Manual Handling, Semi Automated Packaging Lines, Fully Automated Packaging Lines), End-user Industry (Food, Beverage, Healthcare and Pharmaceuticals, Consumer Electronics, Personal and Household Care, Industrial Goods, E-commerce and Logistics), and Geography (North America, South America, Europe, Asia Pacific, Middle East and Africa). The Market Forecasts are Provided in Terms of Value (USD).
| Folding Cartons |
| Corrugated Boxes |
| Plastic Crates and Totes |
| Wraps, Films and Shrink Sleeves |
| Returnable Transit Packaging |
| Paper and Paperboard |
| Plastics |
| Metals |
| Glass |
| Hybrid and Multi material |
| Manual Handling |
| Semi automated Packaging Lines |
| Fully Automated Packaging Lines |
| Food |
| Beverage |
| Healthcare and Pharmaceuticals |
| Consumer Electronics |
| Personal and Household Care |
| Industrial Goods |
| E commerce and Logistics |
| North America | United States | |
| Canada | ||
| Mexico | ||
| South America | Brazil | |
| Argentina | ||
| Rest of South America | ||
| Europe | United Kingdom | |
| Germany | ||
| France | ||
| Italy | ||
| Rest of Europe | ||
| Asia Pacific | China | |
| Japan | ||
| India | ||
| South Korea | ||
| Rest of Asia Pacific | ||
| Middle East and Africa | Middle East | United Arab Emirates |
| Saudi Arabia | ||
| Rest of Middle East | ||
| Africa | South Africa | |
| Egypt | ||
| Rest of Africa | ||
| By Product Type | Folding Cartons | ||
| Corrugated Boxes | |||
| Plastic Crates and Totes | |||
| Wraps, Films and Shrink Sleeves | |||
| Returnable Transit Packaging | |||
| By Material | Paper and Paperboard | ||
| Plastics | |||
| Metals | |||
| Glass | |||
| Hybrid and Multi material | |||
| By Automation Compatibility | Manual Handling | ||
| Semi automated Packaging Lines | |||
| Fully Automated Packaging Lines | |||
| By End user Industry | Food | ||
| Beverage | |||
| Healthcare and Pharmaceuticals | |||
| Consumer Electronics | |||
| Personal and Household Care | |||
| Industrial Goods | |||
| E commerce and Logistics | |||
| By Geography | North America | United States | |
| Canada | |||
| Mexico | |||
| South America | Brazil | ||
| Argentina | |||
| Rest of South America | |||
| Europe | United Kingdom | ||
| Germany | |||
| France | |||
| Italy | |||
| Rest of Europe | |||
| Asia Pacific | China | ||
| Japan | |||
| India | |||
| South Korea | |||
| Rest of Asia Pacific | |||
| Middle East and Africa | Middle East | United Arab Emirates | |
| Saudi Arabia | |||
| Rest of Middle East | |||
| Africa | South Africa | ||
| Egypt | |||
| Rest of Africa | |||


Key Questions Answered in the Report
What is the projected value of the Secondary packaging market in 2031?
It is forecast to reach USD 361.49 billion by 2031, expanding at a 5.08% CAGR over 2026-2031.
Which end-user vertical is growing fastest in secondary packs?
E-commerce and logistics posts the highest 6.44% CAGR as parcel volumes stay elevated post pandemic.
How large is Asia Pacific’s role in global secondary packaging demand?
Asia Pacific held 36.71% of revenue in 2025 and is on track for a 6.09% CAGR through 2031.
What share of product-type revenue did corrugated boxes command in 2025?
Corrugated boxes led with 43.56% of Secondary packaging market share in 2025.
Which packaging material currently dominates the market?
Paper and paperboard captured 54.89% of the Secondary packaging market size in 2025.
What is the main restraint holding back growth in Europe?
Surplus paperboard capacity keeps utilization at 75%, pressuring prices and delaying reinvestment.
Page last updated on:


