Indonesia Industrial Packaging Market Size and Share
Market Overview
| Study Period | 2020 - 2031 |
|---|---|
| Forecast Data Period | 2026 - 2031 |
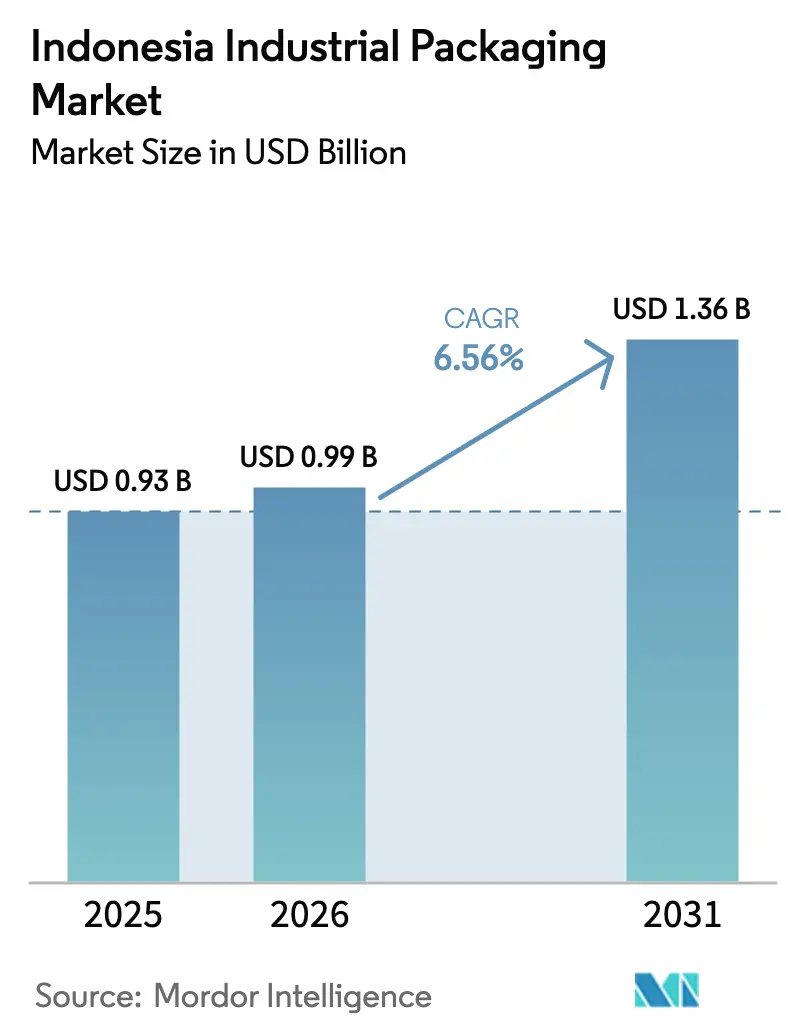
| Base Year Market Size (2025) | USD 0.93 Billion |
| Market Size (2026) | USD 0.99 Billion |
| Market Size (2031) | USD 1.36 Billion |
| Growth Rate (2026 - 2031) | 6.56% CAGR |
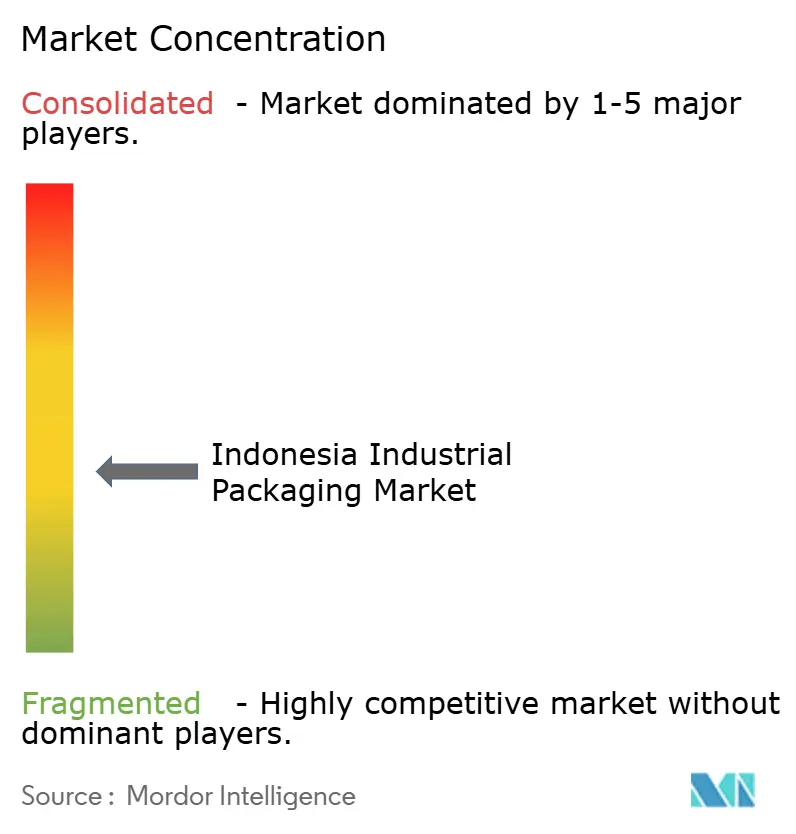
| Market Concentration | Medium |
Major Players *Disclaimer: Major Players sorted in no particular order Image © Mordor Intelligence. Reuse requires attribution under CC BY 4.0. | |
Indonesia Industrial Packaging Market Analysis by Mordor Intelligence
The Indonesia industrial packaging market size is expected to increase from USD 0.93 billion in 2025 to USD 0.99 billion in 2026 and reach USD 1.36 billion by 2031, growing at a CAGR of 6.56% over 2026-2031. Rising petrochemical self-sufficiency, e-commerce parcel growth above 4.2 billion units, and sustained infrastructure spending exceeding IDR 400 trillion a year are widening the customer base for drums, intermediate bulk containers, jerry cans, and flexible formats. Java retains the lion’s share of demand thanks to its dense manufacturing corridors, yet capital inflows tied to the Nusantara Capital project and the Trans-Sumatra toll road are redirecting investment to Kalimantan and Sumatra. Upstream, Lotte Chemical Indonesia’s mixed-feed cracker that started commercial operations in October 2025 is reshaping regional resin pricing, while downstream producers face higher compliance costs as Extended Producer Responsibility targets ratchet up to 30% recycled content by 2029. Competitive pressure is intensifying because global majors are trimming commodity portfolios and local converters are racing to add recycled-content, smart-tracking, and short-run capabilities that appeal to e-commerce and specialty chemical customers.
Key Report Takeaways
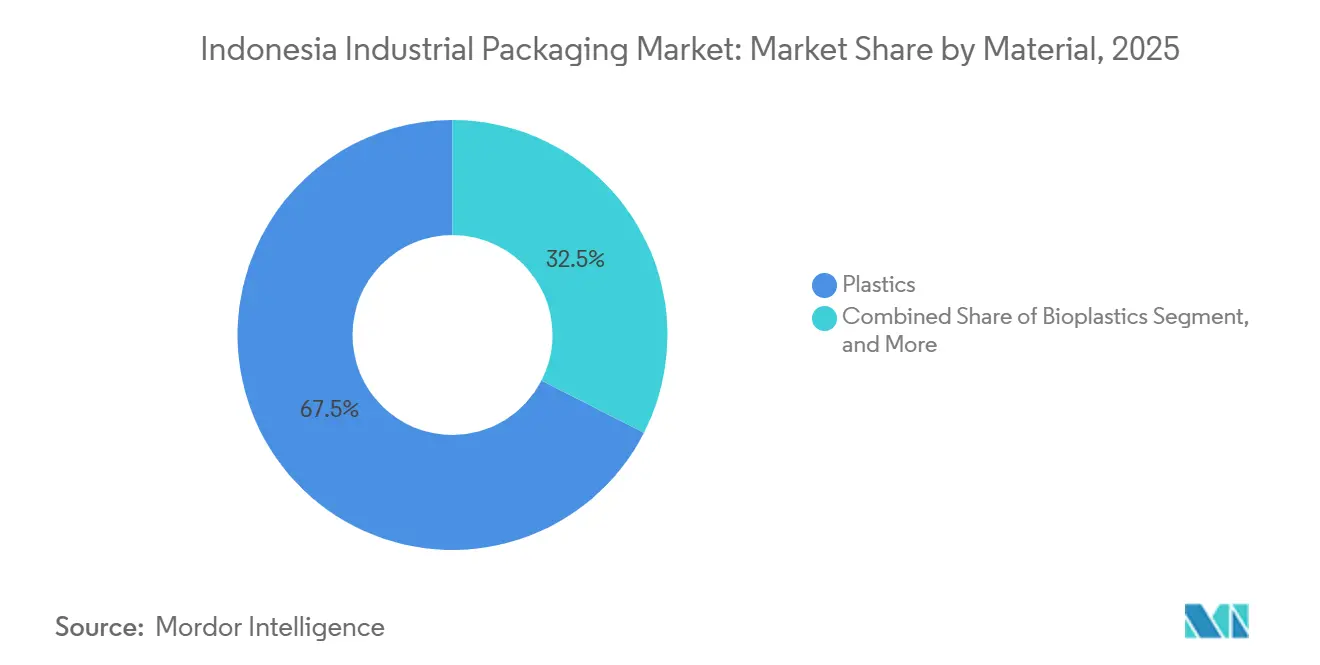
- By material, plastics led with a 67.48% revenue share in 2025, while bioplastics are forecast to expand at a 6.91% CAGR through 2031.
- By product type, drums and barrels accounted for 28.41% of the Indonesia industrial packaging market share in 2025, whereas flexible intermediate bulk containers are projected to grow at a 6.84% CAGR to 2031.
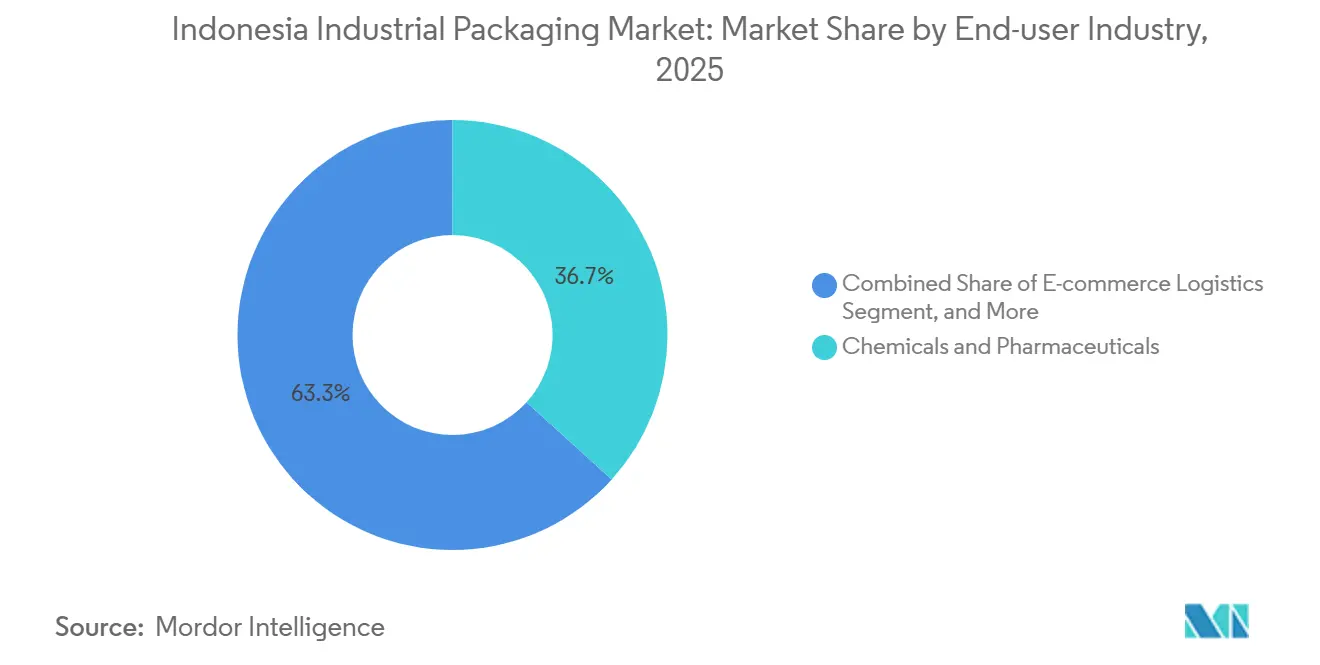
- By end-user industry, chemicals and pharmaceuticals contributed 36.73% of revenue in 2025, yet e-commerce logistics is advancing at a 7.11% CAGR through 2031.
- By packaging capacity, the 51–500-liter band commanded 42.56% of the Indonesia industrial packaging market size in 2025, and containers of ≤ 50 liters are set to rise at a 7.26% CAGR during 2026-2031.
Note: Market size and forecast figures in this report are generated using Mordor Intelligence’s proprietary estimation framework, updated with the latest available data and insights as of 2026.
Worldwide, activity is shaped by contributions from multiple countries and regions, with Indonesia representing one among them. The global report on industrial packaging market by Mordor Intelligence reflects how these countries and regional layers combine into a single system.
Indonesia Industrial Packaging Market Trends and Insights
Drivers Impact Analysis*
| Driver | (~) % Impact on CAGR Forecast | Geographic Relevance | Impact Timeline |
|---|---|---|---|
| Accelerating Food and Beverage Processing Investments | +1.20% | Java (Greater Jakarta, Karawang, Cikarang), Sumatra (North Sumatra, Riau) | Medium term (2-4 years) |
| Expansion of Chemicals and Petrochemicals Output | +1.10% | Java (Cilegon, Merak, Gresik), Sumatra (Riau), Kalimantan (Balikpapan) | Long term (≥ 4 years) |
| E-commerce-fuelled Surge in Logistics Parcel Volumes | +1.00% | National, with concentration in Java (Jakarta, Surabaya, Bandung) | Short term (≤ 2 years) |
| Infrastructure and Construction Boom Increasing Palletised Flows | +0.90% | Kalimantan (IKN Nusantara, East Kalimantan), Sumatra (Trans-Sumatra corridor), Java | Long term (≥ 4 years) |
| Added Domestic Resin Capacity Lowering Input Costs | +0.80% | National, with upstream benefits in Java (Cilegon), downstream in all manufacturing zones | Medium term (2-4 years) |
| AI-enabled Smart-factory Adoption Demanding Sensor-ready Packaging | +0.50% | Java (Batam, Cikarang, Bekasi), select Sumatra industrial parks | Long term (≥ 4 years) |
| Source: Mordor Intelligence | |||
Accelerating Food and Beverage Processing Investments
Food and beverage plants supplied roughly 35% of national manufacturing GDP in 2025. Recent capital injections such as Nestlé’s USD 150 million expansion in Karawang and Danone’s USD 100 million-plus upgrade in Cikarang have lifted demand for food-grade drums, IBCs, and crates. Ingredient suppliers are shifting toward larger bulk formats that cut handling costs, while finished-goods distributors favour smaller, retail-ready packs that improve shelf logistics. Tax incentives for agro-processing and the Ministry of Industry’s local-value mandates reinforce this dual-track growth. As a result, converters with the flexibility to switch between high-volume bulk lines and short-run small packs hold a cost-to-serve advantage.[1]Ministry of Industry, “Statistik Industri 2025,” industri.go.id
Expansion of Chemicals and Petrochemicals Output
Lotte Chemical Indonesia’s USD 3.95 billion steam cracker in Cilegon adds 1 million t of ethylene and 350 000 t of polypropylene annually, boosting domestic ethylene self-sufficiency toward 90% and slashing import dependence. The long-term offtake agreement signed with PT Asahimas Chemical secures feedstock for downstream plastics processing, stabilizing resin supply for rigid containers. Complementary plans such as Chandra Asri’s CAP2 project and Pertamina’s storage terminals signal a multiyear investment wave that favours scale-oriented converters able to capitalize on lower unit input costs. Equipment upgrades in blow-moulding and injection-moulding lines are accelerating as firms race to capture resin cost savings.[2]Lotte Chemical, “Cilegon Complex Starts Commercial Operations,” lottechem.com
E-commerce-fuelled Surge in Logistics Parcel Volumes
Indonesia’s e-commerce gross merchandise value jumped to USD 82 billion in 2025 and is forecast to touch USD 95 billion in 2026. Parcel volumes above 4.2 billion units require small, tamper-evident, stackable packs that move efficiently through automated sortation. Carriers such as J&T Express, JNE, and SiCepat are investing in regional hubs, prompting packaging buyers to demand lighter materials and RFID-ready designs. Converters that can deliver rapid prototypes and short lead times are winning contracts, especially in the ≤ 50-liter range, which shows the strongest growth outlook. Sustainability credentials recycled content, mono-material designs, and lower CO₂ footprints have become decisive tender criteria for platform-integrated sellers.[3]J&T Express, “Annual Parcel Volume Report 2025,” jne.co.id
Infrastructure and Construction Boom Increasing Palletised Flows
Annual public works budgets exceeding IDR 400 trillion underpin megaprojects such as the USD 33 billion Nusantara Capital city and the 2 700-kilometer Trans-Sumatra toll road. Heavy construction materials, cement additives, and specialty chemicals move in palletized drums, crates, and FIBCs, creating recurring demand spikes tied to project milestones. Pallet pooling operators and local crate manufacturers are scaling up capacity in Kalimantan and Sumatra to meet site-based call-offs. The shift of allied manufacturing clusters toward East Kalimantan gradually rebalances geographic demand, trimming Java’s dominance in the long run. Smaller converters with regional depots gain a proximity advantage by responding faster to fluctuating site requirements.
Restraints Impact Analysis*
| Restraint | (~) % Impact on CAGR Forecast | Geographic Relevance | Impact Timeline |
|---|---|---|---|
| Escalating Plastic-waste Regulation and Compliance Costs | -0.70% | National, with stricter enforcement in Java (Jakarta, Surabaya) and Bali | Short term (≤ 2 years) |
| Volatile Polymer and Steel Feed-stock Prices | -0.60% | National, with upstream producers in Java (Cilegon, Gresik) most exposed | Medium term (2-4 years) |
| Under-developed Recycling/Collection Infrastructure | -0.40% | National, with acute gaps in Kalimantan, Sulawesi, Papua and Maluku | Long term (≥ 4 years) |
| Trade-remedy Tariffs on Key Inputs and Finished Packs | -0.30% | National, with import-dependent converters in Java and Sumatra most affected | Short term (≤ 2 years) |
| Source: Mordor Intelligence | |||
Escalating Plastic-waste Regulation and Compliance Costs
Regulation P.75/2019 sets a 30% recycled-content target by 2029 and imposes fines up to IDR 500 million for non-compliance. With only 10-15% of plastic waste recycled, converters must finance collection partnerships, invest in reprocessing lines, or pay EPR levies that erode margins. Presidential Regulation No. 97/2017 intensifies pressure by banning several single-use items from 2030, accelerating R&D in alternative materials. Large multinationals can absorb these costs through scale, while smaller domestic firms risk cash-flow strain, fostering consolidation.
Volatile Polymer and Steel Feed-stock Prices
Regional crackers operated near 50% utilization in late 2024, and several Southeast Asian producers posted consecutive quarterly losses, underscoring a fragile supply-demand equilibrium. The Indonesian Anti-Dumping Committee’s proposed duties of up to 29.01% on imported polypropylene copolymer elevate specialty resin costs. Steel coil pricing has also swung sharply because of global scrap shortages and energy volatility. Converters deploy hedging contracts, diversify supplier portfolios, and substitute recycled material where feasible to contain exposure, yet persistent swings amplify working-capital needs.
*Our forecasts treat driver/restraint impacts as directional, not additive. The impact forecasts reflect baseline growth, mix effects, and variable interactions.
Segment Analysis
By Material: Plastics Retain Scale Advantage While Bioplastics Edge Forward
Plastics delivered 67.48% of the Indonesia industrial packaging market in 2025, supported by steady polyethylene and polypropylene output from Cilegon-based steam crackers. This dominance is entrenched in mature supply chains, standardized drum and jerry-can specifications, and cost efficiency relative to metal or paper alternatives. Domestic producers, including Lotte Chemical Indonesia and Chandra Asri, ensure stable feedstock for converters, narrowing reliance on imports.
Bioplastics, though still niche, are expanding at a 6.91% CAGR as brand owners chase the EPR recycled-content mandate and consumer demand for greener options. Local innovators such as Avani Eco are scaling cassava-based resins, yet premiums of 20-40% over conventional plastics and limited composting infrastructure keep volumes modest. Metal drums serve regulated hazardous-goods niches, while fiber-based formats suit dry commodities but suffer moisture sensitivity in tropical logistics. Overall, plastics will continue to anchor the Indonesia industrial packaging market, with bioplastics carving out high-value adjacencies rather than displacing incumbents in the medium term.


By Product Type: Drums and Barrels Dominate, Flexible IBCs Post Rapid Uptake
Drums and barrels captured 28.41% of the Indonesia industrial packaging market share in 2025, driven by universal acceptance in chemicals, paints, and lubricants. Standard 200-liter and 220-liter designs integrate seamlessly with existing filling and palletizing lines, sustaining predictable reorder cycles.
Flexible intermediate bulk containers are on a 6.84% CAGR trajectory as mining, agriculture, and food ingredients sectors embrace collapsible, lighter-weight sacks that cut freight and reverse-logistics costs. Rigid IBCs maintain a foothold in bulk liquids, aided by PT Novo Complast’s composite offerings. Jerry cans in 5–25-liter sizes support automotive fluids and household chemicals, while crates and pallets rise in tandem with infrastructure projects. Converters that master both rigid and flexible production modalities stand to outpace single-format rivals.
By End-user Industry: Chemicals Lead While E-commerce Logistics Gains Speed
Chemicals and pharmaceuticals accounted for 36.73% of 2025 revenue, leveraging domestic resin capacity additions and consistently high container-quality requirements. Pharmaceutical majors such as Kalbe Farma prioritize UN-certified packs that safeguard sterility and traceability.
E-commerce logistics, expanding at 7.11% CAGR, is reshaping demand toward tamper-evident, lightweight formats that survive multiple handling cycles. Food and beverage processors, fuelled by expansions at Nestlé and Danone, remain an anchor client base, while automotive, construction, and paints round out a diversified end-user mix. Suppliers that tailor packaging to precise sectoral needs chemical-resistant liners, food-grade resins, RFID tags can secure long-term contracts and mitigate cyclicality.
By Packaging Capacity: Mid-range Still Commands Volume, Sub-50 Liter Packs Surge
The 51–500-liter band comprised 42.56% of the Indonesia industrial packaging market size in 2025, dominated by 200-liter drums and 1 000-liter composite IBCs. These formats strike an optimal balance between handling efficiency and unit cost for bulk liquids and powders.
Containers of ≤ 50 liters are on track for a 7.26% CAGR, propelled by courier networks that favour lighter parcels to tame last-mile costs. Smart-label integration and rapid customization further push growth as sellers demand unique branding and tracking features. At the high-capacity end, > 1 000-liter totes remain niche, tied to petrochemical and mining flows that justify specialized handling rigs. The contrasting trajectories highlight the need for converters to maintain a versatile equipment mix that can switch from mass-production drum runs to agile, short-cycle small-pack orders.
Geography Analysis
Java accounted for roughly 60-65% of spending in the Indonesia industrial packaging market during 2025. Greater Jakarta, Bekasi, Karawang, and Cikarang host dense chemical, food, and consumer-goods clusters that rely on short-haul container deliveries. The co-location of upstream resin plants, including Lotte Chemical Indonesia and Chandra Asri, tightens supply loops, curbing inbound freight costs and enabling rapid order fulfilment. Retail-oriented e-commerce fulfilment centers further magnify demand for small, durable packs.
Sumatra contributed an estimated 15-20% share, anchored by palm-oil processing, petrochemical hubs in Riau, and rubber production in North Sumatra. The phased rollout of the Trans-Sumatra toll road slashes overland transit times, allowing converters to supply heavier drums and FIBCs from satellite plants instead of shipping from Java. Coastal ports at Belawan and Dumai facilitate export-oriented bulk chemical and edible-oil trade, reinforcing the pull for industrial containers that meet international standards.
Kalimantan’s 8-10% share is set to rise as the USD 33 billion Nusantara Capital development attracts ancillary industries. Construction chemicals, cement additives, and aggregates flow into the site in rigid and flexible pallets, boosting regional packaging demand. Sulawesi remains a modest 3-5% player, tied to nickel mining and agribusiness, while Bali-Nusa Tenggara and Papua-Maluku together account for under 4% because of limited industrialization. Variations in waste-management readiness mean Java and Bali face stricter EPR enforcement, nudging converters there to adopt recycled-content sooner than peers in outlying islands.
Competitive Landscape
The Indonesia industrial packaging market is moderately fragmented. Global suppliers such as Greif, Mauser Packaging Solutions, and SCHÜTZ coexist with regional names like Time Technoplast and PTT Global Chemical and a long tail of domestic converters. Greif’s August 2025 divestiture of its containerboard unit freed USD 1.8 billion to refocus on specialty formats, but volume declines across core segments hint at share turnover opportunities for local players.
Time Technoplast’s TECHPACK range leverages recognized quality credentials, yet the absence of fresh capacity announcements through 2026 opens white space for agile Indonesian firms to secure chemicals contracts. PT Novo Complast’s composite IBC facility in Tangerang enjoys proximity to the Cilegon petrochemical belt, supporting just-in-time deliveries. Meanwhile, smaller operators in East Java and Sumatra capture cost-sensitive business with reconditioned drums that appeal to agricultural and construction buyers.
Innovation differentiators now cluster around recycled-content integration, IoT-enabled tracking features, and rapid prototyping services geared to e-commerce clients. Telkomsel’s 5G private-network deployment at Pegatron’s Batam factory illustrates how smart-factory ecosystems can lift quality standards and traceability expectations across the supply chain. Producer Responsibility Organization initiatives, including the Indonesia Packaging Recovery Organization, are beginning to formalize collection networks, although participation remains voluntary and uneven.
Indonesia Industrial Packaging Industry Leaders
Greif Inc.
Mauser Packaging Solutions Holding Company
SCHÜTZ GmbH & Co. KGaA
Time Technoplast Ltd.
PTT Global Chemical Public Company Limited
- *Disclaimer: Major Players sorted in no particular order

Recent Industry Developments
- July 2025: Greif completed the sale of its containerboard business for USD 1.8 billion, freeing resources for expansion in Indonesia industrial packaging operations.
- March 2025: PepsiCo confirmed a USD 200 million Cikarang plant expansion equipped with advanced packaging lines for snacks and beverages.
- January 2025: Mauser Packaging expanded its Haiyan facility to boost IBC output aimed at Asian chemical producers.
- January 2025: Indonesia launched a carbon-trading platform with plastic-credit mechanisms, incentivizing circular packaging initiatives nationwide.


Indonesia Industrial Packaging Market Report Scope
The Indonesia Industrial Packaging Market Report is Segmented by Material (Plastics, Metal, Paper and Fiber-based, Other Materials), Product Type (Jerry Cans, Intermediate Bulk Containers, Drums and Barrels, Crates and Pallets, Insulated Shipping Containers, Flexible Intermediate Bulk Containers, Other Packaging Types), End-user Industry (Chemicals and Pharmaceuticals, Food and Beverage, Automotive, Oil Gas and Petrochemicals, Building and Construction, Paints and Coatings, Other End-user Industries), Packaging Capacity (≤ 50 L, 51-500 L, 501-1000 L, 1001-2000 L, > 2000 L), and Geography (Java, Sumatra, Kalimantan, Sulawesi, Bali and Nusa Tenggara, Papua and Maluku). The Market Forecasts are Provided in Terms of Value (USD).
| Plastics |
| Metal |
| Paper and Fiber-based |
| Other Materials |
| Jerry Cans |
| Intermediate Bulk Containers (IBCs) |
| Drums and Barrels |
| Crates and Pallets |
| Insulated Shipping Containers |
| Flexible Intermediate Bulk Containers (FIBCs) |
| Other Packaging Types |
| Chemicals and Pharmaceuticals |
| Food and Beverage |
| Automotive |
| Oil, Gas and Petrochemicals |
| Building and Construction |
| Paints and Coatings |
| Other End-user Industries |
| Less Than Equal to 50 L |
| 51 - 500 L |
| 501 - 1,000 L |
| 1,001 - 2,000 L |
| More than 2,000 L |
| Java |
| Sumatra |
| Kalimantan |
| Sulawesi |
| Bali & Nusa Tenggara |
| Papua & Maluku |
| By Material | Plastics |
| Metal | |
| Paper and Fiber-based | |
| Other Materials | |
| By Product Type | Jerry Cans |
| Intermediate Bulk Containers (IBCs) | |
| Drums and Barrels | |
| Crates and Pallets | |
| Insulated Shipping Containers | |
| Flexible Intermediate Bulk Containers (FIBCs) | |
| Other Packaging Types | |
| By End-user Industry | Chemicals and Pharmaceuticals |
| Food and Beverage | |
| Automotive | |
| Oil, Gas and Petrochemicals | |
| Building and Construction | |
| Paints and Coatings | |
| Other End-user Industries | |
| By Packaging Capacity | Less Than Equal to 50 L |
| 51 - 500 L | |
| 501 - 1,000 L | |
| 1,001 - 2,000 L | |
| More than 2,000 L | |
| By Region | Java |
| Sumatra | |
| Kalimantan | |
| Sulawesi | |
| Bali & Nusa Tenggara | |
| Papua & Maluku |


Key Questions Answered in the Report
What is the current value of the Indonesia industrial packaging market?
The Indonesian industrial packaging market is valued at USD 0.99 billion in 2026.
How fast is demand expected to grow?
The market is projected to expand at a 6.56% CAGR between 2026 and 2031.
Which segment holds the largest Indonesia industrial packaging market share?
Plastics commanded 67.48% of revenue in 2025.
Why are flexible IBCs gaining popularity?
They lower freight costs, collapse for return trips, and suit bulk powders and grains, driving a 6.84% CAGR to 2031.
How do EPR rules affect packaging producers?
Firms must reach 30% recycled content by 2029 or face fines up to IDR 500 million, spurring investment in recycling partnerships.
Which island outside Java shows the fastest future growth?
Kalimantan is poised to gain share thanks to the Nusantara Capital construction program.
Page last updated on:


