Terahertz Technologies Market Size and Share
Market Overview
| Study Period | 2020 - 2031 |
|---|---|
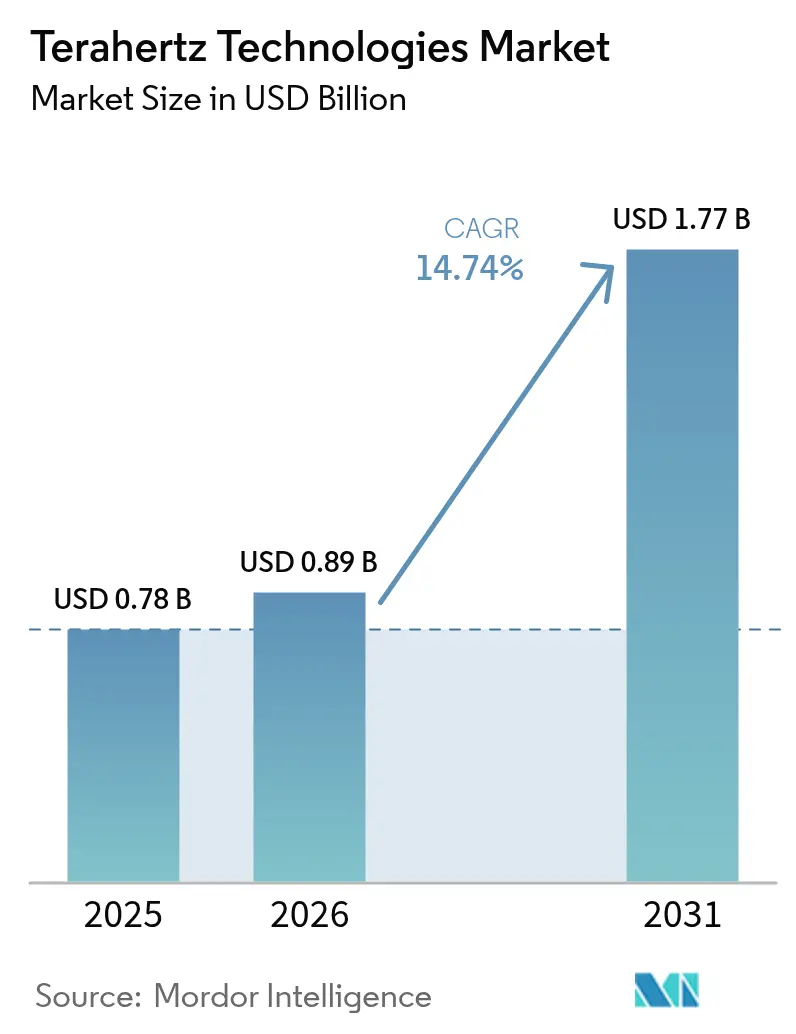
| Market Size (2026) | USD 0.89 Billion |
| Market Size (2031) | USD 1.77 Billion |
| Growth Rate (2026 - 2031) | 14.74% CAGR |
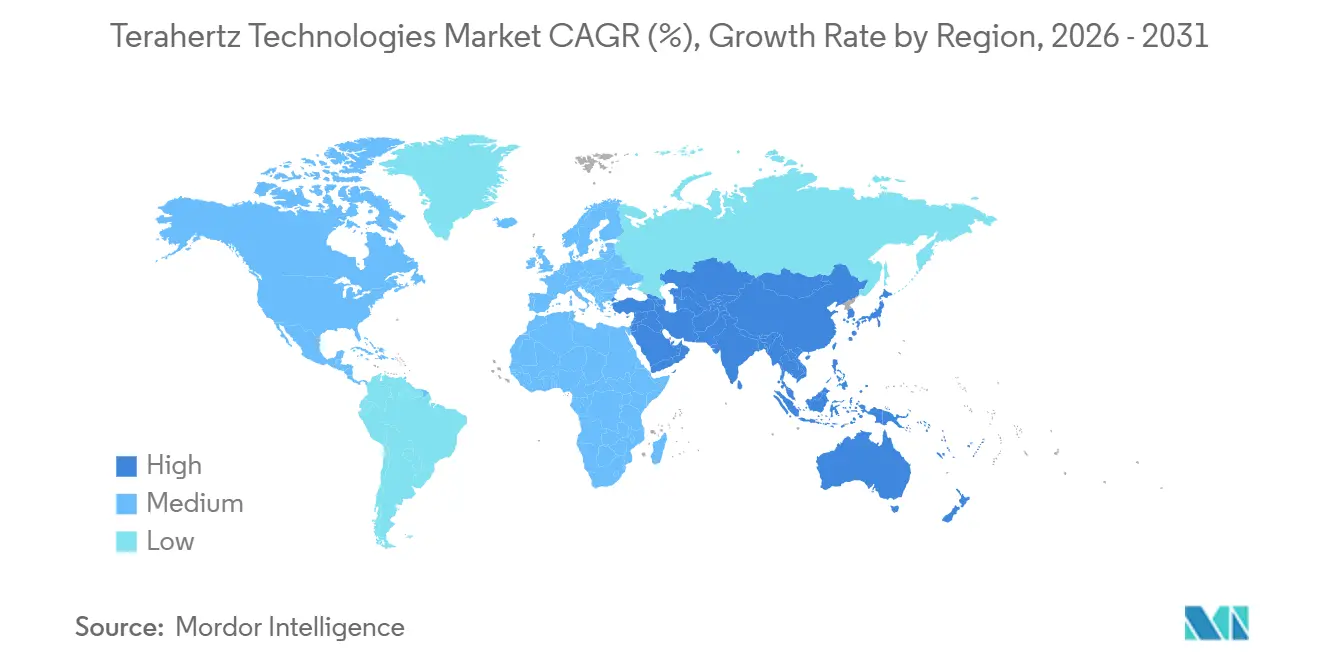
| Fastest Growing Market | Asia Pacific |
| Largest Market | Asia Pacific |
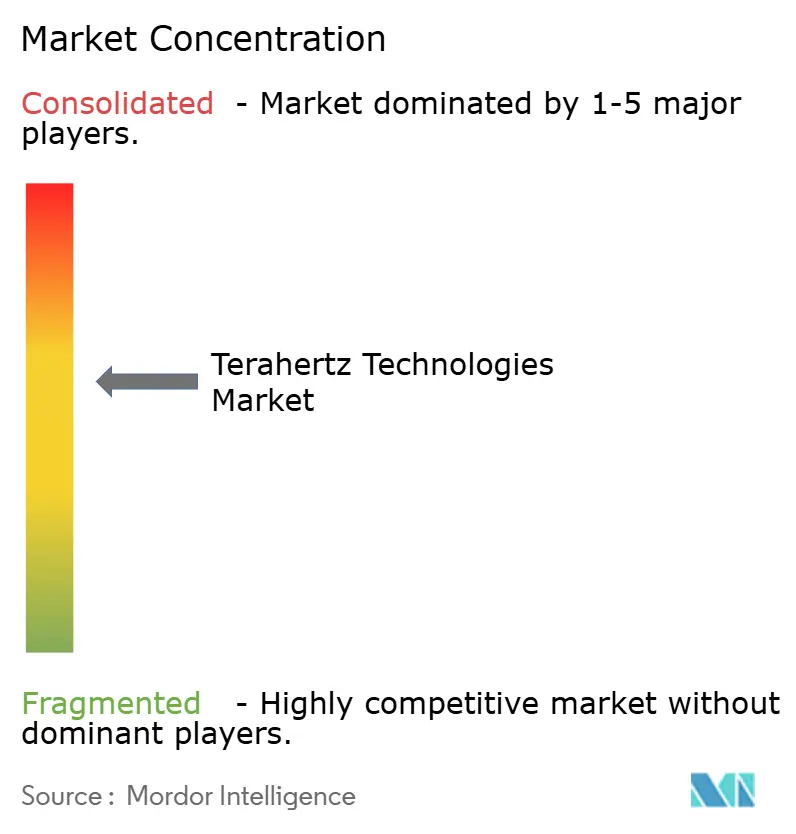
| Market Concentration | Medium |
Major Players *Disclaimer: Major Players sorted in no particular order Image © Mordor Intelligence. Reuse requires attribution under CC BY 4.0. | |
Terahertz Technologies Market Analysis by Mordor Intelligence
The terahertz technologies market size was valued at USD 0.78 billion in 2025 and estimated to grow from USD 0.89 billion in 2026 to reach USD 1.77 billion by 2031, at a CAGR of 14.74% during the forecast period (2026-2031). Strong momentum behind photonic-integrated sources, expanding 6G proof-of-concept backhaul links, and rising healthcare adoption are moving the terahertz technologies market from research labs into high-volume production lines. Component manufacturers have shifted investment toward chip-level assemblies that lower system cost and simplify field deployment, while end users prioritize turnkey platforms that bundle machine-learning analytics with quantum-cascade lasers or photomixing modules. Regulatory support for process analytical technology in pharmaceuticals and aggressive public funding for 6G research consortia further reinforce demand. Competition now centers on reducing cryogenic-cooling overhead, securing design slots in inline quality-control installations, and achieving long-term reliability targets that match those of incumbent optical and microwave solutions.
Key Report Takeaways
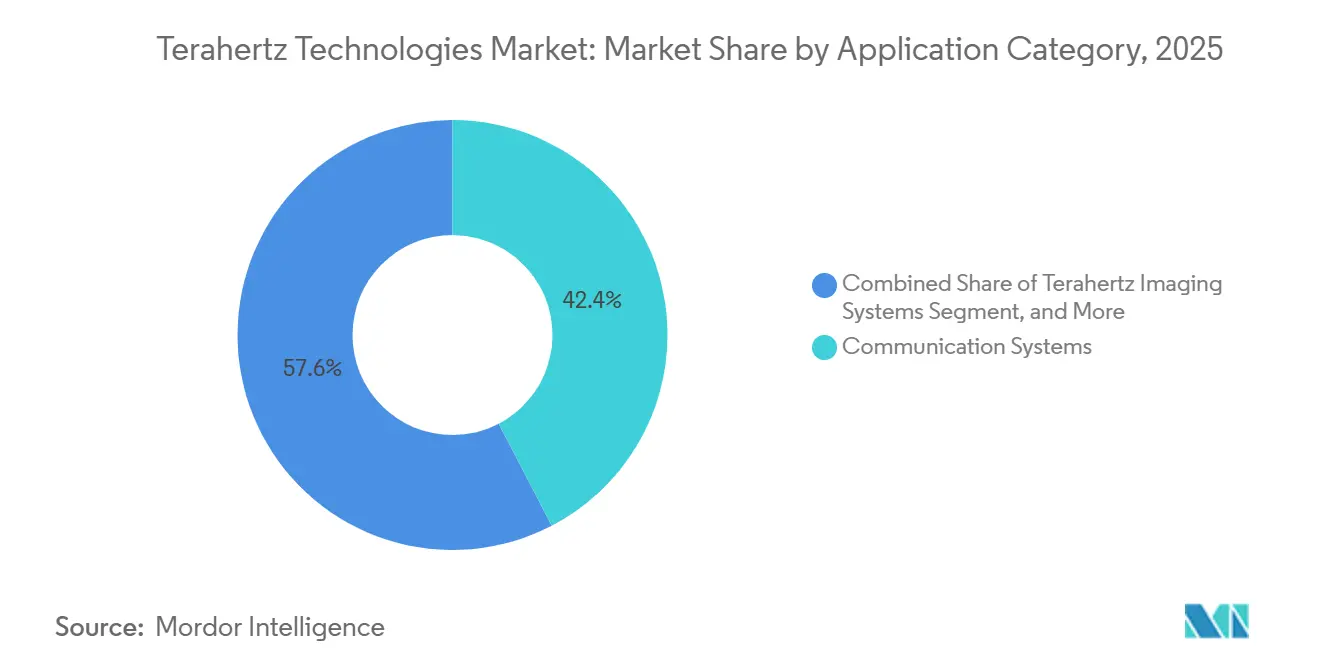
- By application category, communication systems led with 42.36% of the terahertz technologies market share in 2025, whereas terahertz imaging systems are forecast to advance at a 15.32% CAGR through 2031.
- By frequency range, mid-frequency platforms held 47.93% terahertz technologies market share in 2025 and are projected to grow at a 15.37% CAGR between 2026-2031.
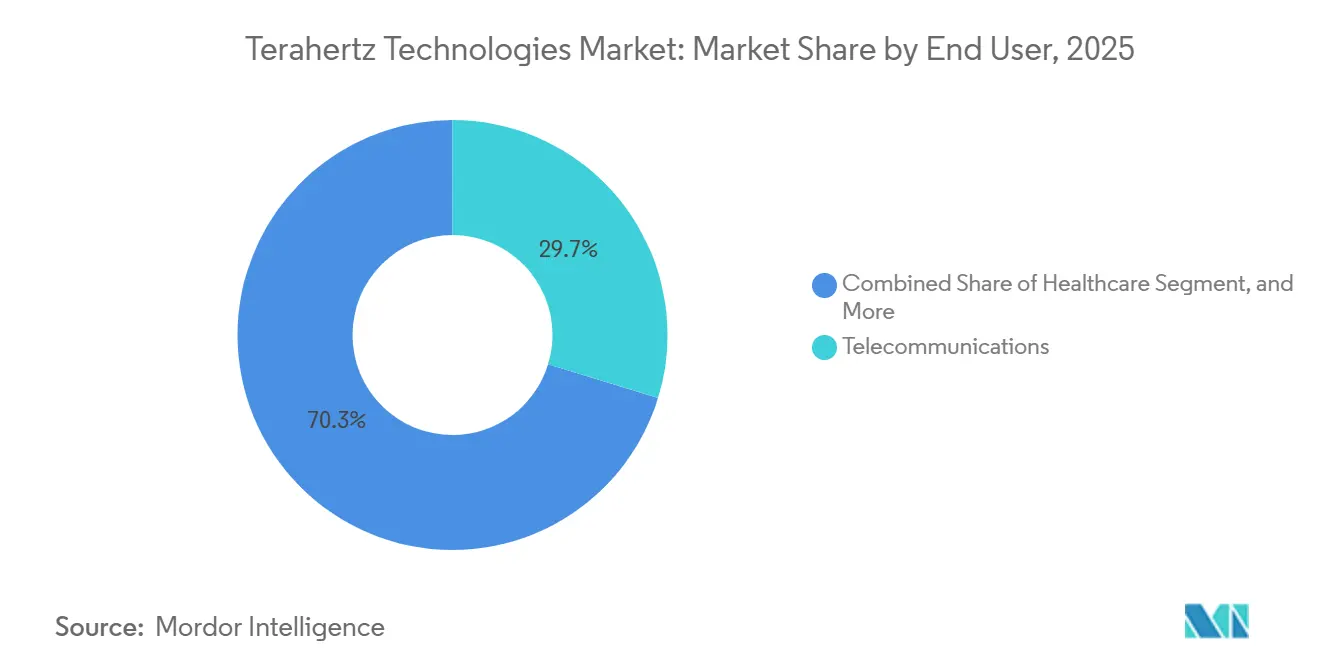
- By end user, telecommunications accounted for 29.74% of 2025 revenue, while healthcare applications are poised to expand at a 16.11% CAGR through 2031.
- By component type, terahertz sources accounted for 34.59% of spending in 2025; systems and software are expected to post a 15.56% CAGR during 2026-2031.
- By geography, Asia-Pacific accounted for 38.23% of 2025 revenue and is set to grow at a 15.79% CAGR, outpacing all other regions.
Note: Market size and forecast figures in this report are generated using Mordor Intelligence’s proprietary estimation framework, updated with the latest available data and insights as of 2026.
Global Terahertz Technologies Market Trends and Insights
Drivers Impact Analysis*
| Driver | (~) % Impact on CAGR Forecast | Geographic Relevance | Impact Timeline |
|---|---|---|---|
| Advances in Compact Photonic-Integrated THz Sources | +3.2% | Global, with early commercialization in North America and Asia-Pacific | Medium term (2-4 years) |
| Surge in 6G-Backhaul Proof-of-Concept Installations | +2.9% | Asia-Pacific core, spill-over to North America and Europe | Short term (≤ 2 years) |
| Rising Adoption in Inline Pharmaceutical QA/QC | +2.4% | North America and Europe, expanding to Asia-Pacific | Medium term (2-4 years) |
| Defense Demand for mm-Resolution Passive Standoff Scanners | +1.8% | North America and Middle East, selective adoption in Europe | Long term (≥ 4 years) |
| Standardization of THz EUV Lithography Mask Metrology | +1.3% | Asia-Pacific (Taiwan, South Korea), North America (United States) | Long term (≥ 4 years) |
| Funding for THz Cultural Heritage Preservation Analysis | +0.6% | Europe, selective projects in North America and Asia-Pacific | Long term (≥ 4 years) |
| Source: Mordor Intelligence | |||
Advances in Compact Photonic-Integrated THz Sources
Photonic integration is shrinking terahertz emitters from bench-top optical assemblies to millimeter-scale chips that drop directly into handheld instruments. Thin-film lithium niobate modulators now achieve difference-frequency mixing efficiencies approaching 1%, providing continuous-wave output above 1 THz without cryogenic mirrors or bulky alignment hardware.[1]Alan Wong, “Lithium-Niobate Photonic THz Generation,” Optica Publishing Group, opg.optica.org Commercial foundries have licensed more than 40 university patents since 2024, bringing the technology to 200 mm silicon photonics lines that cut part counts and lead times by more than half. Unit cost is falling below USD 10,000 for mid-power sources, opening up price-sensitive segments such as food inspection and cultural heritage conservation. The combination of a lower price and a field-ready form factor underpins the projected 15.32% growth in imaging systems through 2031.
Surge in 6G-Backhaul Proof-of-Concept Installations
Telecom operators completed over 25 terahertz backhaul pilots in dense urban corridors during 2025, targeting multi-gigabit links where trenching fiber exceeds USD 1 million per kilometer. Japan’s NICT validated a 100 Gbps, 300 GHz connection over 500 m in downtown Tokyo, meeting 6G latency and packet-error requirements under real traffic conditions.[2]Kenji Yamamoto, “100 Gbps 300 GHz Field Trial in Tokyo,” National Institute of Information and Communications Technology, nict.go.jp South Korea’s ETRI achieved 50 Gbps at 220 GHz with adaptive beam steering that compensated for building sway and pedestrian blockage, demonstrating robustness for small-cell aggregation. Capital budgets for 2026 now include terahertz radios alongside microwave and optical backhaul gear, confirming the segment’s transition from research to deployment. These pilots explain why communication systems retained 42.36% market share in 2025.
Rising Adoption in Inline Pharmaceutical QA/QC
Continuous-manufacturing tablet lines in North America and Europe embedded terahertz time-domain spectroscopy to monitor coating thickness and polymorphic form in real time, replacing destructive offline sampling.[3]United States Food and Drug Administration, “PAT Guidance for Industry,” fda.gov Each inline sensor inspects up to 200,000 tablets per hour and flags deviations that correlate with dissolution-rate failures, a capability near-infrared tools lack due to limited penetration depth. The technology aligns with regulatory initiatives to enable real-time release testing, reducing batch-hold inventory and shortening production cycles. Falling hardware prices driven by photonic integration allow plants to equip multiple lines rather than a single pilot system. These factors support the forecast 16.11% CAGR for healthcare applications through 2031.
Defense Demand for mm-Resolution Passive Standoff Scanners
Defense and security agencies are procuring passive terahertz imagers that capture millimeter-scale detail at standoff ranges of 10 m or more, enabling non-invasive detection of concealed threats. The United States TSA evaluated next-generation portals that improve spatial resolution and reduce false-alarm rates compared with legacy millimeter-wave units. Middle Eastern ministries signed contracts totaling more than USD 50 million in 2025 for vehicle-mounted passive scanners for high-risk checkpoints where proximity screening is unsafe. Passive architectures avoid export-control restrictions tied to high-power active transmitters, streamlining cross-border sales. Although defense spending grows more slowly than healthcare or telecom, these high-value systems anchor a stable revenue base for suppliers.
Restraints Impact Analysis*
| Restraint | (~) % Impact on CAGR Forecast | Geographic Relevance | Impact Timeline |
|---|---|---|---|
| Limited Atmospheric Transmission Windows for Outdoor Links | -1.4% | Global, acute in humid tropical and subtropical regions | Short term (≤ 2 years) |
| Cryogenic Cooling Cost for High-Power QCL Sources | -1.1% | Global, particularly North America and Europe where labor and energy costs are elevated | Medium term (2-4 years) |
| Scarcity of Volume-Manufacturable Low-Loss THz Packaging | -0.8% | Global, with acute supply constraints in Asia-Pacific and North America | Medium term (2-4 years) |
| Absence of Harmonised Global EMC and Health Exposure Limits Above 275 GHz | -0.6% | Global, fragmented regulatory landscape across North America, Europe, and Asia-Pacific | Long term (≥ 4 years) |
| Source: Mordor Intelligence | |||
Limited Atmospheric Transmission Windows for Outdoor Links
Water vapor creates attenuation peaks above 100 dB km⁻¹ at many terahertz frequencies, restricting reliable outdoor service to narrow windows near 300 GHz and 350 GHz. Humid tropical climates experience two-to-three times higher losses, forcing operators to oversize link budgets or confine deployments to dry seasons. Rainfall above 10 mm h⁻¹ can drop link availability below carrier standards, pushing networks to retain microwave or fiber overlays for resiliency. These environmental limits cap the long-term share of terahertz in backhaul architectures despite technical successes in pilot trials. Investment, therefore, shifts toward indoor, short-range, or point-to-point campus links where atmospheric effects are minimal.
Cryogenic Cooling Cost for High-Power QCL Sources
Quantum-cascade lasers that deliver multi-milliwatt terahertz output require cooling below 200 K, adding USD 15,000–50,000 in cryocooler hardware plus 200–500 W continuous power draw. Five-year ownership can exceed USD 100,000 once maintenance and energy are included, a barrier for cost-sensitive industries such as food processing. Labor rates above USD 100 h⁻¹ in North America and Europe further inflate service costs, creating regional adoption gaps. Vendors are racing to commercialize room-temperature photomixing sources that trade output power for lower complexity. Until those alternatives mature, cryogenic overhead will limit terahertz penetration in mass-market inspection lines.
*Our forecasts treat driver/restraint impacts as directional, not additive. The impact forecasts reflect baseline growth, mix effects, and variable interactions.
Segment Analysis
By Application Category: Imaging Systems Gain Momentum
Terahertz imaging systems are projected to grow at a 15.32% CAGR between 2026-2031, closing in on communication platforms that commanded 42.36% of the terahertz technologies market share in 2025. The terahertz technologies market for imaging will benefit from falling hardware prices as photonic-integrated sources reach sub-USD 10,000 unit costs and enable routine non-destructive testing on pharmaceutical lines and composite-material parts. Active imagers that couple quantum-cascade lasers with fast detectors dominate tablet-coating inspection and aerospace defect mapping, while passive arrays lead airport screening by avoiding export-control limits on high-power emitters.
The expanding use cases in dermatology clinics, dental practices, and cultural-heritage conservation are driving demand beyond research labs. Hybrid instruments that overlay spectral fingerprints on high-contrast images allow a single platform to shift between quality control, security, and medical diagnostics through software updates rather than hardware swaps. As these multipurpose systems mature, integrators bundle AI analytics that reduce operator training time and standardize results across sites. Together, these factors underpin sustained double-digit growth for imaging despite communication remaining the largest revenue generator through mid-decade.


By Frequency Range: Mid-Band Platforms Dominate
Mid-frequency solutions spanning roughly 0.5-1.5 THz held 47.93% of 2025 revenue, the largest slice of the terahertz technologies market share, and are expected to expand at a 15.37% CAGR to 2031. In this band of the terahertz technologies market, 1 THz spectroscopy can effectively resolve 5 µm coating layers, providing high precision in material analysis. At the same time, atmospheric attenuation and component costs remain manageable for field systems, making it an optimal range for practical applications in various industries, including healthcare, security, and telecommunications.
Low-frequency gear below 0.5 THz propagates farther and operates at room temperature, making it well-suited for point-to-point links and through-wall sensing, but millimeter-scale resolution limits its appeal for precision QA. Above 1.5 THz, sub-millimeter imaging is used for EUV mask metrology, although stronger water-vapor absorption and higher detector noise keep such units largely laboratory-bound. Mid-band designs, therefore, remain the default for pharmaceutical, telecom, and security users that need balanced performance without cryogenic overhead or severe weather constraints.
By End User: Healthcare Surges Ahead
Telecommunications accounted for 29.74% of terahertz revenue in 2025, yet healthcare applications are forecast to grow at a 16.11% CAGR through 2031, the fastest among end users. Dermatology practices adopted handheld scanners that delineate carcinoma margins in real time, reducing re-excision rates and justifying capital costs near USD 200,000 per unit. Pharmaceutical manufacturers, encouraged by real-time release regulations, embedded inline spectroscopy across multiple coating lines, each screening up to 200,000 tablets per hour.
Dental, ophthalmic, and point-of-care settings follow, drawn using radiation-free imaging that aligns with pediatric and outpatient workflows. Defense and security procure passive standoff arrays for concealed-weapon detection, though lengthy procurement cycles temper growth. The industrial and food sectors are exploring moisture sensing and composite inspection, but remain sensitive to system prices above USD 50,000. As vendors roll out photonic-integrated sources and AI analytics that shrink the total cost of ownership, healthcare’s share is set to narrow the gap with telecom by the end of the forecast window.
By Component Type: Systems and Software Capture Value
Terahertz sources represented 34.59% of 2025 spending, led by high-price quantum-cascade lasers, yet systems and software are on track for a 15.56% CAGR, the fastest within the stack. As emitter costs decline and detectors become commoditized, the focus of value creation is shifting towards comprehensive turnkey platforms. These platforms seamlessly integrate hardware, analytics, and data management that is ready for regulatory compliance.
Integrators now embed convolutional neural networks trained on thousands of spectra or images, automating pass-fail calls and trimming operator training from weeks to hours. Compliance features such as 21 CFR Part 11 electronic records support pharmaceutical buyers, while SNMP interfaces let telecom operators integrate terahertz radios into existing network management suites. Passive optics remain a stable but slower-growing slice, with innovation centering on 3D-printed lenses and metamaterial flats that ease handheld design. As a result, the terahertz technologies market size tied to software subscriptions and algorithm updates will climb steadily, even as component ASPs decline.
Geography Analysis
Asia-Pacific captured 38.23% of global revenue in 2025, the highest regional share, and is projected to expand at a 15.79% CAGR through 2031. China’s Ministry of Science and Technology allocated CNY 2.1 billion (USD 290 million) in 2025 to 6G terahertz consortia that develop indigenous sources and detectors. Japan’s National Institute of Information and Communications Technology demonstrated a 100 Gbps, 300 GHz link across 500 m of central Tokyo in late 2025, validating sub-terahertz reliability under dense urban conditions. South Korea’s ETRI field-tested a portable 220 GHz transceiver that delivered 50 Gbps on Seoul streets in mid-2025, further cementing regional leadership in pilot deployments. Together, these initiatives position the region to dictate future component cost curves and performance benchmarks.
North America ranked second in revenue, buoyed by DARPA grants for passive standoff scanners and widespread pharmaceutical rollout of inline spectroscopy. The terahertz technologies market in North America is forecast to grow steadily, though the region’s CAGR trails Asia-Pacific as telecom operators pursue measured 6G backhaul expansion. Europe’s contribution remains significant thanks to research hubs such as Fraunhofer IAF, which advanced thin-film lithium-niobate photomixers that enable room-temperature sources. Fragmented spectrum policy and more conservative capital expenditure, however, slow cross-border deployments. As a result, Europe is expected to yield incremental share to faster-moving Asian markets through the forecast window.
South America stands at an evaluation stage, with Brazil’s agricultural agencies testing terahertz moisture sensors for coffee and soybean quality control. Mexico’s automotive sector pilots non-destructive testing of composite panels, yet import duties and limited local manufacturing constrain volume adoption. In the Middle East and Africa, airport security screening and border-control orders generate periodic but high-value sales, while the absence of an indigenous component supply curbs scale. Collectively, these emerging regions hold less than 10% of the terahertz technologies market share today and are expected to remain single-digit contributors until falling Asia-Pacific price points broaden accessibility.

Competitive Landscape
The terahertz technologies market is moderately fragmented, with the five largest suppliers controlling roughly 60% of worldwide revenue. Established spectroscopy leaders such as Bruker Corporation and Menlo Systems rely on decades of materials analysis expertise to maintain premium positioning. Photonics startups licensing university patents introduce thin-film lithium-niobate emitters that operate without cryogenic cooling, targeting cost-sensitive industrial buyers. Defense integrators, including Northrop Grumman and Lockheed Martin, repurpose millimeter-wave radar experience to develop passive scanners for threat detection. Competition, therefore, spans optical, radiofrequency, and security domains rather than a single technology silo.
Mergers, acquisitions, and partnerships accelerated in 2025 as firms sought vertical integration. Bruker purchased a German Schottky-diode foundry, cutting detector lead times by 30% and safeguarding margins in high-volume pharmaceutical deals. Menlo Systems signed a joint development pact with a major telecom OEM to embed 300 GHz radios into weather-sealed base-station enclosures. TOPTICA Photonics launched a photonic-integrated source module priced below USD 10,000, pressuring rivals dependent on more expensive quantum-cascade lasers. Virginia Diodes secured a USD 18 million DARPA contract to advance passive scanners, leveraging non-dilutive funding to move prototypes toward production.
Patent filings for photonic-integrated emitters climbed more than 30% during 2024-2025, shortening innovation cycles and eroding proprietary advantage. Software is emerging as the key differentiator, with suppliers bundling machine-learning classifiers that reduce false positives and trim operator training from weeks to hours. As detector and source prices fall, recurring revenue shifts toward firmware updates and cloud analytics tied to multi-year service contracts. Vendors capable of delivering turnkey, compliance-ready solutions are positioned to capture greater wallet share as buyers consolidate around fewer full-stack partners.
Terahertz Technologies Industry Leaders
ADVANTEST Corporation
Luna Innovations Incorporated
TeraView Limited
TOPTICA Photonics AG
HÜBNER GmbH and Co. KG
- *Disclaimer: Major Players sorted in no particular order

Recent Industry Developments
- January 2026: TOPTICA Photonics rolled out a thin-film lithium-niobate photomixing module delivering >1 THz continuous-wave output without cryogenic cooling, targeting inline spectroscopy and food inspection.
- December 2025: Japan’s NICT achieved a 100 Gbps 300 GHz link over 500 m in Tokyo, validating sub-terahertz performance for urban backhaul.
- November 2025: Bruker launched a handheld terahertz imaging unit for real-time dermatological margin assessment, cutting re-excision rates in Mohs surgery.
- October 2025: China’s Ministry of Science and Technology committed CNY 2.1 billion (USD 290 million) to 6G terahertz research consortia focused on photonic-integrated sources and detector fabrication.


Global Terahertz Technologies Market Report Scope
The Terahertz Technologies Market Report is Segmented by Application Category (Terahertz Imaging Systems, Terahertz Spectroscopy Systems, Communication Systems), Frequency Range (Low-Frequency Terahertz, Mid-Frequency Terahertz, High-Frequency Terahertz), End User (Healthcare, Defense and Security, Telecommunications, Industrial, Food and Agriculture, Laboratories, Other End Users), Component Type (Terahertz Sources, Terahertz Detectors, Optics and Passive Components, Systems and Softwares), and Geography (North America, South America, Europe, Asia-Pacific, Middle East and Africa). The Market Forecasts are Provided in Terms of Value (USD).
| Terahertz Imaging Systems | Active Systems |
| Passive Systems | |
| Terahertz Spectroscopy Systems | Time-Domain |
| Frequency-Domain | |
| Communication Systems |
| Low-Frequency Terahertz |
| Mid-Frequency Terahertz |
| High-Frequency Terahertz |
| Healthcare |
| Defense and Security |
| Telecommunications |
| Industrial |
| Food and Agriculture |
| Laboratories |
| Other End Users |
| Terahertz Sources |
| Terahertz Detectors |
| Optics and Passive Components |
| Systems and Softwares |
| North America | United States | |
| Canada | ||
| Mexico | ||
| South America | Brazil | |
| Argentina | ||
| Rest of South America | ||
| Europe | United Kingdom | |
| Germany | ||
| France | ||
| Italy | ||
| Rest of Europe | ||
| Asia Pacific | China | |
| Japan | ||
| India | ||
| South Korea | ||
| Rest of Asia Pacific | ||
| Middle East and Africa | Middle East | United Arab Emirates |
| Saudi Arabia | ||
| Rest of Middle East | ||
| Africa | South Africa | |
| Egypt | ||
| Rest of Africa | ||
| By Application Category | Terahertz Imaging Systems | Active Systems | |
| Passive Systems | |||
| Terahertz Spectroscopy Systems | Time-Domain | ||
| Frequency-Domain | |||
| Communication Systems | |||
| By Frequency Range | Low-Frequency Terahertz | ||
| Mid-Frequency Terahertz | |||
| High-Frequency Terahertz | |||
| By End User | Healthcare | ||
| Defense and Security | |||
| Telecommunications | |||
| Industrial | |||
| Food and Agriculture | |||
| Laboratories | |||
| Other End Users | |||
| By Component Type | Terahertz Sources | ||
| Terahertz Detectors | |||
| Optics and Passive Components | |||
| Systems and Softwares | |||
| By Geography | North America | United States | |
| Canada | |||
| Mexico | |||
| South America | Brazil | ||
| Argentina | |||
| Rest of South America | |||
| Europe | United Kingdom | ||
| Germany | |||
| France | |||
| Italy | |||
| Rest of Europe | |||
| Asia Pacific | China | ||
| Japan | |||
| India | |||
| South Korea | |||
| Rest of Asia Pacific | |||
| Middle East and Africa | Middle East | United Arab Emirates | |
| Saudi Arabia | |||
| Rest of Middle East | |||
| Africa | South Africa | ||
| Egypt | |||
| Rest of Africa | |||


Key Questions Answered in the Report
What is the projected value of the terahertz technologies market by 2031?
The market is forecast to reach USD 1.77 billion by 2031.
How fast is the terahertz technologies market expected to grow?
It is projected to register a 14.74% CAGR during 2026-2031.
Which region is likely to lead future terahertz deployments?
Asia-Pacific is set to expand fastest, with a 15.79% CAGR driven by strong 6G and R&D funding.
Why are mid-frequency terahertz platforms popular?
They balance spatial resolution, atmospheric transmission, and component readiness, capturing nearly half of 2025 revenue.
Which end-user segment is growing quickest?
Healthcare applications are forecast to grow at 16.11% annually, outpacing telecommunications.
What major challenge limits outdoor terahertz backhaul links?
Water-vapor absorption narrows transmission windows, requiring high link budgets or limiting service to dry conditions.
Page last updated on:


