Tantalum Capacitors Market Size and Share
Market Overview
| Study Period | 2020 - 2031 |
|---|---|
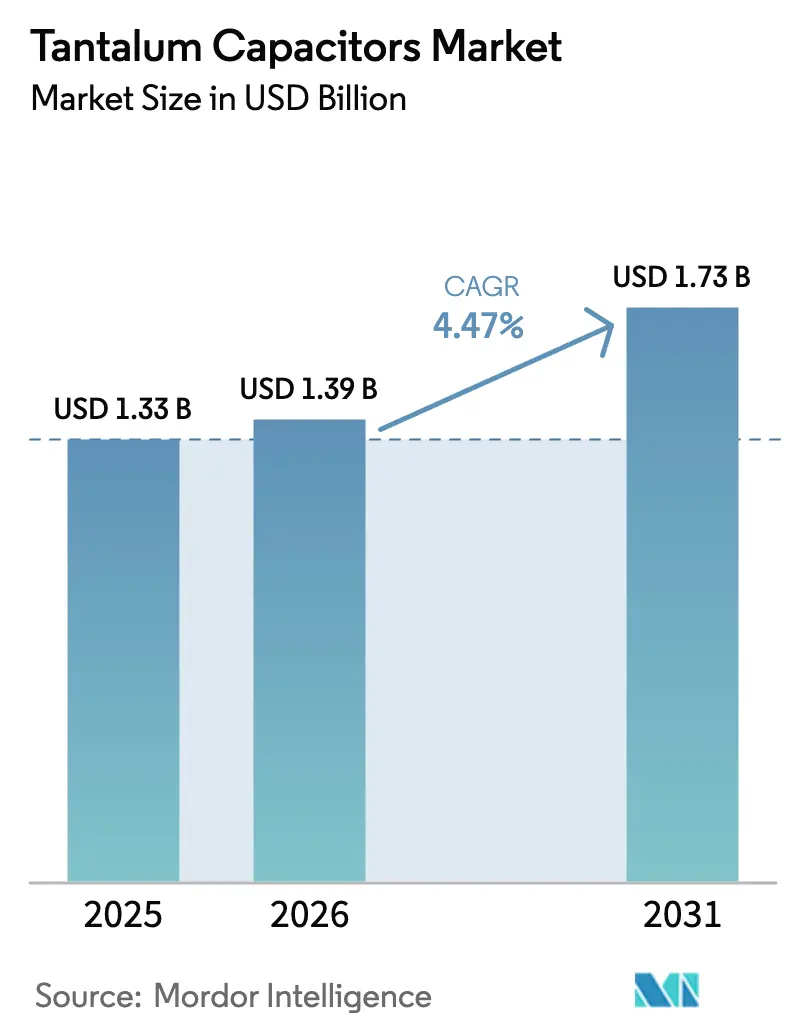
| Market Size (2026) | USD 1.39 Billion |
| Market Size (2031) | USD 1.73 Billion |
| Growth Rate (2026 - 2031) | 4.47% CAGR |
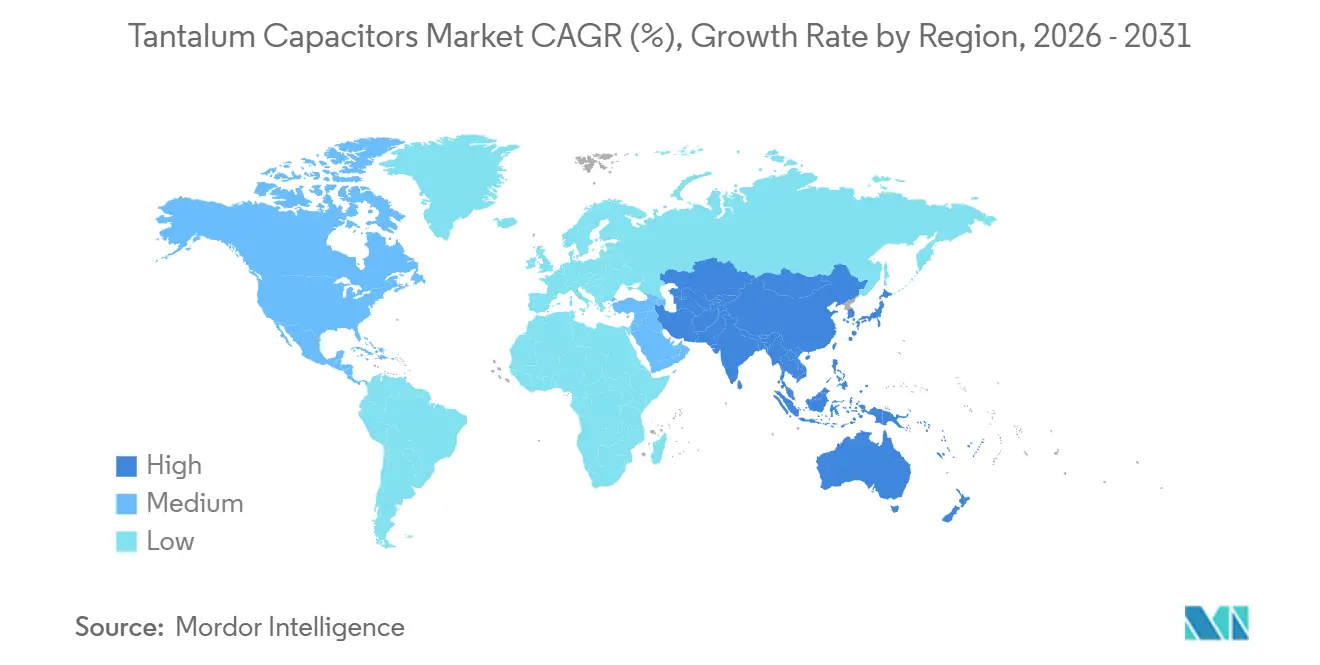
| Fastest Growing Market | Asia Pacific |
| Largest Market | Asia Pacific |
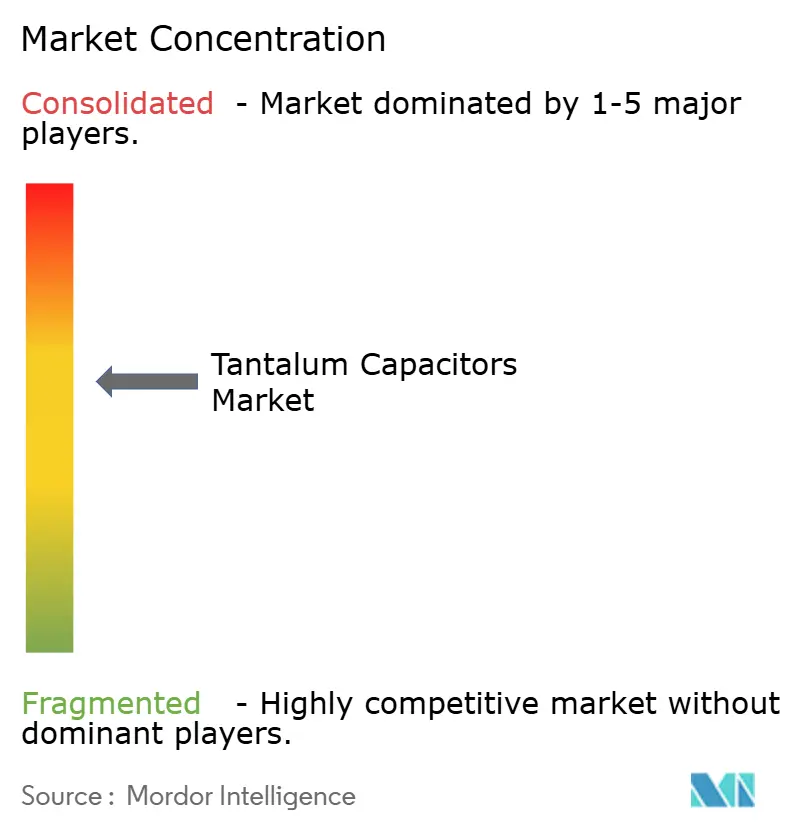
| Market Concentration | Medium |
Major Players *Disclaimer: Major Players sorted in no particular order Image © Mordor Intelligence. Reuse requires attribution under CC BY 4.0. | |
Tantalum Capacitors Market Analysis by Mordor Intelligence
The Tantalum Capacitors Market size is expected to grow from USD 1.33 billion in 2025 to USD 1.39 billion in 2026 and is forecast to reach USD 1.73 billion by 2031 at 4.47% CAGR over 2026-2031. Demand is broad-based but highly skewed toward high-capacitance polymer parts for artificial-intelligence servers, where NVIDIA’s GB200 and GB300 boards are pulling inventory faster than legacy handset and notebook cycles. Tight supply is visible in 2026 lead times of 18-40 weeks, up from 8-10 weeks in late 2025, and suppliers have applied 15-30% price surcharges to ration capacity. Asia-Pacific retains cost and logistics advantages, helped by Shenzhen’s dense supply chain, while North America’s defense sector is absorbing price hikes as it works to localize tantalum mining and refining. The product mix is shifting toward conductive-polymer parts with very low equivalent series resistance, but solid manganese dioxide types still dominate revenue because of their installed base in cost-sensitive consumer applications.
Key Report Takeaways
- By product type, solid manganese dioxide devices led with 83.27% of the tantalum capacitors market share in 2025, while niobium oxide parts are projected to record the fastest 5.23% CAGR through 2031.
- By mounting type, surface-mount packages accounted for 79.44% of 2025 sales and will expand at a 4.83% CAGR to 2031.
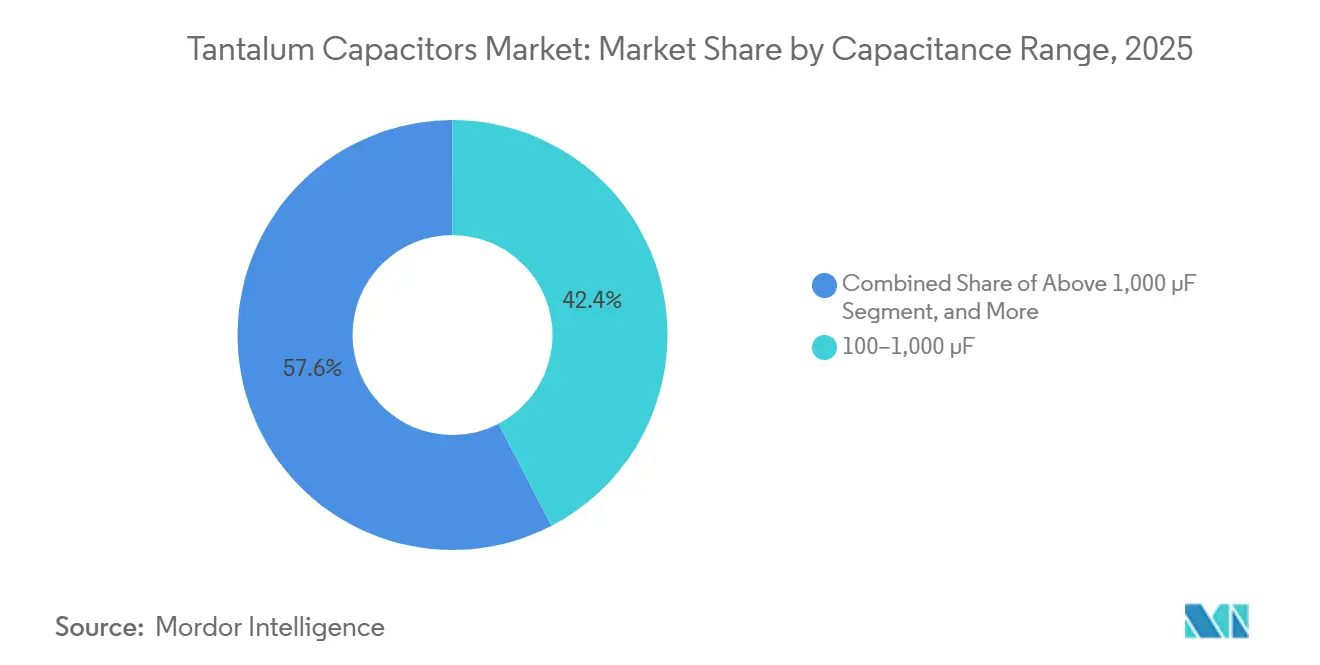
- By capacitance, the 100-1,000 µF tier accounted for 42.38% of the tantalum capacitors market share in 2025, whereas the above-1,000 µF tier is set to post the fastest 5.07% CAGR going forward.
- By application, consumer electronics captured 31.26% of the market in 2025, yet automotive electronics will be the fastest-growing segment at 5.89% until 2031.
- By geography, Asia-Pacific commanded 61.94% of 2025 revenue and is on track for a 5.42% CAGR during the forecast window.
Note: Market size and forecast figures in this report are generated using Mordor Intelligence’s proprietary estimation framework, updated with the latest available data and insights as of 2026.
Global Tantalum Capacitors Market Trends and Insights
Drivers Impact Analysis*
| Driver | (~) % Impact on CAGR Forecast | Geographic Relevance | Impact Timeline |
|---|---|---|---|
| Miniaturization of Electronic Devices | +0.9% | Global, especially Asia-Pacific consumer hubs | Medium term (2-4 years) |
| Rising In-Vehicle Electronics Adoption | +1.2% | North America and Europe, expanding into China and India | Long term (≥ 4 years) |
| Surge in 5G Smartphone Production | +0.7% | Asia-Pacific, secondary pull in North America | Short term (≤ 2 years) |
| MLCC Supply Instability Favoring Tantalum | +0.6% | Global, episodic tightness in Asia-Pacific and North America | Short term (≤ 2 years) |
| Reliability Demand in Implantable Devices | +0.5% | North America and Europe regulatory zones | Long term (≥ 4 years) |
| Expansion of Aerospace and Defense Electronics | +0.8% | North America, Europe and the Middle East | Long term (≥ 4 years) |
| Source: Mordor Intelligence | |||
Miniaturization of Electronic Devices
Smartphone and wearable brands are shrinking board footprints, forcing tantalum case sizes down to 0402 and 0603 formats without losing capacitance, a leap enabled by ultra-fine powder refinement that pushes CV values past 300,000 µF-V.[1]Kyocera AVX, “TACmicrochip Product Page,” kyocera-avx.com Conductive-polymer cathodes slash equivalent series resistance to sub-10 mΩ, allowing designers to cut the number of parallel capacitors and reclaim precious surface area for larger batteries and sensors. Board-edge terminal structures further reduce package height below 1 mm, unlocking placement in foldable hinge zones and implantable medical shells. Hearing-aid makers are early adopters because regulatory comfort and patient ergonomics hinge on ultra-small, high-reliability passives. The same trend extends to IoT modules, where every square millimeter of printed circuit board real estate is monetized.
Rising In-Vehicle Electronics Adoption
An electric vehicle built in 2026 integrates roughly USD 1,200 worth of electronics, twice the content of a gasoline car, and zonal architectures are beginning to replace dozens of legacy control units with a handful of domain controllers that demand rugged bulk decoupling. Tantalum’s benign open-circuit failure mode meets ISO 26262 fault-tolerance requirements, making it preferred for battery-management units, motor inverters, and radar modules. Consultancy data place automotive semiconductor demand on a 10.7% CAGR trajectory through 2030, aligning closely with the forecast uptick in automotive-qualified tantalum units. BloombergNEF counts 22 million EVs in service in 2025, headed for 39 million by 2030, sustaining the need for capacitors qualified to AEC-Q200 and operating over the –55 °C to 150 °C range.
Surge in 5G Smartphone Production
Fifth-generation handsets employ extra antenna arrays and power-hungry front ends, driving more low-ESR capacitors into radio modules and application processors. Domestic output in Japan jumped 30% year-over-year to 430 million units during 1H 2025, with 383 million exported, a clear sign of OEM pull for high-capacitance parts.[2]Japan Society of New Metals, “Tantalum Committee Production Statistics,” jsnm.or.jp Base-station rollouts echo handset demand, as standalone 5G cores require higher-capacitance decoupling on baseband and remote radio boards. Semiconductor trade statistics show a 11.2% rise in global chip revenue in 2025, indirectly reinforcing demand for tantalum used in power supplies for logic and memory systems.
MLCC Supply Instability Favoring Tantalum
Ceramic capacitor lead times spiked in mid-2025, nudging engineers toward tantalum substitutes in voltage-regulator modules where piezoelectric noise and ceramic DC bias become problematic. Polymer lead times for tantalum lengthened from 8-10 weeks to 18-40 weeks in 2026 as AI servers absorbed capacity. The design-in window is temporary, yet every incremental slot awarded now often remains captive for a full product generation, especially in automotive and industrial systems, where requalification is expensive. Asian OEMs hedge by dual-sourcing ceramic and tantalum footprints, while North American defense contractors accept the cost premium for assured supply.
Restraints Impact Analysis*
| Restraint | (~) % Impact on CAGR Forecast | Geographic Relevance | Impact Timeline |
|---|---|---|---|
| Tantalum Ore Price and Supply Volatility | -0.8% | Global, acute in Great Lakes sourcing nations | Short term (≤ 2 years) |
| Competition from Ceramic and Aluminum Capacitors | -0.6% | Global, strongest in cost-sensitive consumer and industrial devices | Medium term (2-4 years) |
| Export Controls on Tantalum Raw Materials | -0.4% | North America and Europe compliance regimes, China strategic restrictions | Long term (≥ 4 years) |
| Emerging Niobium-Oxide and Graphene Capacitors | -0.3% | Early use in defense and aerospace, graphene still lab-scale | Long term (≥ 4 years) |
| Source: Mordor Intelligence | |||
Tantalum Ore Price and Supply Volatility
Armed conflict in the Democratic Republic of Congo and Rwanda disrupted half of the global ore supply in late 2025, sending powder prices sharply higher and forcing capacitor makers to pass through 15-30% hikes to customers.[3]European Commission, “Conflict Minerals Regulation Overview,” europa.eu The United States Government responded by earmarking USD 265.923 million in Defense Production Act funds for domestic mining and recycling, underscoring the strategic imperative for aerospace and defense users. Powder oxidizes during extended storage, limiting the inventory buffer and magnifying exposure to spot-market swings. Compliance with Dodd-Frank and EU conflict-minerals rules adds paperwork costs for smaller firms, trimming margins during volatile pricing cycles.
Competition from Ceramic and Aluminum Capacitors
Multilayer ceramic capacitors keep pushing volumetric efficiency and cost down, reclaiming sockets lost during the 2025 shortage once new kilns come online. Aluminum-polymer parts now rival tantalum in ripple-current capability at a lower cost per joule, eroding share in industrial power supplies. In consumer electronics, handset vendors accept ceramic’s piezo-noise trade-off to shave cents off the bill of materials. Tantalum’s core defense, aerospace, and implantable-medical niches remain protected by qualification barriers and predictable failure modes, but those segments expand more slowly than the mass-market consumer and automotive fields.
*Our forecasts treat driver/restraint impacts as directional, not additive. The impact forecasts reflect baseline growth, mix effects, and variable interactions.
Segment Analysis
By Product Type: Polymer Rapidly Gains Traction
Solid manganese dioxide units accounted for 83.27% of the tantalum capacitor market share in 2025, underscoring their long-standing position in cost-sensitive consumer and industrial electronics. Despite that dominance, the tantalum capacitor market for polymer devices is expanding rapidly as artificial intelligence servers and high-performance computing boards demand sub-10 mΩ equivalent series resistance for tight voltage regulation. OEMs are also adopting niobium-oxide parts because their 95% lower ignition risk allows engineers to rate them at 80% of working voltage, trimming case size and component count. Manufacturers are therefore dual-sourcing manganese dioxide and polymer chemistries to balance cost, performance, and safety obligations.
Between 2026 and 2031, niobium-oxide capacitors are forecast to post a 5.23% CAGR, the fastest among product types, while conductive-polymer lines benefit from continuous CV gains delivered by finer powder grains and multianode structures. Kyocera AVX’s post-acquisition portfolio offers both polymer and MnO₂ devices from the same plant, reducing qualification effort for automotive and medical customers. Wet electrolytic options remain a niche but strategically important choice for downhole drilling tools and radar pulse-power circuits that operate from −55 °C to 200 °C. Across all chemistries, suppliers are prioritizing traceable powder sourcing to meet conflict-minerals audits, which have become a gating factor for defense and aerospace bids.


By Mounting Type: Surface-Mount Dominates New Designs
Surface-mount packages captured 79.44% of 2025 revenue and are on pace for a 4.83% CAGR through 2031 as handset, wearable, and zonal automotive projects utilize automated placement lines. The tantalum capacitor market size for SMT formats is growing as legacy through-hole boards are redesigned for a pick-and-place flow, saving labor and shrinking product height to sub-1 mm, while foldable screens and medical implants demand extreme thinness. Emerging 0402 and 0603 codes now support capacitance values previously requiring 0805 footprints, freeing space for batteries and sensors.
Through-hole devices still matter in satellite and ground-combat platforms governed by MIL-PRF-39006, where axial leads simplify field repair and meet historic drawings. New QPL approvals with 0.1% per 1,000-hour failure rates are extending the service life of this niche, but every automotive tier-one that migrates to full SMT reinforces the long-term tilt toward board-level assembly automation. Suppliers complement the shift by offering stackable SMT arrays that raise capacitance without enlarging the XY envelope, aligning with dense AI motherboards that already host hundreds of power decouplers.
By Capacitance Range: Growth Clusters Above 1,000 µF
Components rated between 100 µF and 1,000 µF accounted for 42.38% of the 2025 segment revenue, meeting the bulk-decoupling needs of consumer gadgets, industrial drives, and telecom rectifiers. That mid-range sweet spot benefits from broad voltage offerings, but the tantalum capacitors market size for devices above 1,000 µF is expected to climb fastest, at 5.07% CAGR, because AI accelerators and electric-vehicle inverters now draw hundreds of amperes in nanosecond bursts. Each NVIDIA GB-series server board can incorporate several hundred 1,500 µF polymer parts, lifting unit demand even in flat shipment years.
Designers are willing to pay for a larger CV per cc to consolidate multiple 470 µF placements into fewer high-capacitance bodies, reducing solder joints that often trigger field returns. Wet hermetic families have pushed to 470 µF at 125 V in T4 cases, enabling radar and drilling gear to downsize power rails without sacrificing temperature margin. Conversely, the up to 100 µF band remains stable for RF front ends and sensor clusters, where impedance control outweighs the need for absolute energy storage. Vendors thus maintain three distinct value propositions: low-CV RF stability, mid-CV versatility, and high-CV energy density to align with divergent board-level architectures.
By Application: Automotive Leads Future Upside
Consumer electronics accounted for 31.26% of 2025 revenue, yet the tantalum capacitors market share tied to automotive electronics is set to expand the fastest, with a 5.89% CAGR projected through 2031. Battery-electric vehicles integrate roughly USD 1,200 worth of electronics, double the internal-combustion norm, and rely on capacitors that fail open rather than short to satisfy ISO 26262 safety analyses. Zonal architectures are consolidating dozens of control units into a handful of high-power domains, each requiring robust bulk decoupling at −55 °C to 150 °C.
The industrial and telecom segments provide a steady baseline demand, as long-life power supplies and 5G base stations value tantalum’s stable impedance under thermal stress. Implantable medical devices, while low volume, deliver premium margins because FDA and ISO 13485 audits deter unqualified entrants. Defense and aerospace purchases remain resilient, buoyed by United States funding for domestic powder processing that de-risks supply for MIL-PRF-55365 lines. Smartphone and notebook growth is moderating, nudging suppliers toward higher-reliability niches that offset slowing volume with richer average selling prices.
Geography Analysis
Asia-Pacific generated 61.94% of global revenue in 2025, and the regional tantalum capacitors market is projected to grow at a 5.42% CAGR through 2031, driven by Shenzhen’s tight cluster of powder processors, chip mounters, and overnight logistics that cut lead times for handset, automotive, and server builders. Japan’s 2025 rebound, with output up 30% to 430 million units and exports up 39% to 383 million units, reinforces the country’s role as a premium hub for aerospace and automotive grades. Chinese producers such as Hongda Electronics are adding sintering lines that anchor forward-integration strategies aimed at military and grid-storage customers who value domestic supply assurance.
North America commands a smaller revenue base, yet the region’s tantalum capacitors market share is underpinned by defense and space programs that tolerate price surcharges in exchange for MIL-PRF traceability. The United States Government set aside USD 265.923 million in fiscal-year 2026 Defense Production Act funds to seed domestic mining, refining, and recycling, a move expected to boost regional capacity after 2028. Buyers for avionics, missile guidance, and space platforms often lock in multi-year agreements to hedge against ore price swings, keeping utilization high even during consumer slowdowns. Canada and Mexico are adding incremental pull-through automotive plants that are electrifying powertrains and require AEC-Q200-qualified passives.
Europe ranks third by revenue and leans heavily on Germany, France, and Italy, where electrified vehicle output and industrial drives keep orders steady. Conflict-minerals regulations raise auditing costs, yet they also create a barrier that favors suppliers with long-standing, fully traced chains. Smaller regions such as South America, the Middle East, and Africa contribute episodic demand tied to telecom rollouts and mining equipment, but collectively account for well under 10% of global sales. Their procurement cycles are lumpy, so vendors often serve them from Asian hub inventories rather than dedicate local stock points.

Competitive Landscape
Market concentration is elevated, with KEMET accounting for more than 40% of revenue and the combined stake of KEMET, Kyocera AVX, and Vishay estimated at 60-70%, leaving limited headroom for newcomers who lack vertical links to high-purity powder. Acquisition remains the preferred path to scale, as exemplified by Kyocera AVX’s 2022 purchase of ROHM’s polymer and tantalum lines, which brought critical patents under a single operating platform. Incumbents also defend share by locking multi-year powder contracts and qualifying parts to MIL-PRF-55365, hurdles that deter fast-follower rivals.
Technology differentiation hinges on polymer cathode chemistry, multianode stacking, and powder-grain refinement that push capacitance-voltage products toward 400,000 µF-V. Kyocera AVX introduced 16 new TBM space-level multianode parts in October 2025, giving satellite integrators access to 1,500 µF ratings at 35 V, with lead times booked out for 6 months. Panasonic raised conductive-polymer prices by up to 30% in February 2026, citing ore supply shocks, and signaled more hikes if Great Lakes mining disruptions linger. Vishay mitigates geopolitical risk through plants in Israel, Vermont, China, and Japan, enabling rapid rerouting when tariffs shift.
Chinese challengers such as Hongda Electronics are gaining market share in military and energy-storage niches by offering fully domestic supply chains that avoid the paperwork required for exports under export controls. Niche innovators are promoting niobium-oxide parts with 95% lower ignition risk, though volume remains small because qualification data are still scarce. Wet-hermetic families remain relevant for −55 °C to 200 °C extremes, securing repeat business in radar, oil-field tools, and nuclear sensors. Across the board, lead times remain stretched to 18-40 weeks, so customers often dual-source manganese dioxide and polymer types to ensure production continuity.
Tantalum Capacitors Industry Leaders
KEMET Corporation
KYOCERA AVX Components Corporation
Panasonic Corporation
Vishay Intertechnology Inc.
NIC Components Corp.
- *Disclaimer: Major Players sorted in no particular order

Recent Industry Developments
- February 2026: Panasonic raised conductive-polymer tantalum prices by 15-30% citing ore inflation and tight powder supply.
- November 2025: KEMET applied up to 30% price hikes on T520, T521 and T530 series as lead times hit 17 weeks.
- October 2025: Kyocera AVX released 16 new TBM space-level tantalum part numbers covering 10-1,500 µF, 2.5-35 V.
- September 2025: Kyocera AVX unveiled DSCC 25007 mini BME ceramic stacks aimed at defense and space customers.


Global Tantalum Capacitors Market Report Scope
The Tantalum Capacitors Market Report is Segmented by Product Type (Solid MnO2 Tantalum Capacitors, Solid Polymer Tantalum Capacitors, Wet Electrolytic Tantalum Capacitors, Niobium Oxide Capacitors), Mounting Type (Surface-Mount (SMD), and Through-Hole), Capacitance Range (Up to 100 µF, 100–1,000 µF, Above 1,000 µF), Application (Consumer Electronics, Automotive Electronics, Industrial Equipment, Medical Devices, Defense and Aerospace, Telecommunications Infrastructure, Other Applications), and Geography (North America, South America, Europe, Asia-Pacific, Middle East and Africa). The Market Forecasts are Provided in Terms of Value (USD).
| Solid MnO2 Tantalum Capacitors |
| Solid Polymer Tantalum Capacitors |
| Wet Electrolytic Tantalum Capacitors |
| Niobium Oxide Capacitors |
| Surface-Mount (SMD) |
| Through-Hole (Leaded) |
| Up to 100 µF |
| 100 – 1,000 µF |
| Above 1,000 µF |
| Consumer Electronics |
| Automotive Electronics |
| Industrial Equipment |
| Medical Devices |
| Defense and Aerospace |
| Telecommunications Infrastructure |
| Other Applications |
| North America | United States | |
| Canada | ||
| Mexico | ||
| South America | Brazil | |
| Argentina | ||
| Rest of South America | ||
| Europe | United Kingdom | |
| Germany | ||
| France | ||
| Italy | ||
| Rest of Europe | ||
| Asia Pacific | China | |
| Japan | ||
| India | ||
| South Korea | ||
| Rest of Asia Pacific | ||
| Middle East and Africa | Middle East | United Arab Emirates |
| Saudi Arabia | ||
| Rest of Middle East | ||
| Africa | South Africa | |
| Egypt | ||
| Rest of Africa | ||
| By Product Type | Solid MnO2 Tantalum Capacitors | ||
| Solid Polymer Tantalum Capacitors | |||
| Wet Electrolytic Tantalum Capacitors | |||
| Niobium Oxide Capacitors | |||
| By Mounting Type | Surface-Mount (SMD) | ||
| Through-Hole (Leaded) | |||
| By Capacitance Range | Up to 100 µF | ||
| 100 – 1,000 µF | |||
| Above 1,000 µF | |||
| By Application | Consumer Electronics | ||
| Automotive Electronics | |||
| Industrial Equipment | |||
| Medical Devices | |||
| Defense and Aerospace | |||
| Telecommunications Infrastructure | |||
| Other Applications | |||
| By Geography | North America | United States | |
| Canada | |||
| Mexico | |||
| South America | Brazil | ||
| Argentina | |||
| Rest of South America | |||
| Europe | United Kingdom | ||
| Germany | |||
| France | |||
| Italy | |||
| Rest of Europe | |||
| Asia Pacific | China | ||
| Japan | |||
| India | |||
| South Korea | |||
| Rest of Asia Pacific | |||
| Middle East and Africa | Middle East | United Arab Emirates | |
| Saudi Arabia | |||
| Rest of Middle East | |||
| Africa | South Africa | ||
| Egypt | |||
| Rest of Africa | |||


Key Questions Answered in the Report
What CAGR is forecast for global sales of tantalum capacitors from 2026 to 2031?
The market is projected to grow at 4.47% annually over 2026-2031.
Which region will contribute the largest incremental revenue through 2031?
Asia-Pacific will add the most, fuelled by Shenzhen-centered manufacturing and a 5.42% CAGR.
Why are polymer tantalum capacitors popular in AI servers?
They offer sub-10 mΩ ESR and high capacitance, enabling tight voltage regulation for GPU and HB-memory rails.
How is the automotive shift to zonal E/E architectures influencing capacitor demand?
Fewer but higher-power domain controllers need robust bulk decoupling, driving rapid uptake of high-reliability tantalum parts.
What is prompting recent price increases for tantalum capacitors?
Disrupted ore flows from the Democratic Republic of Congo and Rwanda have lifted powder costs, forcing 15-30% price hikes.
Which product type is expected to grow fastest through 2031?
Niobium-oxide capacitors are forecast to expand at a 5.23% CAGR owing to lower ignition risk and higher usable voltage.
Page last updated on:


