Market Overview
| Study Period | 2020 - 2031 |
|---|---|
| Forecast Data Period | 2026 - 2031 |
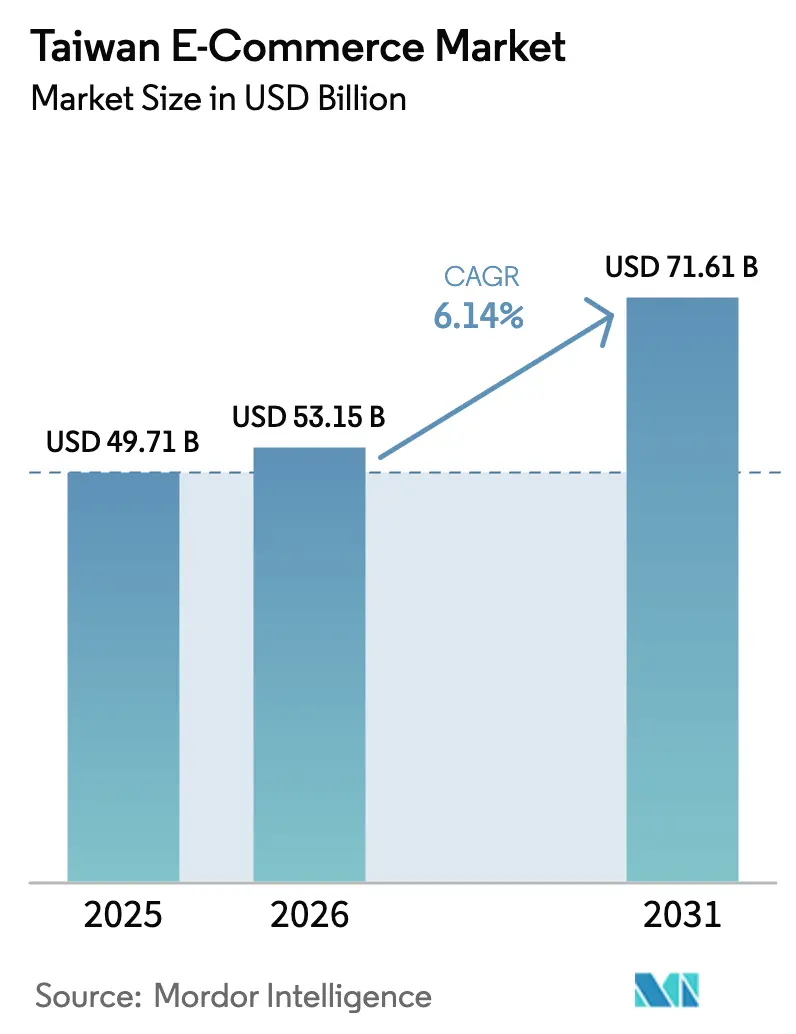
| Base Year Market Size (2025) | USD 49.71 Billion |
| Market Size (2026) | USD 53.15 Billion |
| Market Size (2031) | USD 71.61 Billion |
| Growth Rate (2026 - 2031) | 6.14% CAGR |
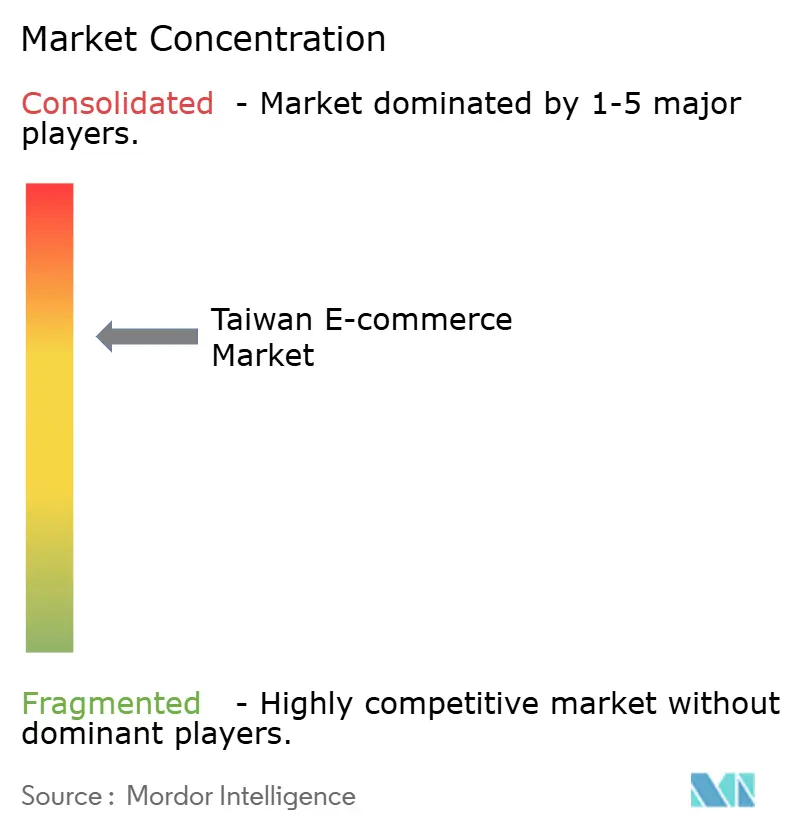
| Market Concentration | Medium |
Major Players *Disclaimer: Major Players sorted in no particular order Image © Mordor Intelligence. Reuse requires attribution under CC BY 4.0. | |
Taiwan E-Commerce Market Analysis by Mordor Intelligence
The Taiwan e-commerce market size is projected to be USD 49.71 billion in 2025, USD 53.15 billion in 2026, and reach USD 71.61 billion by 2031, growing at a CAGR of 6.14% from 2026 to 2031. Rising smartphone penetration, government investment in cash-free payments, and faster 5G networks together underpin this steady climb in market size and revenue. Competitive discounting, live-stream retail tools, and factory-to-consumer logistics are further nudging more product categories online, while subscription models tailored to a super-aged population keep transaction frequency high. Platform operators are also scaling automated guided vehicles and AI-driven fulfillment to offset warehouse labor shortages, an approach that compresses delivery times and lowers picking errors. At the same time, geopolitical and privacy risks add volatility, encouraging merchants to diversify sourcing and reinforce data-security controls as they tap the expanding Taiwan e-commerce market.
Key Report Takeaways
- By business model, the B2C segment held 72.68% of the Taiwan e-commerce market share in 2025, while B2B is advancing at a 7.43% CAGR to 2031.
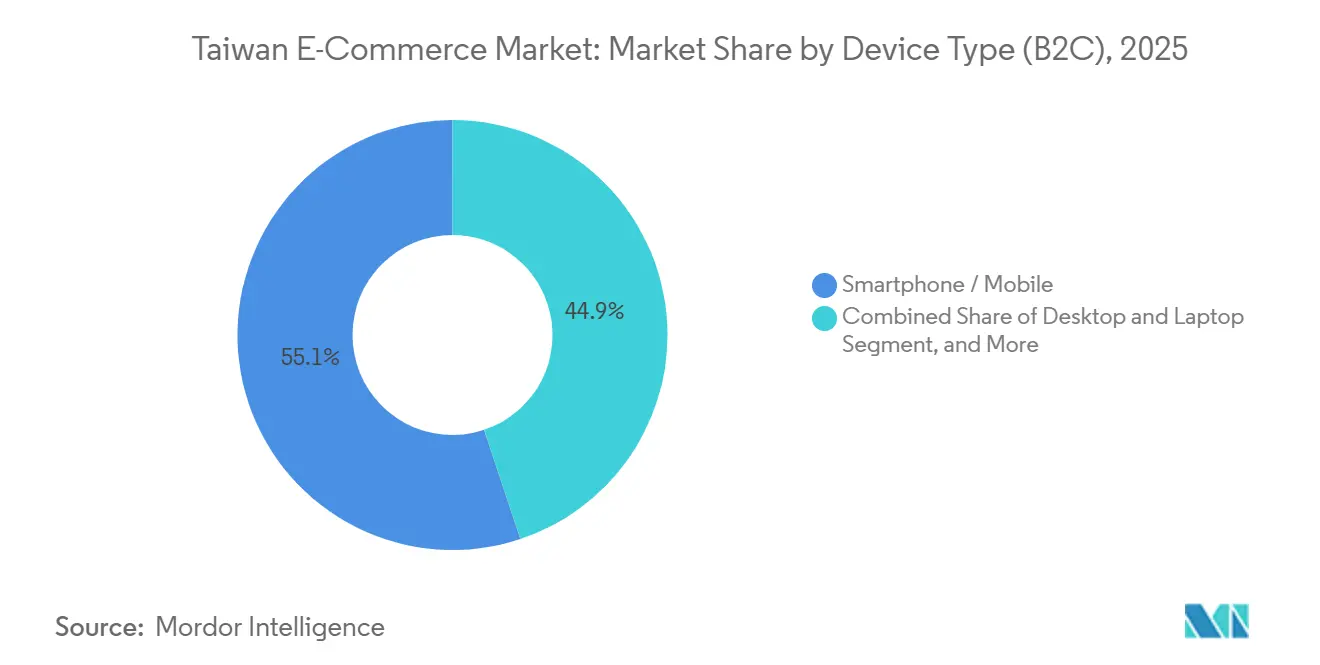
- By device type, smartphones captured 55.12% of 2025 transaction value and are projected to grow at a 7.27% CAGR to 2031, the fastest among all devices.
- By payment method, credit and debit cards retained a 40.16% share of the Taiwan e-commerce market size in 2025, yet digital wallets are climbing at an 8.12% CAGR through 2031.
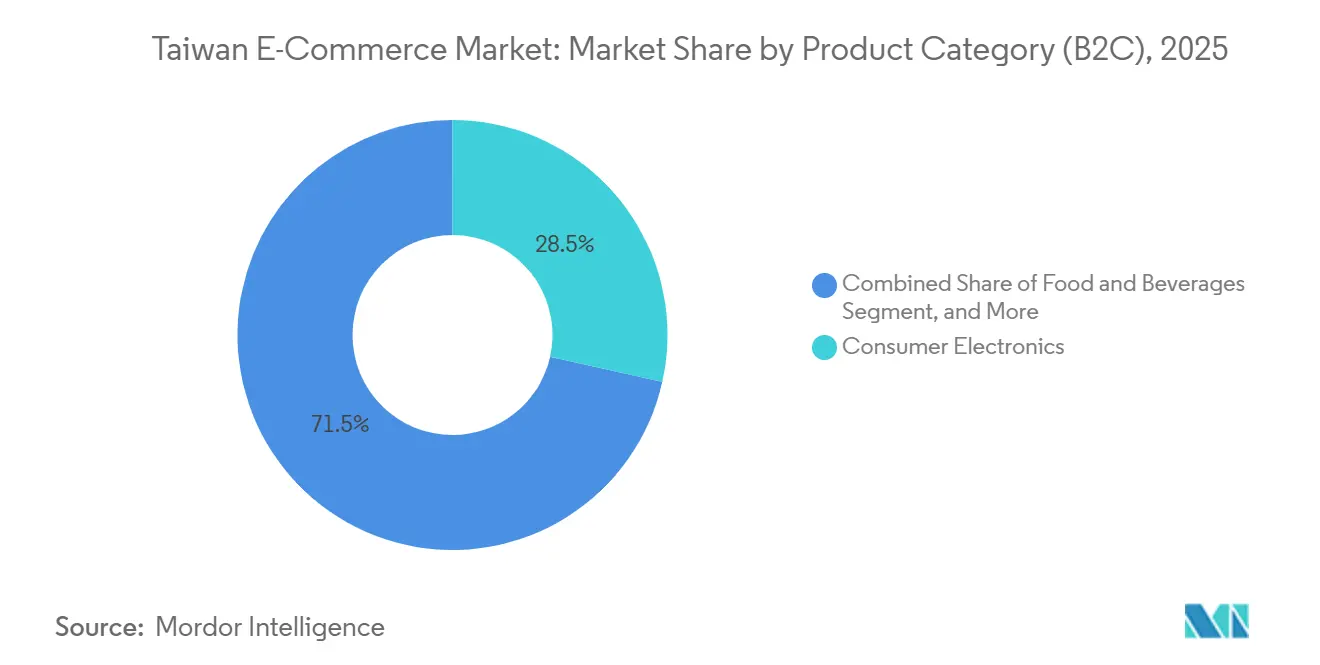
- By product category, consumer electronics led with a 28.49% revenue share in 2025, while food and beverages is forecast to expand at a 6.89% CAGR to 2031.
Note: Market size and forecast figures in this report are generated using Mordor Intelligence’s proprietary estimation framework, updated with the latest available data and insights as of January 2026.
Taiwan E-Commerce Market Trends and Insights
Drivers Impact Analysis*
| Driver | (~) % Impact on CAGR Forecast | Geographic Relevance | Impact Timeline |
|---|---|---|---|
| Government Push to 90% Mobile-Payment Penetration by 2025 | +1.2% | National, strongest in Taipei, Taichung, Kaohsiung | Medium term (2-4 years) |
| Surging Mobile-First Shopper Base and 5G Coverage | +1.5% | National | Short term (≤ 2 years) |
| Live-Stream and Social-Commerce Monetization Boom | +0.9% | National, higher engagement in urban centers | Medium term (2-4 years) |
| Automated Last-Mile Pilots Using Drones and AGVs | +0.7% | Taipei, New Taipei, Taoyuan | Long term (≥ 4 years) |
| Subscription-Commerce Uptake Among Aging and Single Households | +0.8% | Super-aged municipalities | Long term (≥ 4 years) |
| AI-Powered Personalization Lifting Basket Size | +1.0% | National | Medium term (2-4 years) |
| Source: Mordor Intelligence | |||
Government Push to 90% Mobile-Payment Penetration by 2025
Regulators set a 90% mobile-payment penetration objective to accelerate cash-free commerce, a move that trims checkout friction and boosts repeat purchases. Approval of LINE Pay Money as a standalone e-payment institution widened merchant acceptance to more than 610,000 offline points, improving coverage in convenience stores and transit hubs.[1]Financial Supervisory Commission, “LINE Pay Money Approved as Independent E-Payment Institution,” fsc.gov.tw The Taiwan Digital Identity Wallet launched in late 2025 layers official IDs onto commercial apps, simplifying age checks and cross-border remittances.[2]Ministry of Digital Affairs, “Taiwan Digital Identity Wallet Launch,” moda.gov.tw Together, these policies cut the onboarding cost for new shoppers and shrink the adoption gap between metro and rural users. Platforms already holding large wallet user bases gain a structural head start, while smaller entrants face steeper acquisition costs.
Surging Mobile-First Shopper Base and 5G Coverage
Faster 5G lines reached more than 40% of mobile connections by late 2024, giving the Taiwan e-commerce market headroom to run heavy AR previews and HD live-streams. Smartphone internet penetration exceeded 96%, and messaging app LINE logs 22 million monthly users, equal to 94% of the population. These conditions let platforms pivot to portrait-video storefronts and one-tap checkouts that shorten buying journeys. Desktop still dominates high-value B2B procurement, yet consumer traffic skews mobile, signaling where future interface innovations will concentrate. Strong bandwidth also eases growth of subscription auto-replenishment services favored by older shoppers who value convenience over comparison browsing.
Live-Stream and Social-Commerce Monetization Boom
Livestream shopping already accounts for roughly one-quarter of regional GMV and is rapidly permeating the Taiwan e-commerce market. Surveys show seven in ten local internet users have bought via live video, split across Facebook, YouTube, and Shopee sessions.[3]Taiwan Institute for Information Industry, “Livestream Commerce Survey,” iii.org.tw New tax rules in 2026 force creators to declare sponsored income, prompting platforms to embed automated reporting dashboards that lessen compliance drag. The outcome is a more professional influencer ecosystem with clear revenue-share models and stronger brand safety for advertisers. Over 12 million shoppers now visit LINE Shopping each month, illustrating how chat-native feeds convert social attention into sales.
Automated Last-Mile Pilots Using Drones and AGVs
Government grants worth NTD 2.5 billion (USD 83 million) subsidize predictive analytics tools across retail and logistics, raising revenue 5.4% on average for participating firms.[4]Ministry of Economic Affairs, “Monthly Retail and Wholesale Sales Statistics,” moea.gov.tw Consumer surveys confirm that two-thirds of shoppers welcome AI suggestions, correlating with larger carts and higher reorder rates. Momo lifted R&D spending by 20% in early 2025 to refine inventory orchestration, while PChome’s Linkou hub deploys sorting algorithms that power same-day drops in metro Taipei. Shopee added AI chatbots and seller tools, boosting core marketplace revenue by 52.8% year-on-year. Personalization is therefore shifting from an experimental overlay to a required staple in crowded product verticals.
Restraints Impact Analysis*
| Restraint | (~) % Impact on CAGR Forecast | Geographic Relevance | Impact Timeline |
|---|---|---|---|
| Data-Privacy and Cyber-Fraud Concerns | -0.6% | National | Short term (≤ 2 years) |
| Margin Squeeze from Intense Price Wars | -0.9% | Major metros | Short term (≤ 2 years) |
| Warehouse Labor Shortages Amid Aging Workforce | -0.5% | Logistics hubs | Medium term (2-4 years) |
| Cross-Strait Regulatory and Geopolitical Risk on Fulfillment Flows | -0.7% | Cross-border merchants | Long term (≥ 4 years) |
| Source: Mordor Intelligence | |||
Data-Privacy and Cyber-Fraud Concerns
Taiwan’s Personal Data Protection Act enforces breach notices within 72 hours and fines up to NTD 15 million (USD 0.5 million) for non-compliance, elevating cybersecurity outlays. A 2025 study found 73% of shoppers worry about online privacy, discouraging use of biometric logins despite convenience upside. The 2025 Telecommunications Management Act amendment adds real-time fraud monitoring obligations for carriers and gateways. Small platforms lacking ISO 27001 facilities struggle to absorb these costs, which nudges share toward incumbents. International sellers must also reconcile local data-localization leanings with GDPR, complicating expansion roadmaps and lengthening integration timelines.
Margin Squeeze from Intense Price Wars
Coupang’s 2025 entry with warehouse wages of NTD 720 per hour (USD 24) quadrupled the statutory minimum and compressed rival cost structures, shrinking Momo’s quarterly revenue by 1.76%. PChome reported a NTD 430 million (USD 14.3 million) net loss in 2024 after deep free-shipping promotions. Web traffic data show the top six platforms exceed 10 million monthly visits each, while the next tier hovers near 1 million, underscoring winner-take-most gravity. Discount races draw shoppers but erode gross margins faster than ad or fintech upsells can back-fill. Platforms respond by expanding third-party marketplaces to offload inventory risk, yet this move blurs brand identity and complicates quality control.
*Our forecasts treat driver/restraint impacts as directional, not additive. The impact forecasts reflect baseline growth, mix effects, and variable interactions.
Segment Analysis
By Business Model: B2B Channels Outpace Consumer Platforms
Taiwan e-commerce market size for business-to-consumer activity stood at 72.68% share in 2025 of overall spend, but growth is tapering toward the mid-single digits. In contrast, the B2B slice is scaling at a 7.43% CAGR, reflecting procurement digitization across electronics, machinery, and chemical inputs. TAITRA’s Taiwantrade now lists more than 70,000 suppliers and 660,000 catalogs, giving small buyers instant access to sample orders without offline trips. Digital RFQ tools remove language barriers and time-zone friction, which historically hampered export lead generation.
Platform economics also diverge. B2C operators race on delivery speed and promotional flash sales that compress contribution margins. Momo raised R&D outlays 20% to feed recommendation engines, yet user growth only edged up 5.1%, illustrating diminishing returns on ad spend. B2B portals, by contrast, monetize through membership fees and escrow, yielding steadier cash flows and lower churn. Partnerships with Amazon and Newegg extend Taiwan-origin listings into North America, while alliances with Southeast Asian sites such as Tiki.vn widen reach without heavy warehouse investment.
By Device Type (B2C): Mobile Dominance Reshapes Interface Design
The Taiwan e-commerce market recorded 55.12% of 2025 GMV via smartphones, topping desktops and posting the quickest 7.27% CAGR outlook. Screen size constraints once capped high-ticket purchases, yet better zoom, AR try-ons, and secure biometric pay flows now blur device divides. 5G coverage above 40% fuels HD live-video demos that cut return rates, a perk especially valuable for fashion and cosmetics sellers.
Desktop surfing, however, still anchors large B2B orders where buyers compare spec sheets across multiple tabs. Convenience features for older shoppers, like voice navigation and enlarged icons, add stickiness for older demographics as Taiwan becomes a super-aged society in 2025. Smart speakers and wearables remain nascent, but rising chronic-disease care needs could drive voice-first reorder flows within the wider Taiwan e-commerce market.


By Payment Method (B2C): Digital Wallets Gain Share Amid Regulatory Unbundling
Cards held 40.16% of transaction value in 2025, yet digital wallets are growing faster at an 8.12% CAGR, reflecting regulatory moves to decouple wallets from transit rails. LINE Pay processed NTD 681 billion (USD 22.7 billion) in 2023 and surpassed 12.7 million users, rapidly scaling network effects. The July 2025 ruling that let LINE Pay Money operate standalone lowered entry barriers for smaller merchants and pushed competing services to deepen rewards.
Buy-now-pay-later usage inches up among Gen Z, though regulators watch credit transparency closely. iPass Money spun out its own app in January 2026, activating 7.2 million users overnight and signaling a two-horse wallet race. Bank transfers and convenience-store kiosks still crowd rural checkout flows, but subsidy-backed wallet cashback campaigns are steadily converting cash-on-delivery holdouts.
By Product Category (B2C): Food and Beverages Outpace Consumer Electronics
Consumer electronics retained 28.49% share in 2025, underlining the Taiwan e-commerce market size leadership of tech SKUs. Yet growth rates are flattening as replacement cycles elongate and cross-border price gaps compress. The standout mover is food and beverages, forecast to rise 6.89% annually through 2031, helped by Uber Eats logging 1 billion cumulative rides and expanding fresh grocery picks.
Meal-kit subscriptions and 30-minute cold-chain delivery bring convenience to dual-income households, while aging shoppers rely on replenishment schedules for vitamins and staples. Beauty, pet supplies, and health supplements also ride demographic tailwinds, leveraging influencer trust and auto-ship programs to deepen lifetime value. Augmented-reality room planners aim to boost furniture conversion, though bulky freight costs still dampen mass adoption.
Geography Analysis
Taipei, New Taipei, Taoyuan, and Taichung form the logistics backbone of the Taiwan e-commerce market, hosting major sorting centers and offering same-day drop windows across dense metro pockets. October 2025 retail data showed e-commerce and mail-order sales up 3.7% year-on-year, outpacing flat store-based growth. GDP is projected to ease to 3.0% in 2026 as external demand cools, yet domestic online spend remains resilient due to convenience and promotional pull.
Rural counties lag on fulfillment density and digital-wallet acceptance, inviting public-private pilots that bundle subsidies with basic delivery services. Labor shortfalls loom large as the working-age cohort shrinks by roughly 200,000 per year; warehouse operators now hire retirees or deploy automated guided vehicles to sustain output. Secondary ports in Kaohsiung and Tainan attract new cold-chain investment, while CBRE tracks rising rents for Class A sheds thanks to grocery delivery demand.
Cross-strait tensions inject systemic risk. Around USD 2.45 trillion in goods sailed through the Taiwan Strait in 2022, and analysts warn sanctions could shave 2.5% off GDP while disrupting U.S. dollar settlement rails critical to cross-border carts. Platforms therefore split inventory between on-island hubs and forward depots in Southeast Asia to hedge shipping chokepoints, a tactic that adds cost but boosts resilience.
Competitive Landscape
The Taiwan e-commerce market exhibits moderate concentration, led by Shopee, Momo, and PChome, yet niche verticals such as handmade goods and SaaS storefronts keep fragmentation alive. Shopee lifted regional GMV 28.4% year-on-year to USD 32.2 billion in Q3 2025, converting AI tools into higher seller productivity. Momo’s revenue slip and PChome’s 2024 net loss highlight how delivery-wage inflation and price wars crimp profit pools.
Regulators blocked Uber’s USD 950 million bid for foodpanda, flagging a 90% combined share in meal delivery, which underscores official vigilance against platform monopolies. The decision leaves grocery and hot-food fulfillment contested, with pandamart running more than 1,000 dark stores stocking 10,000 SKUs. Smaller challengers such as Pinkoi and 91APP differentiate via design-centric assortments and white-label tech stacks, steering clear of the price-race melee.
LINE’s ecosystem blends commerce, messaging, and finance. LINE Bank holds 2.01 million deposit accounts, while LINE Shopping channels traffic to 1,000+ global brands, raising switching costs for its 22 million monthly users. Compliance heft, including ISO 27001 data centers and in-house legal teams, serves as a moat, limiting fresh entrants. Age-tech and chronic-condition subscription services emerge as the next growth pocket, supported by the NTD 3.6 trillion (USD 120 billion) silver-economy forecast under Long-Term Care 3.0.
Taiwan E-Commerce Industry Leaders
Shopee Pte. Ltd.
PChome Online
Momo Com Inc
Ruten Co. Ltd.
BigGo Co. Ltd.
- *Disclaimer: Major Players sorted in no particular order

Recent Industry Developments
- January 2026: iPass Corporation launched a standalone iPass Money app, activating 7.2 million wallet users overnight.
- December 2025: LINE Pay Taiwan rolled out LINE Pay Money as an independent e-payment service.
- July 2025: Uber Eats Taiwan surpassed 1 billion cumulative trips, citing 20% YoY growth in fresh-food orders.
- March 2025: Uber terminated its proposed acquisition of foodpanda Taiwan, paying a USD 250 million break-fee.


Research Methodology Framework and Report Scope
Market Definitions and Key Coverage
Our study defines the Taiwan e-commerce market as all business-to-consumer and business-to-business digital transactions finalized by domestic or cross-border shoppers on websites or apps that arrange delivery within Taiwan. Transactions mediated only by social media pages without a cart function are excluded.
Scope exclusion: Pure online food-service and ride-hailing revenues sit outside this assessment.
Segmentation Overview
- By Business Model
- B2C
- B2B
- By Device Type (B2C)
- Smartphone / Mobile
- Desktop and Laptop
- Other Device Types
- By Payment Method (B2C)
- Credit and Debit Cards
- Digital Wallets
- Buy Now Pay Later (BNPL)
- Other Payment Methodss
- By Product Category (B2C)
- Beauty and Personal Care
- Consumer Electronics
- Fashion and Apparel
- Food and Beverages
- Furniture and Home
- Toys, DIY and Media
- Other Product Categories
Detailed Research Methodology and Data Validation
Primary Research
Mordor analysts interviewed marketplace operators, third-party logistics managers, fintech enablers, and retail brand e-commerce heads across Taipei, Taichung, and Kaohsiung. These conversations validated consumer fee structures, live-stream conversion ratios, and average selling prices, which secondary data seldom reveals in full.
Desk Research
We began with public datasets from the Ministry of Economic Affairs, Taiwan Network Information Center, Directorate-General of Budget & Statistics, and customs shipment dashboards, which let us profile internet access, card spending, and import flows. Trade association white papers (Commerce Development Research Institute, E-Commerce Association Taiwan) and academic journals on last-mile logistics then filled structural gaps. Company filings, investor decks, and tier-one news feeds accessed through D&B Hoovers and Dow Jones Factiva supplied price points and promotional intensity. The sources cited above are illustrative; many additional documents were reviewed to cross-check trends and numeric signals.
Market-Sizing & Forecasting
We employ a top-down build that starts with Ministry-reported retail sales, strips brick-and-mortar lines, and then layers channel-specific penetration, cross-border leakage, and repeat purchase frequency. Select bottom-up checks, vendor gross merchandise value samples, and parcel volume audits anchor the totals. Key variables tracked each year include smartphone penetration, median delivery fee, card-not-present fraud loss rate, live commerce share, and average parcel weight. Forecasts to 2030 rely on multivariate regression that blends these drivers with macro indicators, while expert feedback guides scenario tweaks when regulation or logistics capacity shifts. Any data void in supplier roll-ups is bridged by applying sampled ASP by category to verified parcel counts before reconciling with national accounts.
Data Validation & Update Cycle
Outputs undergo variance scans against independent metrics, peer review by a second analyst, and management sign-off. The model refreshes annually; interim updates trigger when policy, currency, or technology shocks move the underlying drivers.
Why Mordor's Taiwan E-Commerce Baseline Commands Confidence
Published figures differ because firms pick dissimilar channel mixes, apply unique exchange rate dates, or roll forward historic growth without checking present parcel tallies.
Key gap drivers include whether cross-border imports are fully counted, if food delivery GMV is blended in, the cadence of data refresh, and the way local currency is translated amid NT$ swings. Mordor's study states a 2025 market value of USD 49.93 billion, built on clearly disclosed scope and annually refreshed inputs, whereas other publishers vary on those levers.
Benchmark comparison
| Market Size | Anonymized source | Primary gap driver |
|---|---|---|
| USD 49.93 bn (2025) | Mordor Intelligence | - |
| USD 47.60 bn (2024) | Global Consultancy A | Excludes B2B and uses fixed 2023 exchange rate |
| USD 107.20 bn (2024) | Industry Journal B | Adds food-service delivery and crowd-funded sales |
| USD 28.50 bn (2024) | Regional Consultancy C | Counts only domestic B2C websites, no cross-border |
In short, buyers gain a balanced, transparent baseline from Mordor because our numbers stem from openly defined scope, mixed-method data capture, and repeatable calculations clients can trace and replicate.


Key Questions Answered in the Report
What is the current value of the Taiwan e-commerce market in 2026?
It stands at USD 53.15 billion, on track to reach USD 71.61 billion by 2031.
Which device drives the most online sales in Taiwan?
Smartphones command 55.12% of transaction value and hold the fastest 7.27% CAGR outlook.
How fast are digital wallets growing in Taiwan?
Wallet GMV is expanding at an 8.12% CAGR as regulatory changes spur broader acceptance.
Which product group is expanding quickest online?
Food and beverages leads with a 6.89% CAGR, propelled by rapid grocery-delivery adoption.
Why did regulators block Uber's bid for foodpanda Taiwan?
The Fair Trade Commission cited a combined meal-delivery share above 90%, risking market monopoly.
How is aging demographics shaping online retail?
Subscription models and voice-enabled ordering are scaling to serve a population where 20.06% are aged 65+.
Page last updated on:


