
Synbiotic Products Market Size and Share
Market Overview
| Study Period | 2021 - 2031 |
|---|---|
| Market Size (2026) | USD 2.21 Billion |
| Market Size (2031) | USD 3.35 Billion |
| Growth Rate (2026 - 2031) | 8.73 % |
| Fastest Growing Market | Asia Pacific |
| Largest Market | Europe |
| Market Concentration | Low |
Major Players
*Disclaimer: Major Players sorted in no particular order Image © Mordor Intelligence. Reuse requires attribution under CC BY 4.0. |
|
Synbiotic Products Market Analysis by Mordor Intelligence
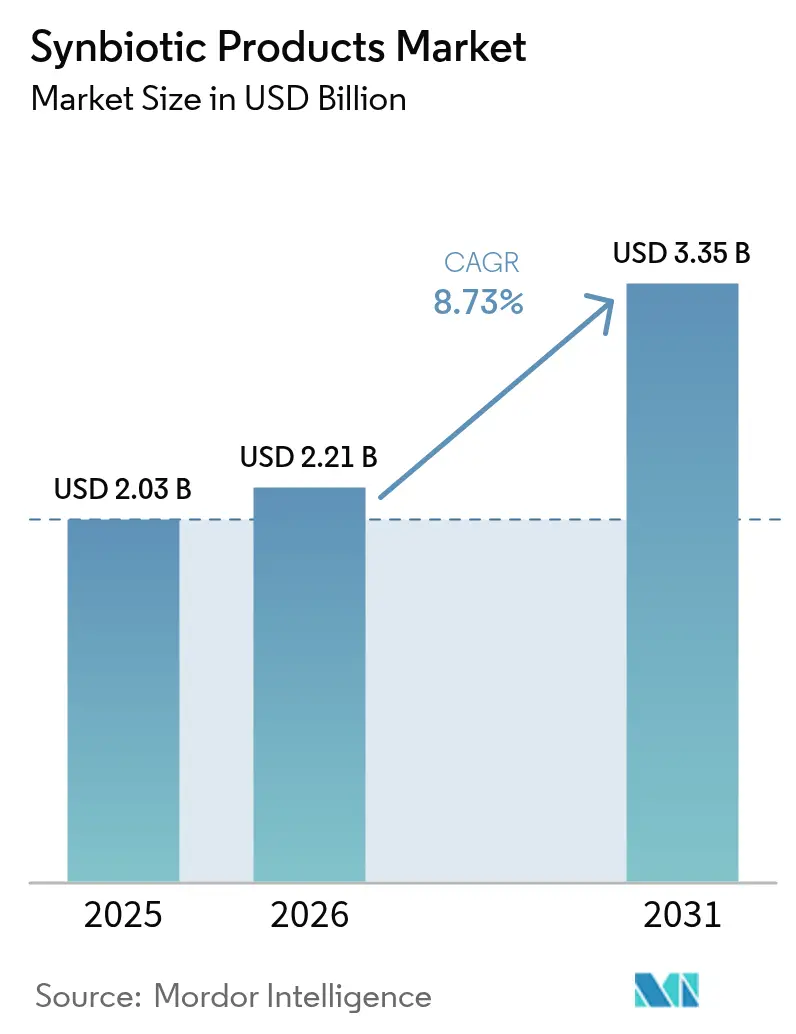
Synbiotic products market size in 2026 is estimated at USD 2.21 billion, growing from 2025 value of USD 2.03 billion with 2031 projections showing USD 3.35 billion, growing at 8.73% CAGR over 2026-2031. This growth trajectory reflects the convergence of consumer health awareness, regulatory clarity, and technological innovations that are reshaping how probiotics and prebiotics are combined for enhanced therapeutic efficacy. Synbiotics products, a combination of prebiotics and probiotics, are a part of functional foods and beverages and are known for improving gut functionality, along with other benefits, including improving mental, digestive, and immune functions and heart health. Furthermore, increased fortification with synbiotics to offer nutritional and health benefits by the leading players in the market has boosted the market's growth. In addition, apart from the food and beverage sector, the growing demand for synbiotic products from the dietary supplements and animal feed sectors is further driving the global market with growth. However, the market is facing challenges such as high manufacturing costs of synbiotic products that are restraining its market space.
Key Report Takeaways
- By product type, the dietary supplements segment led with a 54.66% share of the synbiotics products market in 2025 and is growing at a 9.18% CAGR through 2031.
- By application, the digestive health segment commanded a 44.81% market share in 2025, while immunity enhancement is projected to expand at a 10.12% CAGR to 2031.
- By end-user, adults held a 60.11% share in 2025; the geriatric segment is advancing at a 10.23% CAGR over the forecast period.
- By distribution channel, pharmacies and health stores captured a 34.71% market share in 2025, whereas online retail is the fastest-rising route with a 8.79% CAGR to 2031.
- By geography, Europe accounted for 31.62% market share in 2025; Asia-Pacific leads growth at a 9.41% CAGR between 2026-2031.
Note: Market size and forecast figures in this report are generated using Mordor Intelligence’s proprietary estimation framework, updated with the latest available data and insights as of 2026.
Global Synbiotic Products Market Trends and Insights
Drivers Impact Analysis*
| Driver | (~) % Impact on CAGR Forecast | Geographic Relevance | Impact Timeline |
|---|---|---|---|
| Rising Health Awareness Among Consumers Boosts Product Consumption Rate | +1.8% | Global, with strongest impact in North America and Europe | Medium term (2-4 years) |
| Supportive Regulatory Frameworks Encourage Synbiotic Market Expansion | +1.5% | Europe and North America, expanding to APAC | Long term (≥ 4 years) |
| Increasing Prevalence Of Digestive Disorders Drives Market Growth Globally | +1.2% | Global, particularly aging populations in developed markets | Long term (≥ 4 years) |
| Expanding Online Retail Channels Boost Product Accessibility And Sales | +1.0% | Global, with accelerated adoption in APAC | Short term (≤ 2 years) |
| Surging Popularity Of Clean Label Products Enhances Market Demand | +0.9% | North America and Europe, spreading to urban APAC | Medium term (2-4 years) |
| Advancements In Probiotic And Prebiotic Technologies Encourage Product Innovation | +0.7% | Global, led by innovation hubs in US, EU, and Japan | Long term (≥ 4 years) |
| Source: Mordor Intelligence | |||
Rising Health Awareness Among Consumers Boosts Product Consumption Rate
Growing health awareness has expanded from basic nutrition to include gut microbiome health, driving sustained demand for synbiotic products across consumer segments. This shift in consumer understanding influences purchasing patterns, as individuals increasingly opt for products offering multiple health benefits despite higher prices. The market expansion includes younger consumers incorporating synbiotics into their preventive health routines, reflecting a broader demographic adoption of these products. Consumer preferences for personalized nutrition have prompted companies to develop condition-specific formulations, with market research data indicating strong growth potential in targeted synbiotic solutions. The trend demonstrates a fundamental change in how consumers approach their digestive and overall health, leading to increased investment in research and development of advanced synbiotic products.
Supportive Regulatory Frameworks Encourage Synbiotic Market Expansion
Regulatory harmonization efforts are reducing market entry barriers and enabling global product standardization, particularly following EFSA's updated guidelines on microorganism safety assessments. The European Union's[1]European Food Safety Authority, “Qualified Presumption of Safety List 2024 Update,” efsa.europa.eu Qualified Presumption of Safety list expanded in 2023 to include additional microbial strains, streamlining approval processes for synbiotic products containing these organisms. The FDA's evolving stance on live biotherapeutic products provides clearer pathways for companies developing next-generation probiotics with enhanced therapeutic claims. International Scientific Association for Probiotics and Prebiotics initiatives are fostering global regulatory convergence, reducing compliance costs for multinational companies. These frameworks particularly benefit smaller companies that previously faced prohibitive regulatory expenses. The trend toward science-based regulations rewards companies investing in clinical research, creating competitive advantages for evidence-backed products over generic formulations.
Increasing Prevalence of Digestive Disorders Drives Market Growth Globally
The increasing prevalence of inflammatory bowel diseases, irritable bowel syndrome, and antibiotic-associated dysbiosis is expanding the therapeutic synbiotics market beyond wellness applications. Medical practitioners now recommend synbiotics as complementary treatments, establishing their role in clinical practice. The global aging population experiences higher rates of digestive disorders, creating consistent demand for gut health solutions. The widespread use of antibiotics in healthcare and agriculture has led to significant microbiome disruption, increasing the need for restorative products. This clinical validation has prompted pharmaceutical companies to develop prescription-grade synbiotic formulations, extending the market beyond traditional dietary supplements. The integration of synbiotics into medical protocols has created opportunities for research and development of targeted formulations. Healthcare providers are conducting clinical trials to establish efficacy in treating specific conditions, while manufacturers are investing in advanced delivery systems to enhance therapeutic outcomes. The growing body of scientific evidence supporting synbiotics' role in gut health management continues to strengthen their position in both preventive and therapeutic applications.
Surging Popularity of Clean Label Products Enhances Market Demand
The synbiotics industry is experiencing increased reformulation efforts due to consumer demand for transparency and natural ingredients. Companies are removing artificial preservatives and synthetic additives from their products to meet evolving consumer preferences. This shift aligns with growing consumer skepticism toward processed foods and pharmaceutical products, creating significant market opportunities for natural health alternatives. The clean label requirements have accelerated technological advancements in stabilization and preservation methods, specifically in encapsulation and freeze-drying technologies that preserve product effectiveness without artificial additives. Millennial and Gen Z consumers, who consistently demonstrate strong preferences for ingredient transparency and environmental sustainability, are driving this transformation in the market. In response to these changing consumer demands, companies are developing comprehensive ranges of organic and non-GMO formulations, despite increased production costs and technical challenges. This market evolution has led to clear segmentation between premium clean-label products and conventional formulations, allowing companies to implement effective price differentiation strategies across their product portfolios.
Restraints Impact Analysis*
| Restraint | (~) % Impact on CAGR Forecast | Geographic Relevance | Impact Timeline |
|---|---|---|---|
| High Production Costs Limit Accessibility In Price-Sensitive Markets | -1.2% | Emerging markets in APAC, Latin America, and Africa | Medium term (2-4 years) |
| Stringent Regulations Affect Product Approval And Market Entry | -0.8% | Global, particularly strict in EU and North America | Long term (≥ 4 years) |
| Lack of Consumer Awareness Restricts Market Growth Globally | -0.6% | Rural and developing markets globally | Medium term (2-4 years) |
| Storage And Transportation Challenges Increase Operational Burden Significantly | -0.5% | Global, with acute impact in tropical and remote regions | Short term (≤ 2 years) |
| Source: Mordor Intelligence | |||
High Production Costs Limit Accessibility In Price-Sensitive Markets
The manufacturing of synbiotics requires specialized fermentation facilities, cold chain infrastructure, and quality control systems, creating significant barriers to market entry. The fermentation facilities must maintain precise temperature controls, pH levels, and sterile conditions throughout the production process. Production costs increase substantially for multi-strain formulations and encapsulated products due to additional processing steps and manufacturing complexity. The complexity stems from maintaining strain viability, preventing cross-contamination, and ensuring consistent product quality. Small companies face higher costs due to limited economies of scale, which creates competitive disadvantages against established manufacturers with integrated production capabilities. In emerging markets, price sensitivity restricts adoption as premium pricing makes products unaffordable for middle-income consumers. The high prices reflect the substantial investments in research, development, and manufacturing infrastructure. While companies develop simplified formulations and alternative production methods to reduce costs, they must maintain product efficacy standards. These standards include ensuring proper strain selection, optimal dosage levels, and stability throughout the product's shelf life.
Lack of Consumer Awareness Restricts Market Growth Globally
Consumer understanding of synbiotics remains limited despite growing regulatory support, creating market barriers that constrain adoption rates across key demographic segments. The United States Department of Agriculture's National Program 306 Action Plan (2025-2029) acknowledges the need for enhanced consumer education regarding bioactive ingredients and health-promoting foods, including synbiotics, to maximize their potential in addressing food insecurity and nutritional deficiencies. Government health agencies recognize that complex scientific terminology and mechanisms of action create communication challenges that prevent consumers from understanding product benefits and appropriate usage. The European Food Safety Authority's emphasis on clear labeling requirements reflects regulatory awareness that consumer confusion about probiotic strains, prebiotic substrates, and synergistic effects limits market penetration. India's Department of Biotechnology[2]Department of Biotechnology, Ministry of Science and Technology, Government of India, "Annual Report 2024-25", www.dbtindia.gov.in Annual Report 2024-25 highlights ongoing research initiatives to develop synbiotic blends for obesity and metabolic disorders, but notes that public awareness campaigns are necessary to translate scientific advances into consumer adoption. The awareness gap particularly affects rural and developing market segments, where healthcare infrastructure limitations reduce exposure to professional recommendations that typically drive initial product trials.
*Our forecasts treat driver/restraint impacts as directional, not additive. The impact forecasts reflect baseline growth, mix effects, and variable interactions.
Segment Analysis
By Product Type: Supplements Lead Innovation Drive
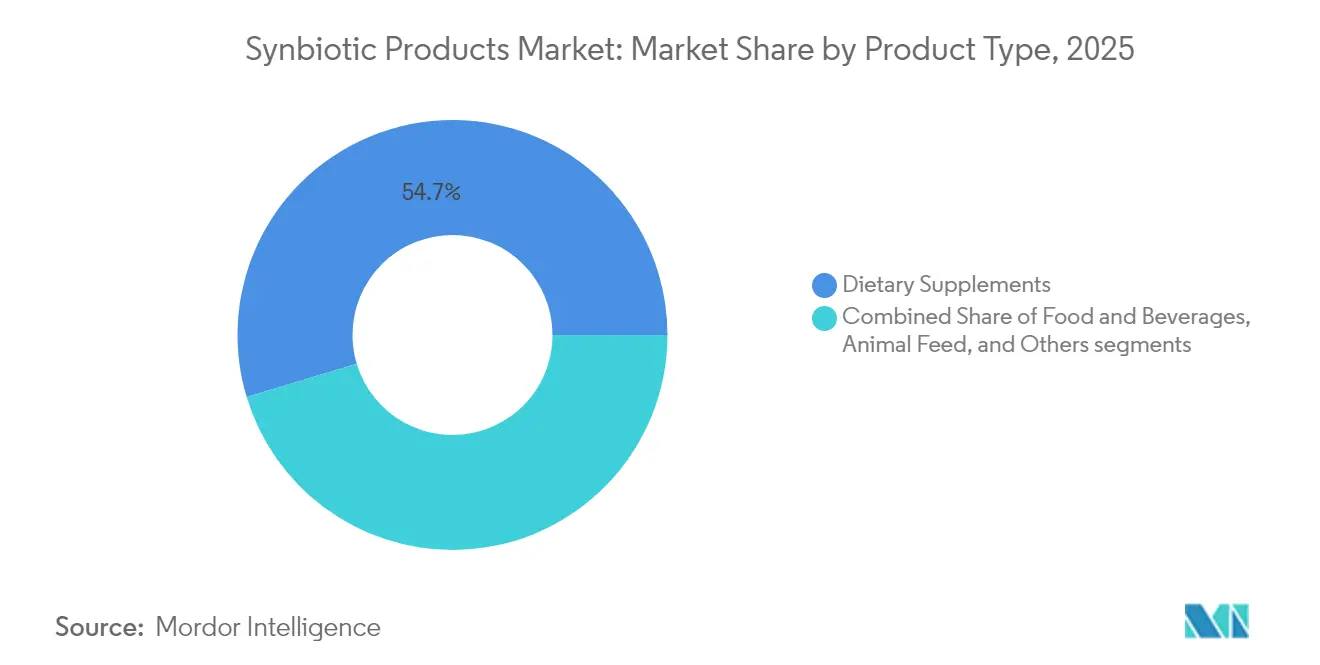
Dietary supplements captured 54.66% market share in 2025 while simultaneously driving the fastest growth at 9.18% CAGR through 2031, reflecting regulatory advantages that enable more flexible formulation and health claim positioning compared to food applications. The supplement format allows for higher probiotic concentrations and specialized delivery systems that are difficult to achieve in food matrices without compromising taste or texture. Gummies are emerging as a high-growth subsegment, particularly for pediatric and geriatric populations who prefer chewable formats over traditional pills. As the consumption of supplements is increasing, the demand for synbiotic supplements is also increasing. According to the Statistisches Bundesamt data from 2024, the production volume of food supplements in Germany was 237.02 thousand tons in 2024.
Food and beverage applications face regulatory constraints that limit health claims and require extensive safety testing for novel ingredients, creating slower approval timelines despite strong consumer interest in functional foods. Dairy products remain the primary food vehicle for synbiotics, though plant-based alternatives are gaining traction as companies develop formulations compatible with non-dairy matrices. The segment benefits from less stringent regulatory requirements compared to human applications, enabling faster product development cycles and market entry.



By Application: Immunity Enhancement Outpaces Traditional Uses
Digestive health maintains dominance with 44.81% market share in 2025, reflecting the foundational role of gut health in synbiotic applications and established consumer understanding of probiotic benefits for gastrointestinal wellness. However, immunity enhancement emerges as the fastest-growing application at 10.12% CAGR, driven by post-pandemic health priorities and scientific evidence linking gut microbiome diversity to immune system function.
Mental health applications represent an emerging opportunity, with research exploring the gut-brain axis and its implications for mood disorders and cognitive function. Women's health applications are gaining momentum, exemplified by Danone's 2024 launch of Almimama, a synbiotic supplement specifically formulated for breastfeeding mothers to reduce mastitis incidence. Metabolic health applications targeting obesity and diabetes are expanding as research demonstrates the role of gut microbiota in glucose metabolism and weight management.
By End-User: Geriatric Segment Drives Growth Acceleration
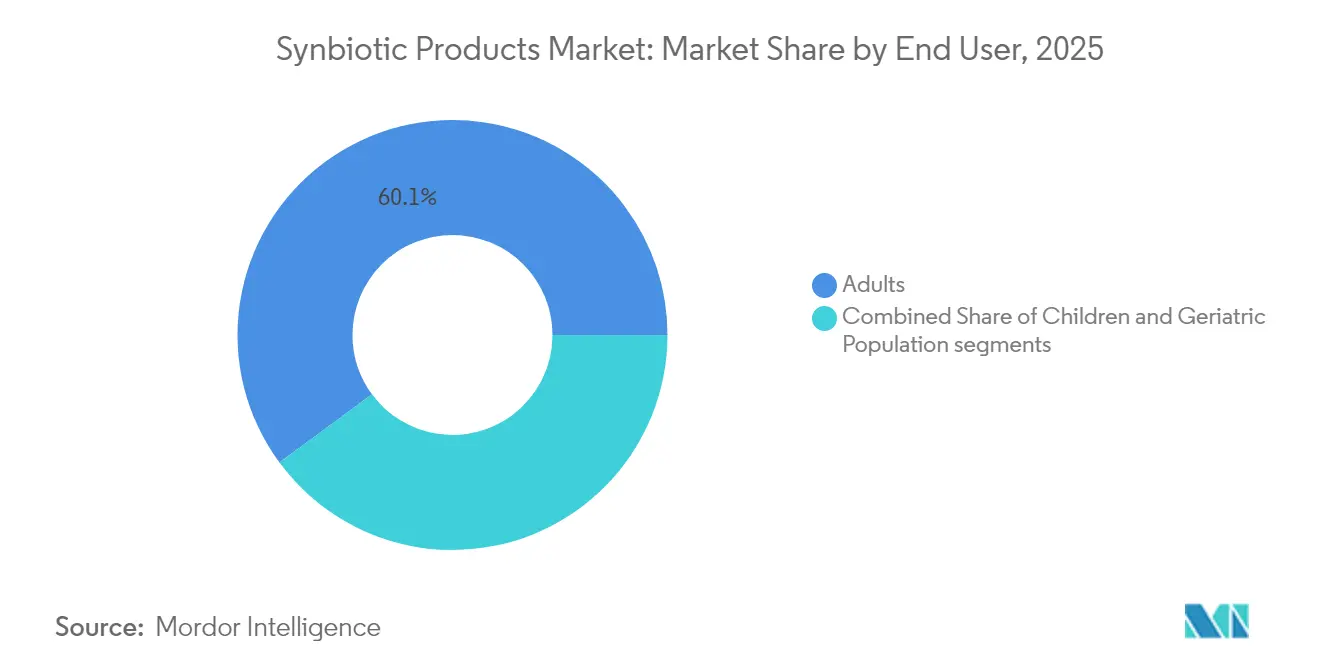
Adults represent 60.11% market share in 2025, reflecting the broad appeal of synbiotic products across working-age populations concerned with preventive health and wellness optimization. The adult segment benefits from higher disposable income and health awareness compared to other demographics, enabling premium product positioning and subscription-based purchasing models. However, the geriatric population exhibits the fastest growth at 10.23% CAGR, driven by age-related digestive health challenges and increased healthcare spending on preventive interventions.
Children represent a specialized but important segment, with products requiring careful formulation to ensure safety and palatability while meeting regulatory requirements for pediatric populations. The segment benefits from parental willingness to invest in children's health, though regulatory constraints limit health claims and require extensive safety testing. formulations for infants and chewable options for older children.
By Distribution Channel: Digital Transformation Accelerates
Pharmacies and health stores hold a 34.71% market share in 2025, driven by healthcare professional recommendations and consumer trust in medical retail environments. These channels provide credibility for therapeutic claims and allow customers to consult with trained staff for product recommendations based on specific health conditions. Online retail stores demonstrate the highest growth rate at 8.79% CAGR, supported by convenience, competitive pricing, and comprehensive product information that helps consumers make informed decisions. The digital platform enables manufacturers to establish direct relationships with consumers, which traditional retail channels cannot offer.
Supermarkets and hypermarkets remain important distributors of food-based synbiotic products, despite lower growth rates compared to specialized channels, due to price competition and limited product differentiation. These retailers benefit from high customer traffic and impulse purchases, particularly for functional foods placed alongside regular grocery items. E-commerce companies are developing cold chain logistics capabilities to ensure product stability during delivery, resolving a technical barrier that previously restricted online sales of probiotics. Across all distribution channels, subscription services are increasing in popularity, providing stable revenue for manufacturers while offering convenience to consumers who need regular supplements.
Geography Analysis
Europe holds a dominant 31.62% market share in 2025, supported by established regulations and high consumer acceptance. Germany maintains its position as the leading European market, backed by its pharmaceutical heritage and consumers' focus on preventive healthcare. The region's aging demographic sustains demand for digestive health and immune support products. While Brexit has introduced regulatory challenges for UK companies, market growth persists as businesses adapt to new approval requirements and maintain European supply chain connections.
The Asia-Pacific region demonstrates the highest growth rate at 9.41% CAGR, driven by economic growth, regulatory improvements, and increasing health consciousness. Australia and South Korea are strengthening their domestic manufacturing base to serve growing local demand and reduce dependence on imports. North America represents an established market with comprehensive regulatory structures that support innovation while ensuring consumer safety. The United States leads in advanced probiotic research, with investments in synthetic biology and precision fermentation. The FDA's guidelines for live biotherapeutic products establish standards for pharmaceutical-grade formulations while maintaining safety protocols.
South America and Middle East, and Africa are witnessing significant growth in consumer awareness about gut health and the benefits of synbiotic supplements. Market participants are introducing new products through partnerships, expansions, and strategic collaborations to strengthen their market presence. Companies are investing in research and development to create innovative synbiotic formulations that cater to specific health needs. In October 2023, Clasado Biosciences and Probi AB collaborated to develop two synbiotic combinations targeting gastrointestinal and digestive health, demonstrating the industry's commitment to advancing digestive wellness solutions.


Regulatory Landscape
Synbiotic products are regulated through existing food supplement and food rules rather than a dedicated synbiotic framework in most markets, which keeps definitions and labeling practices uneven across borders. In the European Union, synbiotic supplements commonly fall under the Food Supplements Directive (2002/46/EC), with microorganism safety assessments supported by the European Food Safety Authority (EFSA) Qualified Presumption of Safety (QPS) approach, including the 2024 QPS list update referenced in the report context. Still, EFSA health-claim substantiation requirements and the lack of a harmonized definition for the term synbiotic create practical constraints for pan-EU claim and label standardization, and Italy stands out as a member state with more explicit handling of the term.
In the United States, synbiotic components used in supplements and foods typically rely on ingredient safety pathways such as FDA Generally Recognized as Safe (GRAS) determinations and GRAS Notices, while more therapeutic positioning intersects with FDA frameworks for live biotherapeutic products. At the international level, Codex Alimentarius work on guidelines for probiotics acts as a key harmonization anchor, since it can influence future national guidance on terminology, identity, and quality expectations for probiotic and synbiotic-style products sold across multiple geographies.
Competitive Landscape
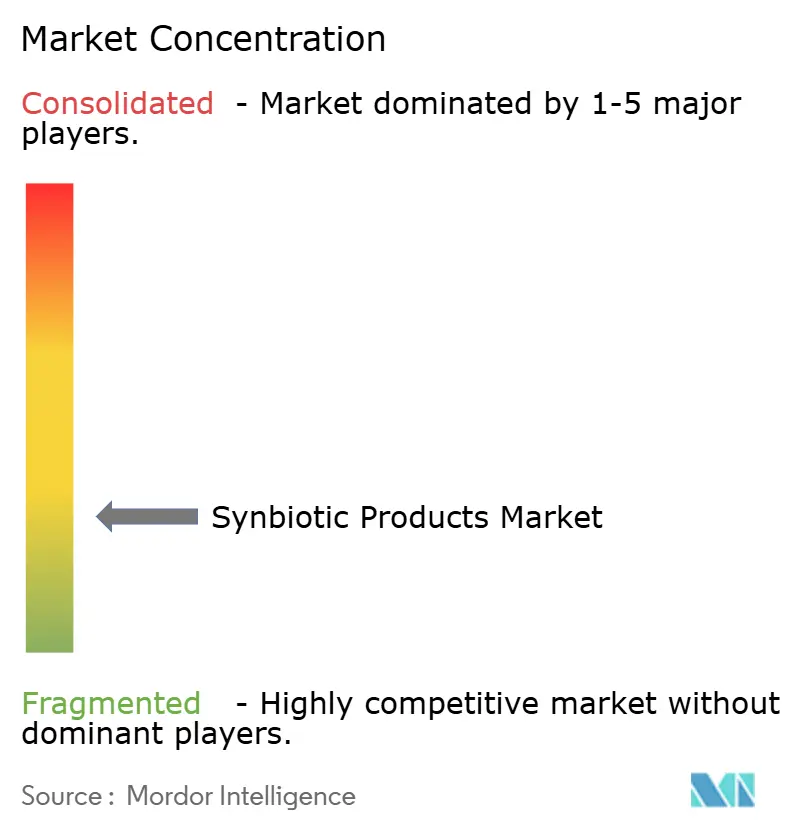
The global synbiotic products market is fragmented, presenting growth opportunities for both established companies and new entrants through product innovation and market positioning. This fragmentation allows companies to capture market share through differentiated strategies and targeted approaches to specific consumer segments.
Major players are leveraging vertical integration to ensure quality control and cost efficiency, while smaller firms are concentrating on niche applications and direct-to-consumer channels. Advanced technologies such as precision fermentation, encapsulation techniques, and personalized nutrition systems are redefining the competitive landscape. These advancements are driving the creation of differentiated products and helping companies establish a stronger foothold in the market.
Companies are adopting platform-based business models to expand their scientific capabilities across product categories and regions. This strategic shift enables broader market reach and enhanced product development capabilities. New market entrants, such as Wonder Veggies, are developing novel product categories by integrating probiotics into fresh produce, offering alternatives to traditional supplement and dairy formats.
Synbiotic Products Industry Leaders
-
Yakult Honsha Co., Ltd.
-
Danone S.A.
-
Probiotical S.p.A.
-
United Natural Foods, Inc.
-
Kerry Group plc
- *Disclaimer: Major Players sorted in no particular order

Market Opportunities and Future Outlook
White space is opening around precision, strain-specific synbiotics that move beyond generic combinations toward clinically substantiated pairings and condition-focused use cases, particularly in digestive health, immunity enhancement, and life-stage nutrition where supplement formats already dominate (dietary supplements held 54.66% share in 2025 in this report). Ingredient and platform players are investing in tools and partnerships that speed pairing selection and improve how efficacy is communicated. In June 2026, Tate and Lyle collaborated with APC Microbiome Ireland to introduce a Synbiotic Potential Score to systematically match prebiotic fibers with probiotic strains, supporting more repeatable synbiotic formulation and product differentiation.
Opportunities also sit in formulation and delivery engineering that expands synbiotics into non-dairy and plant-based matrices and into new channels where stability is a barrier, including ambient beverages and e-commerce fulfillment. Portfolio consolidation and capability expansion in prebiotic fibers further supports innovation pipelines. In June 2026, Ingredion acquired NutriLeads Benicaros, an upcycled prebiotic fiber with regulatory approval in Brazil and a pending EU novel food status, which strengthens access to differentiated prebiotic inputs for synbiotic concepts. Venture funding is also backing scalable, clinically validated inputs for B2B commercialization, illustrated by Myota raising USD 4.5 million in July 2026 to expand its prebiotic fiber business and sales footprint in the US and Europe.
Recent Industry Developments
- June 2026: NurtureBio partnered with Lallemand Health Solutions to commercialize a breast milk-inspired synbiotic supplement aimed at infants and toddlers. The collaboration combines complementary probiotic and prebiotic capabilities to target early-life gut health, reinforcing the market shift toward life-stage specific synbiotic formulations with clearer product positioning.
- June 2025: Danone acquired The Akkermansia Company to strengthen its biotics portfolio around the strain Akkermansia muciniphila MucT. The deal broadened Danone's access to next-generation biotics development for gut health adjacencies, raising competitive pressure for clinically differentiated synbiotic and microbiome-linked offerings.
- May 2024: DSM-Firmenich and Lallemand Health Solutions formed a partnership to develop synbiotic solutions for early life nutrition, combining human milk oligosaccharides (HMOs) with probiotic strains. The partnership elevated synbiotics in infant nutrition innovation pipelines and supported more specialized ingredient systems designed for safety, efficacy, and formulation performance.


Research Methodology Framework and Report Scope
Market Definition and Coverage
For this study, the synbiotic products market is counted as revenue from finished products that combine probiotics and prebiotics together and are sold through food, supplement, and feed channels, across the regions covered.
Scope exclusions: We exclude standalone probiotics, standalone prebiotics, and broader digestive health products that do not contain a defined synbiotic combination.
Segmentation Overview
-
By Product Type
-
Food and Beverage
- Dairy
- Beverages
- Infant Foods
- Others
-
Dietary Supplements
- Capsules
- Tablets
- Powders
- Gummies
- Others
- Animal Feed
- Others
-
Food and Beverage
-
By Application
- Digestive Health
- Immunity Enhancement
- Other Applications
-
By End-User
- Adults
- Children
- Geriatric Population
-
By Distribution Channel
- Pharmacies/Health Stores
- Supermarkets/Hypermarkets
- Online Retail Stores
- Other Distribution Channels
-
By Geography
-
North America
- United States
- Canada
- Mexico
- Rest of North America
-
Europe
- Germany
- United Kingdom
- Italy
- France
- Spain
- Rest of Europe
-
Asia-Pacific
- China
- India
- Japan
- Australia
- Rest of Asia-Pacific
-
South America
- Brazil
- Argentina
- Rest of South America
-
Middle East and Africa
- South Africa
- Saudi Arabia
- United Arab Emirates
- Rest of Middle East and Africa
-
North America
Data Sources, Market Sizing, and Validation
Desk Research
Desk research was used to set the groundwork for how synbiotic products are classified, where they are sold, and what demand signals move with them. We relied on public references such as FDA and NIH pages for dietary supplement and ingredient context, USDA resources for food category definitions, EFSA publications for Europe-facing claims guidance, and WHO materials for general gut health and nutrition framing. We also reviewed items like company annual reports, investor presentations, and reputable press coverage to understand product launches and pricing posture.
To make the sizing model more consistent across regions, we also used paid subscriptions for company financials and intelligence, patent databases, and an import and export shipment-level database when trade flows helped explain supply and availability patterns. The sources listed here are illustrative, and many other public and paid references were used for data collection, cross-checks, and clarification during the work.
Primary Interviews and Surveys
Primary work focused on interviews and structured surveys with product marketers, ingredient-facing experts, distributors, and retail channel participants, so our assumptions could be checked against how synbiotics are actually formulated and sold. Because this is a global market, inputs were validated across APAC, EMEA, and the Americas to capture differences in label claims, price bands, and channel mix, then to close gaps left by public datasets.
Distribution of primary research fieldwork respondents
| Company type | Respondent position | Region |
|---|---|---|
| Top tier: 37% | CXOs: 15% | APAC: 51% |
| Mid tier: 46% | Functional/Unit leaders: 28% | EMEA: 29% |
| Smaller Players: 17% | Managers: 57% | Americas: 20% |
Market-Sizing & Forecasting
Market sizing was built using a top-down and bottom-up approach, where consumption pools were reconstructed from category-level nutrition and supplement demand signals, then checked against supplier and channel realities. In practice, the top-down side starts from functional food and dietary supplement spending patterns, then applies synbiotic penetration and mix assumptions by region and channel, and translates the result into value using price bands.
To keep the model tied to what buyers see in-market, we used inputs such as synbiotic launch intensity, share of online retail in supplements, dairy and beverage functionalization trends, average pack sizes and serving counts, and ingredient cost pressure that influences pricing. Forecasts were produced using scenario analysis supported by expert consensus on how quickly adoption and price normalization may move, followed by sanity checks using sampled ASP times volume approximations for key channels. Where bottom-up evidence was thin, gaps were handled by using adjacent category ratios, then re-tested through follow-up calls until the assumptions stayed stable.
Data Validation & Update Cycle
Outputs were validated through multiple checks so that outliers were caught early and assumptions were kept realistic. Model totals were compared with independent signals such as category growth rates, trade movement, and observed pricing ranges, then reviewed again by another analyst before sign-off.
The report is refreshed annually, and interim updates are done when material events change pricing, availability, or demand behavior. Before delivery, we run a fresh review pass, re-check any large variances versus the prior edition, and re-contact selected respondents when a key assumption shifts.
Mordor Intelligence's Synbiotic Products Market Size Measured Against Other Published Estimates
Published market sizes for synbiotic products can vary a lot because firms do not always use the same base year, the same currency conversion timing, or the same pricing method for ASPs across food, supplements, and feed. Even when the product definition looks similar, the year that pricing is captured and how inflation and mix shifts are applied can change the final number.
A refresh-led difference also comes from how often assumptions are rechecked against current channel pricing and how strictly adjacent categories are filtered out during validation, which is why the same market can show a wide spread depending on what was updated most recently and what was left as a static input.
Benchmark comparison
| Source | Market Size | Gaps in Research Methodology |
|---|---|---|
| Mordor Intelligence | USD 2.21 B (2026) | |
| Global Consultancy A | USD 1.02 B (2024) | Uses an earlier base year and a shorter forecast window, and its value can skew lower if older price points are carried forward without re-checking current ASP ranges across channels. |
| Industry Publisher B | USD 0.80 B (2024) | Applies a longer-range forecast with a lower growth path and can understate value if food and supplement price mix is simplified and currency conversion is locked to a single timing. |
The table shows that most of the spread is explained by timing choices and how pricing is refreshed across channels, rather than by a totally different idea of what synbiotics are. By keeping the scope limited to true synbiotic combinations and re-validating price bands and mix shifts during updates, Mordor Intelligence keeps the estimate anchored to repeatable inputs that can be checked year over year.


Key Questions Answered in the Report
What is the current size of the synbiotics market?
The global market stands at USD 2.21 billion in 2026 and is forecast to reach USD 3.35 billion by 2031.
Which product segment dominates the synbiotics market?
Dietary supplements led with 54.66% revenue share in 2025 and continue to expand at a 9.18% CAGR.
Why is Asia-Pacific the fastest-growing region?
Policy reforms in China and India, rising disposable income, and new local manufacturing capacity are propelling a 9.41% regional CAGR.
Which distribution channel is growing most rapidly?
Online retail platforms are expanding at a 8.79% CAGR due to convenience, detailed product information, and subscription model popularity.
Page last updated on:


 Your data is secure and never sold or shared.


