Switzerland Data Center Networking Market Size and Share
Market Overview
| Study Period | 2020 - 2031 |
|---|---|
| Forecast Data Period | 2026 - 2031 |
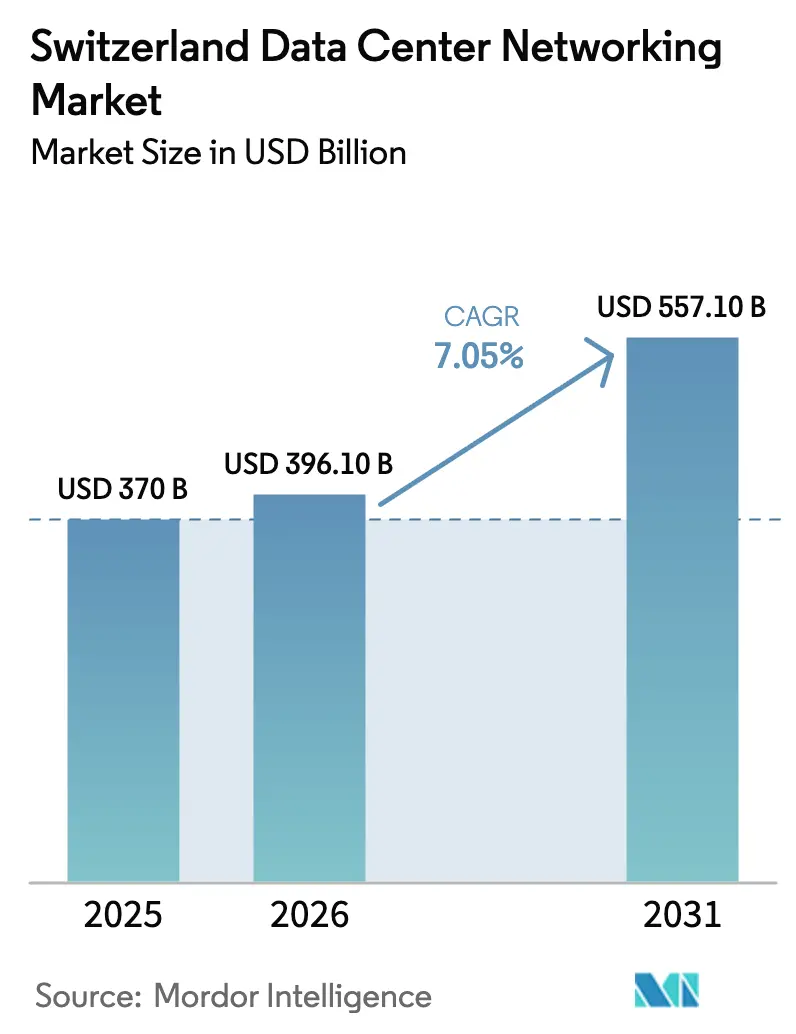
| Base Year Market Size (2025) | USD 370 Billion |
| Market Size (2026) | USD 396.1 Billion |
| Market Size (2031) | USD 557.1 Billion |
| Growth Rate (2026 - 2031) | 7.05% CAGR |
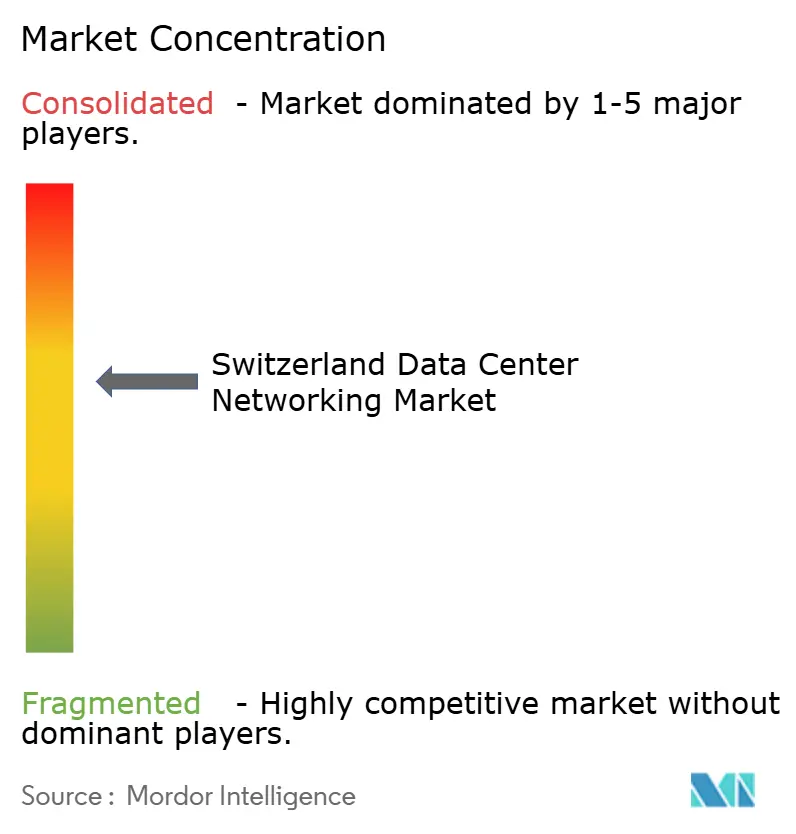
| Market Concentration | Medium |
Major Players *Disclaimer: Major Players sorted in no particular order Image © Mordor Intelligence. Reuse requires attribution under CC BY 4.0. | |
Switzerland Data Center Networking Market Analysis by Mordor Intelligence
The Switzerland data center networking market size in 2026 is estimated at USD 396.1 million, growing from 2025 value of USD 370 million with 2031 projections showing USD 557.1 million, growing at 7.05% CAGR over 2026-2031. Growth is propelled by the country’s data-sovereignty reputation, strict residency rules under the revised Federal Act on Data Protection (revFADP), and a mature IT infrastructure that attracts hyperscale, edge, and colocation investments. Hyperscale cloud providers expanding Swiss footprints, the financial sector’s appetite for micro-second trading latency, and nationwide sustainability targets are jointly accelerating upgrades from 10 GbE fabrics to 50-100 GbE and >100 GbE architectures. Meanwhile, corporate net-zero pledges and the Swiss Datacenter Efficiency Association’s efficiency label have turned energy-efficient switching platforms into a procurement priority, forcing vendors to integrate silicon photonics and heat-re-use capabilities. Vendors unable to satisfy in-country data-residency or efficiency thresholds face elevated entry barriers. These intertwined regulatory, technological, and environmental forces shape a market where compliance and performance are no longer trade-offs but simultaneous purchase criteria
Key Report Takeaways
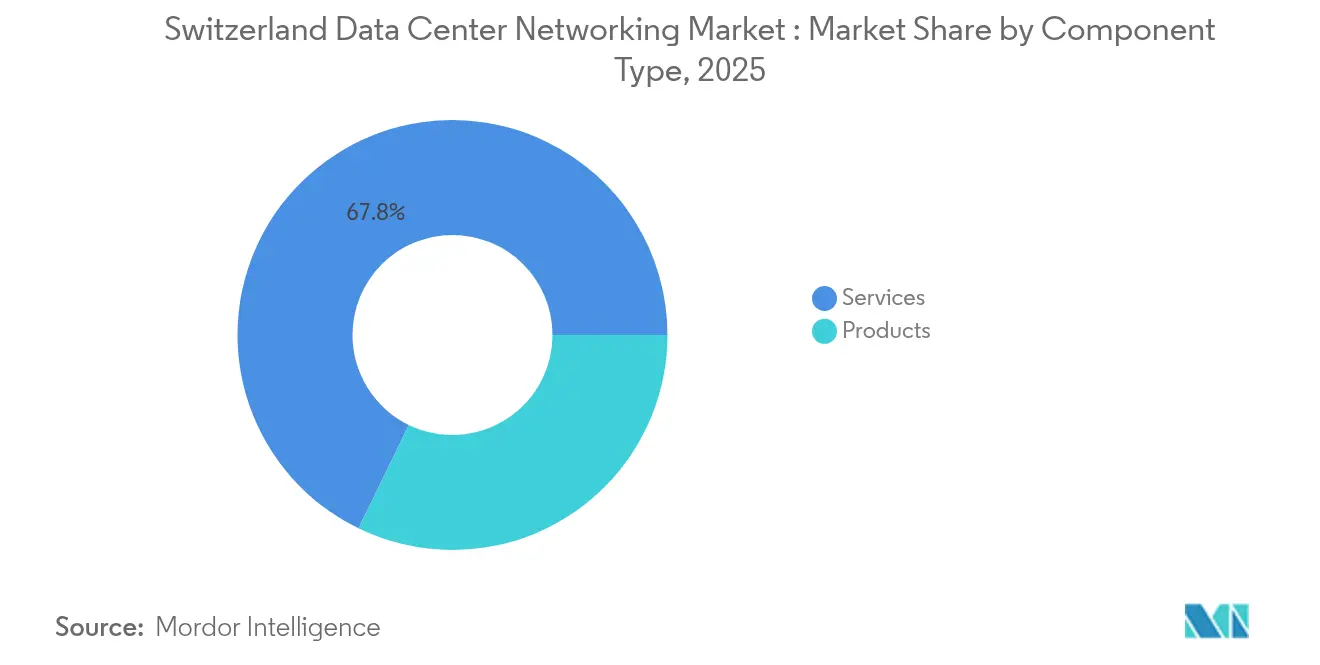
- By component, Ethernet switches led with 32.20% of the Switzerland data center networking market share in 2025, while software-defined networking (SDN) controllers are projected to expand at a 12.76% CAGR through 2031.
- By end-user, the IT & telecommunications segment commanded 33.90% share of the Switzerland data center networking market size in 2025; banking, financial services, and insurance (BFSI) is growing fastest at 11.92% CAGR.
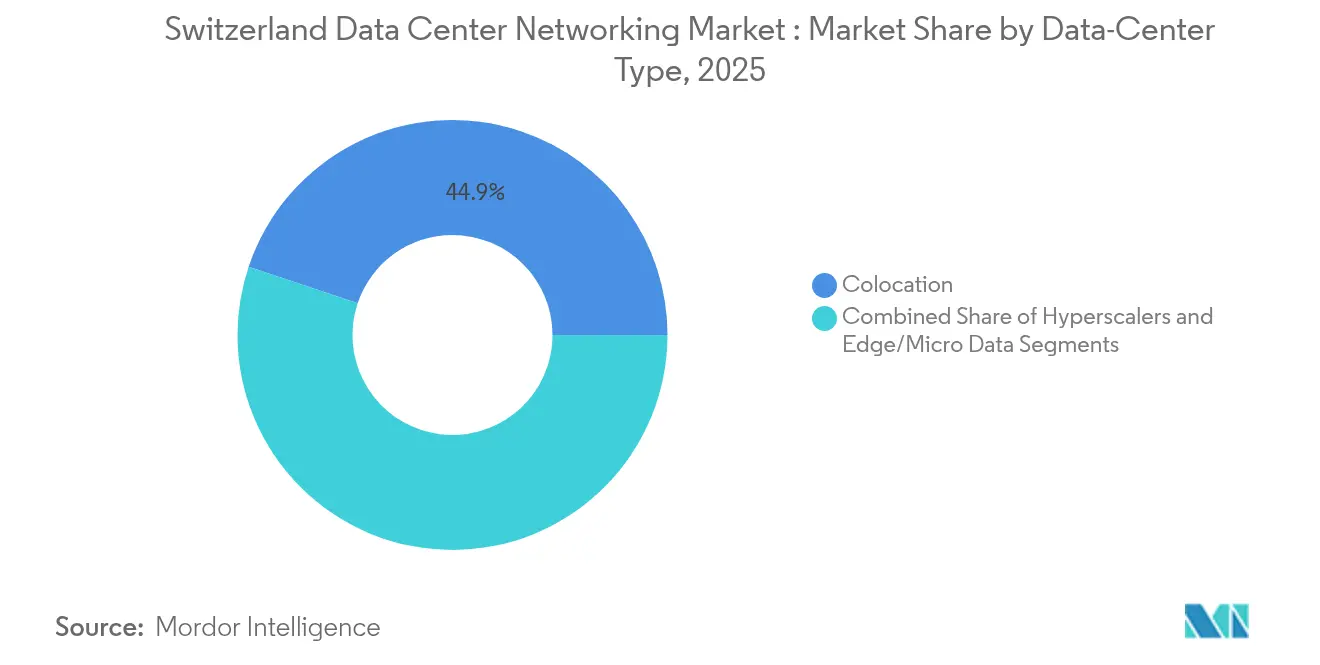
- By data-center type, colocation facilities held 44.85% revenue share in 2025, whereas hyperscale/cloud deployments are set to rise at a 14.05% CAGR to 2031.
- By bandwidth, 50-100 GbE connections represented 36.40% of deployments in 2025; >100 GbE is the quickest-advancing tier, progressing at a 14.72% CAGR.
Note: Market size and forecast figures in this report are generated using Mordor Intelligence’s proprietary estimation framework, updated with the latest available data and insights as of 2026.
Worldwide industry scale is not derived from any single country or region but from the combination of national and regional inputs. The data center networking market size of Mordor Intelligence integrates these into one global valuation.
Switzerland Data Center Networking Market Trends and Insights
Drivers Impact Analysis*
| Driver | (~) % Impact on CAGR Forecast | Geographic Relevance | Impact Timeline |
|---|---|---|---|
| Growing adoption of cloud services and hyperscale build-outs | +1.8% | Zurich, Geneva, Basel | Medium term (2-4 years) |
| Surge in data backup/archival mandates | +1.2% | National, finance hubs | Short term (≤ 2 years) |
| Edge and micro-data-center rollout | +1.5% | Urban and industrial regions | Medium term (2-4 years) |
| revFADP in-country compliance upgrades | +0.9% | National | Short term (≤ 2 years) |
| Corporate net-zero targets | +0.7% | Major data-center hubs | Long term (≥ 4 years) |
| Ultra-low-latency trading infrastructure | +0.4% | Zurich financial district | Short term (≤ 2 years) |
| Source: Mordor Intelligence | |||
Growing adoption of cloud services and hyperscale build-outs
Hyperscale operators are accelerating Swiss expansions to attract European clients requiring local data residency. Microsoft earmarked USD 400 million to enlarge its Swiss cloud region in June 2025, signalling confidence in Switzerland’s strategic location for pan-European workloads.[1]Microsoft Corp., “Microsoft Expands Swiss Cloud Region,” microsoft.com Enterprises upgrading to 25-100 GbE fabrics now treat network modernization as a prerequisite for multicloud workloads rather than a discretionary refresh. Swisscom’s Network Vision 2030+ consolidates ten legacy IP networks into a unified backbone, creating capacity headroom for 25% annual traffic growth and offering deterministic latency suited to real-time finance applications. Financial-services participants in Zurich are migrating algorithmic trading engines to new high-density fabrics where microsecond latency reductions translate directly into competitive trading advantages.
Surge in data backup/archival mandates among Swiss enterprises
revFADP demands exhaustive audit trails, compelling firms to implement geo-redundant archival nodes. Swissmedic’s CHF 185 million (USD 208 million) 15-year deal with Swisscom embeds robust archival, encryption, and disaster-recovery functions into the regulator’s pharmaceutical oversight IT stack. Similar mandates in healthcare and life sciences trigger the procurement of storage-area-network controllers able to automate data migration across twin or triple-site architectures. The resulting traffic shifts stimulate uptake of load balancers and application-delivery controllers sized for encrypted throughput as archival windows narrow from overnight to near-real-time.
Edge and micro-data-center rollout for low-latency IoT workloads
Smart-factory pilots, autonomous vehicle tests, and city-wide sensor grids require compute nodes within single-digit millisecond proximity. NTT’s All-Photonics Network proof-of-concept demonstrated sub-millisecond cross-data-center latency, validating optical topologies designed for Swiss municipal edge clusters.[2]NTT DATA, “All-Photonics Network Demonstration in Switzerland,” nttdata.com nLighten’s purchase of seven Swiss edge sites from EXA Infrastructure brings micro-data-center capacity closer to industrial zones and transit corridors, elevating demand for compact, high-performance switches featuring redundant power in sub-5 kW footprints.[3]EdgeIR, “nLighten Acquires Seven Swiss Edge Data Centers,” edgeir.com Industrial clients consequently seek dual-stack fabrics able to bridge OT protocols with standard Ethernet on a single switching plane.
Corporate net-zero targets driving energy-efficient switching fabrics
Energy-efficiency labels now influence tender award criteria alongside throughput and latency scores. The Swiss Datacenter Efficiency Association’s certification scheme, underwritten by the Federal Office of Energy, rates facilities on the holistic energy balance of cooling, compute, and networking subsystems. Green Datacenter’s forthcoming 12 MW Zurich West facility integrates waste-heat extraction for district heating and natural-cooling airflow, proving that sustainability need not limit high-density pods. Such initiatives advance silicon-photonics modules and co-packaged optics that extend bandwidth while reducing watt-per-gigabit ratios.
Restraints Impact Analysis*
| Restraint | (~) % Impact on CAGR Forecast | Geographic Relevance | Impact Timeline |
|---|---|---|---|
| Scarcity of certified data-center networking talent | -0.8% | National, German-speaking cantons | Medium term (2-4 years) |
| High capex/opex for 100 GbE+ optical and silicon | -1.1% | Major data-center hubs | Short term (≤ 2 years) |
| EU chip-supply bottlenecks | -0.6% | Nationwide | Short term (≤ 2 years) |
| Regulatory scrutiny on Chinese-origin gear | -0.4% | Finance sector nodes | Medium term (2-4 years) |
| Source: Mordor Intelligence | |||
Scarcity of certified data-center networking talent
Switzerland hosts only a limited pool of engineers certified on SDN, optical interconnects, and AI-aware fabrics. Swisscom already employs 200 data-security specialists across six data centers and invests CHF 1.7 billion (USD 1.91 billion) annually in infrastructure and training to secure talent retention. Immigration ceilings tighten availability further, prompting enterprises to outsource run-ops to managed services or adopt low-touch automation platforms that curb manual configuration workloads
High capex/opex for 100 GbE+ optical and silicon
Transitioning from 10 GbE to 100 GbE+ demands fresh cabling plans, higher-grade optics, and staff upskilling, pushing project outlays 40–60% beyond electrical upgrades according to silicon-photonics supplier benchmarks. EU supply volatility in rare-earth metals inflates transceiver costs, while limited Swiss repair depots elevate spares logistics. Mid-market enterprises therefore pace migrations in line with depreciation cycles rather than immediate performance demands, tempering overall bandwidth-mix acceleration.
*Our forecasts treat driver/restraint impacts as directional, not additive. The impact forecasts reflect baseline growth, mix effects, and variable interactions.
Segment Analysis
By Component: Software-Defined Innovation Outpaces Legacy Gear
Switzerland data center networking market size for SDN controllers is projected to expand at 12.76% CAGR, reflecting enterprises’ preference for controller-based policy orchestration across on-premises, colocation, and multicloud footprints. The Switzerland data center networking market share for Ethernet switches remained highest at 32.20% in 2025, yet fabrics are undergoing generational upgrades from fixed 10 GbE leaf-spine layouts toward modular 50-100 GbE systems that exploit breakout optics and deep buffer memory. Routers maintain relevance for inter-data-center links, where deterministic routing tables guarantee compliance with financial-sector latency SLAs. AI clusters further spur adoption of 400G optical interconnects, and Cisco’s purpose-built optics for GPU fabrics illustrate vendor strategies aimed at GPU-to-GPU lossless throughput. Network-security appliances post steady gains as zero-trust models enforce east-west traffic inspection inside virtualization domains.
The component mix is experiencing silicon innovation couched in sustainability goals. Co-packaged optics lower watts-per-gigabit, helping enterprises align with the efficiency label’s power-usage-effectiveness benchmarks. Storage-area-network gear sees renewed investment as revFADP prompts triple-site backup replication. Vendors offering controller plug-ins for hybrid-cloud policy mapping win preference over point products, while open-hardware white-box offerings secure niche deployments at hyperscalers aiming for cost control and disaggregated procurement.


By End-User: Financial Verticals Pursue Deterministic Latency
Within the Switzerland data center networking market, BFSI workloads drive premium switch and timing-protocol demand. High-frequency trading desks invest in Layer 1 optical bypass fabrics to shave microseconds, spurring 11.92% CAGR through 2031 for the segment. The Switzerland data center networking industry’s IT & telecom operators, holding 33.90% share, remain anchor tenants of colocation halls and early adopters of 800G backbones linking metropolitan rings. Public-sector agencies upgrade to air-gapped enclaves featuring mandatory on-shore key-management modules. Healthcare providers integrate network slicing to prioritize telemedicine packets alongside imaging archives compliant with Swissmedic retention rules, while life-science firms rely on deterministic east-west throughput for genomics pipelines. Manufacturers adopt converged OT/IT fabrics to monitor predictive-maintenance telemetry and close control-loop latency inside factory floors. Media companies transition from satellite uplinks to IP-based 4K/8K contribution feeds, demanding multicast-optimized leaf-tier switches.
By Data-Center Type: Hyperscalers Dominate Expansion Projects
Colocation continues as Switzerland data center networking market’s largest venue at 44.85% share, but hyperscalers enjoy the strongest 14.05% CAGR as global providers establish in-country regions to serve European workloads under revFADP. The Switzerland data center networking market size for hyperscale segments benefits from custom ASICs and electrical-mechanical co-design that squeeze rack power envelopes while targeting ≥95% network uptime. Edge and micro-facilities emerge along rail hubs, factory campuses, and alpine tunnels, catering to ultra-low-latency IoT and content-delivery cases. Swisscom’s December 2024 buy-out of the Bonvillars site enlarges its colocation cluster in Romandie, underpinning geo-redundancy for French-speaking enterprises. Underground data-center blueprints, such as the 82% cost-index Flums facility, illustrate innovative responses to land scarcity and thermal management within a geology that assures physical security.
By Bandwidth: Greater Than 100 GbE Transitions Gain Momentum
Mainstream Swiss facilities standardized on 50-100 GbE, which captured a 36.40% share in 2025. However, >100 GbE lines, led by 400G and 800G Ethernet, are scaling at 14.72% CAGR as GPU clusters, AI inference farms, and market-data distribution platforms saturate current pipes. The Switzerland data center networking market size for >100 GbE portfolios is primed to peak as silicon-photonics costs normalize. QSFP-TEK and linear-drive pluggable optics offer vendors alternate power-latency trade-offs. Conversely, ≤25 GbE persists in edge pop-ups where cost and power budgets outrank raw throughput. Network teams architect cable-plant migrations toward single-pair multimode pathways to future-proof against upcoming 1.6T modules, while software toolchains evolve to automate load balancing across mixed speed tiers.
Geography Analysis
The Switzerland data center networking market clusters around Zurich, Geneva, and Basel, home to finance, international organizations, and life-sciences headquarters respectively. Zurich’s trading venues compel micro-second fiber routes between data centers and exchange engines, sustaining premium connectivity tariffs. Geneva appeals to multinational bodies demanding neutral hosting under strong privacy laws, while Basel’s pharmaceutical corridor upgrades network fabrics to accommodate genomic analytics. Hydroelectric resources supply 60% of national power, enabling operators to tout renewable energy mixes that complement net-zero targets. Fiber-to-the-home penetration exceeds 50% nationally, yet rural canton variance prompts government incentives for last-mile optic builds. Cross-border dark-fiber links to Frankfurt and Milan extend bandwidth pools, though operators maintain in-country mirrors to uphold revFADP. Underground designs, including caverns repurposed from military bunkers, reduce cooling loads by leveraging ambient rock temperatures and deliver resilience from surface hazards. These geographical strengths reinforce Switzerland’s perception as Europe’s data-sovereignty enclave where robust regulatory governance coexists with innovative infrastructure models.
Mordor Intelligence tracks the data center networking market across other major regions such as Europe, Asia, and Africa, with additional country-level coverage spanning France, Sweden, Singapore, South Africa, Chile, and Brazil, each reflecting localized structural drivers, restraints and more.
Competitive Landscape
Global incumbents—Cisco, Juniper, Arista—address performance and compliance by embedding revFADP-aware telemetry and integrating local key-management servers. Regional integrators partner with these vendors to compensate for talent shortages, delivering turnkey fabric swaps that accelerate go-live cycles. Arista’s collaboration with NVIDIA on EOS AI Agent joins switch telemetry with GPU utilization metrics, delivering closed-loop congestion control tailored for AI clusters. Optical specialists such as Infinera and Nokia supply coherent pluggables for metro links, while white-box ODMs target hyperscalers seeking cost efficiencies through disaggregation. Sustainability pressures spur vendor roadmaps toward co-packaged optics and recyclable chassis materials, with Green Datacenter trialing circular-economy procurement for network racks. Regulatory scrutiny on Chinese-origin equipment directs finance clients toward Western or Japanese suppliers, compressing vendor diversity but elevating compliance confidence. Medium-sized firms exploit niches in edge orchestration, selling controller software that provisions multi-site micro-data-center arrays from a single dashboard. The overall vendor field remains moderately fragmented, yet solution breadth and local alignment increasingly dictate long-term share retention.
Switzerland Data Center Networking Industry Leaders
Cisco Systems, Inc.
Arista Networks, Inc.
Hewlett Packard Enterprise Company
Juniper Networks, Inc.
Dell Technologies Inc.
- *Disclaimer: Major Players sorted in no particular order

Recent Industry Developments
- January 2025: Infomaniak’s Geneva data center achieved 100% electricity recovery for district heating, covering 6,000 households at 25% server capacity.
- December 2024: Swisscom bought the Bonvillars facility from Philip Morris, expanding colocation capacity in Romandie.
- November 2024: Swissmedic awarded Swisscom a CHF 185 million, 15-year IT services mandate that includes data-center operations and security management.
- August 2024: Green Datacenter began constructing a 12 MW hall at Zurich West with waste-heat extraction and natural cooling, slated for 2026 service entry.
- July 2024: Swiss Datacenter Efficiency Association launched a national efficiency label; eight sites await certification.


Research Methodology Framework and Report Scope
Market Definitions and Key Coverage
Our study defines the Switzerland data-center networking market as the yearly revenue earned inside the country from purpose-built switching, routing, storage-area network equipment, application delivery controllers, optical interconnects, SDN controllers, plus their installation, integration, support, and managed network services that serve colocation, hyperscale/cloud, and edge data-center facilities. All figures are expressed in constant-2024 US dollars.
Scope Exclusions: Consumer or campus LAN gear, server and storage boxes, and any revenue booked outside Swiss territory are left out.
Segmentation Overview
- By Component
- Products
- Ethernet Switches
- Routers
- Storage Area Network (SAN)
- Application Delivery Controllers (ADC)
- Network Security Appliances
- Software-Defined Networking (SDN) Controllers
- Optical Interconnects
- Services
- Installation and Integration
- Training and Consulting
- Support and Maintenance
- Managed Network Services
- Products
- By End-User
- IT and Telecommunications
- Banking, Financial Services and Insurance (BFSI)
- Government and Defense
- Media and Entertainment
- Healthcare and Life Sciences
- Manufacturing and Industrial
- Other End-Users
- By Data-Center Type
- Colocation
- Hyperscalers/Cloud Service Providers
- Edge/Micro Data Centers
- By Bandwidth
- LessThan equals to 10 GbE
- 25–40 GbE
- 50–100 GbE
- Greater Than 100 GbE
Detailed Research Methodology and Data Validation
Primary Research
We interviewed network architects at colocation operators in Zürich, procurement managers from two hyperscale cloud entrants, regional integrators, and equipment distributors across German- and French-speaking cantons. Their inputs refined utilization ratios, average selling prices, and migration curves toward 100 GbE+, closing gaps that secondary data could not resolve.
Desk Research
Analysts first mapped the demand pool using open data from the Swiss Federal Statistical Office, OFCOM's telecom-traffic bulletins, the Federal Act on Data Protection revFADP, and trade statistics released through Eurostat Comext; these were complemented by shipment-level insights from Volza and company disclosures housed on D&B Hoovers and Dow Jones Factiva. Industry notes from the Swiss Data Center Association and white papers in IEEE Xplore helped us benchmark port-density trends, power targets, and adoption timelines for 25-400 GbE switches. A wider scan of investor presentations, sustainability reports, and public tender notices then anchored near-term project pipelines. The sources cited here are illustrative; our desk review drew on many additional publications to cross-check numbers and definitions.
Market-Sizing & Forecasting
A top-down model converts data-center capex, rack counts, and port-per-rack norms into total addressable switch and router volumes, which are then multiplied by ASPs derived from channel checks; supplier roll-ups provided a selective bottom-up lens that validated totals. Key variables include inbound rack additions, port-speed mix shift, virtualization penetration, average lifespan of networking gear, and Swiss-franc exchange assumptions. Five-year forecasts apply multivariate regression blended with ARIMA smoothing coefficients and were stress-tested with our primary respondents before finalization.
Data Validation & Update Cycle
Outputs pass anomaly screens, peer reviews, and a senior sign-off. Reports refresh annually, with interim revisions triggered by material events such as hyperscale site announcements or regulatory changes; before delivery, an analyst reruns the model to ensure clients receive the latest view.
Why Mordor's Switzerland Data Center Networking Baseline Earns Trust
Published estimates often diverge because firms mix servers, storage, or pan-European shipments into their scopes, apply differing currency bases, or project growth from short historical trails.
By selecting only in-country networking revenue, updating exchange rates quarterly, and blending validated top-down demand with pragmatic bottom-up checks, Mordor Intelligence offers decision-makers a balanced, reproducible baseline.
Benchmark comparison
| Market Size | Anonymized source | Primary gap driver |
|---|---|---|
| USD 0.37 B (2025) | Mordor Intelligence | - |
| USD 1.37 B (2024) | Global Consultancy A | Bundles servers and storage; uses DACH roll-ups without FX alignment |
| USD 0.36 B (2025) | Trade Journal B | Counts re-exported hardware and relies on straight-line projections with no primary checks |
These comparisons show that when scope, variables, and refresh cadence are weighed carefully, our numbers sit at the intersection of transparency and practical realism, making them the dependable baseline for Swiss data-center networking decisions.


Key Questions Answered in the Report
What is the current value of the Switzerland data center networking market?
The market is valued at USD 396.1 million in 2026 and is projected to reach USD 557.1 million by 2031.
Which component segment holds the largest share?
Ethernet switches accounted for 32.20% market share in 2025, making them the largest component category.
Why are hyperscalers expanding rapidly in Switzerland?
Strict data-residency laws, political stability, and renewable energy availability encourage hyperscalers to build local regions while serving wider European workloads.
How are sustainability goals influencing networking hardware choices?
Corporate net-zero targets and the Swiss Datacenter Efficiency Association’s label push operators toward energy-efficient switches, silicon-photonics optics, and waste-heat-re-use designs.
Which bandwidth tier is growing fastest?
Greater Than 100 GbE lines, fueled by AI and high-frequency trading needs, are advancing at a 14.72% CAGR to 2031.
What is the main talent-related restraint in the Swiss market?
A shortage of certified engineers in SDN and optical networking inflates labor costs and slows deployment velocity, particularly in German-speaking cantons.
Page last updated on:


