
Market Overview
| Study Period | 2020 - 2031 |
|---|---|
| Forecast Data Period | 2026 - 2031 |
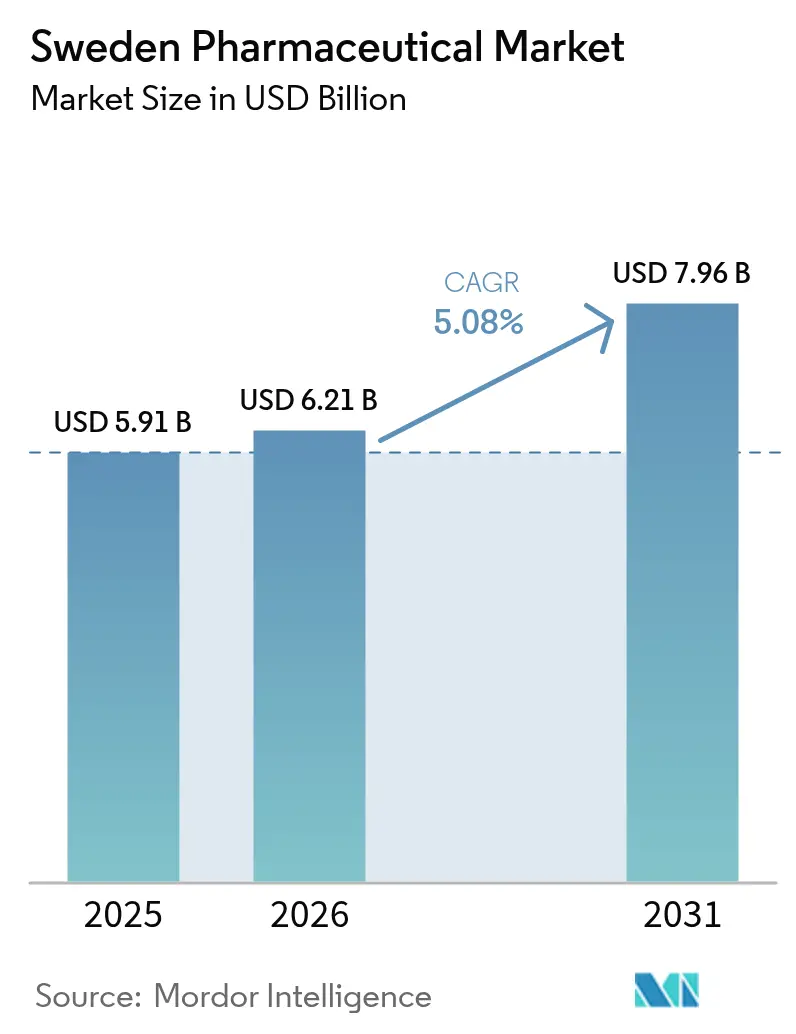
| Base Year Market Size (2025) | USD 5.91 Billion |
| Market Size (2026) | USD 6.21 Billion |
| Market Size (2031) | USD 7.96 Billion |
| Growth Rate (2026 - 2031) | 5.08 % |
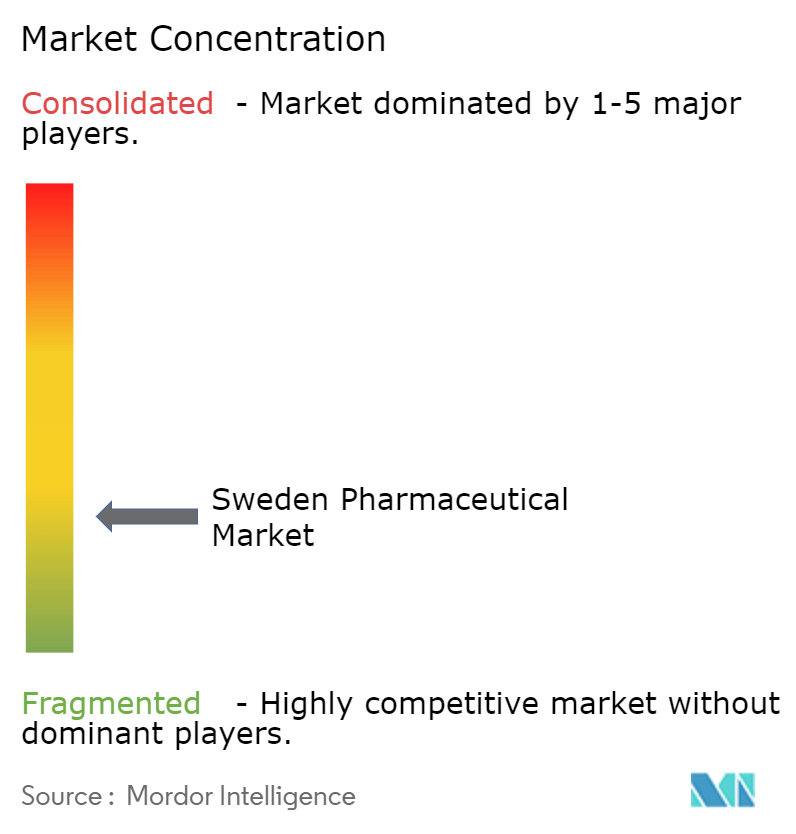
| Market Concentration | Low |
Major Players *Disclaimer: Major Players sorted in no particular order Image © Mordor Intelligence. Reuse requires attribution under CC BY 4.0. | |
Sweden Pharmaceutical Market Analysis by Mordor Intelligence
The Sweden pharmaceutical market size is expected to grow from USD 5.91 billion in 2025 to USD 6.21 billion in 2026 and is forecast to reach USD 7.96 billion by 2031 at 5.08% CAGR over 2026-2031. Steady growth reflects the convergence of a universal healthcare model, high digital prescription penetration, and targeted government investment in precision medicine. Oncology, cardiovascular, and dermatology therapies set the commercial tone, while the National Life-Science Strategy accelerates translational research that feeds a robust product pipeline. Moderate competitive intensity persists as multinational firms leverage Sweden’s clinical-trial infrastructure, and local specialists such as Sobi expand rare-disease portfolios. Hospital pharmacies remain the primary dispensing gate, yet online channels gain momentum in response to near-universal e-prescription adoption.
Key Report Takeaways
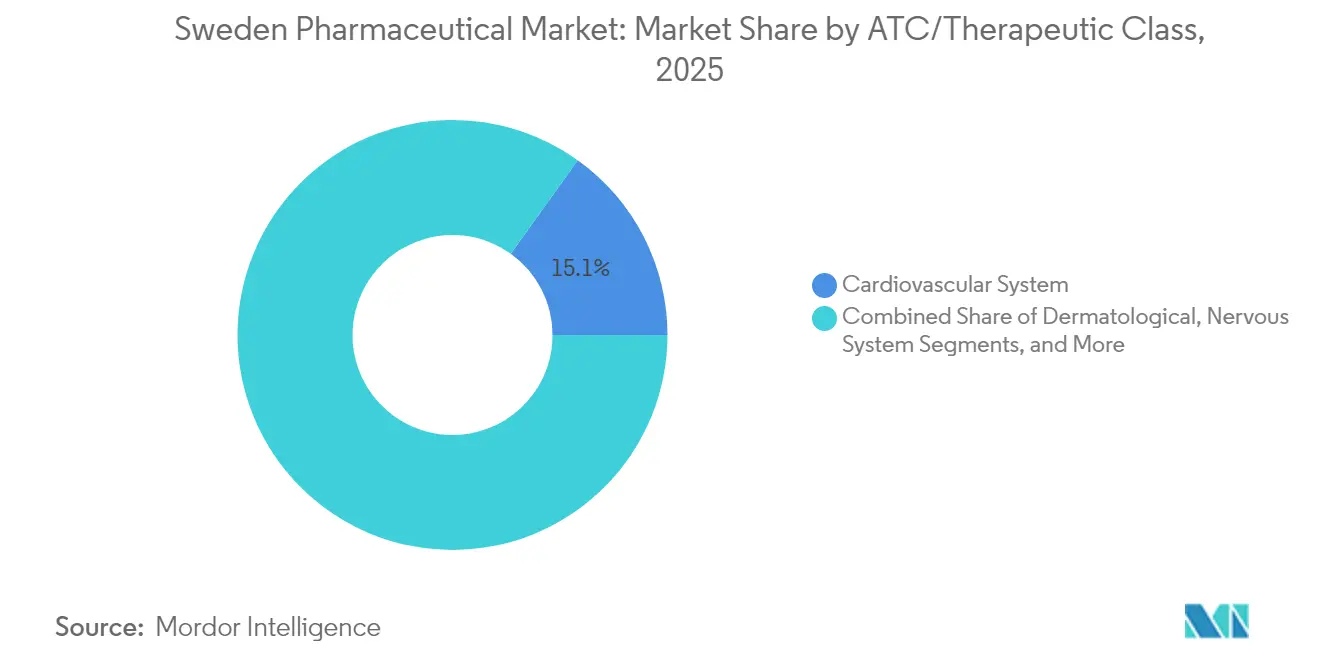
- By ATC therapeutic class, the cardiovascular system segment led with 15.10% of Sweden pharmaceutical market share in 2025; dermatologicals are projected to expand at a 6.12% CAGR to 2031.
- By drug type, branded products held 70.55% of the Sweden pharmaceutical market size in 2025, while generics record the fastest CAGR at 6.71% through 2031.
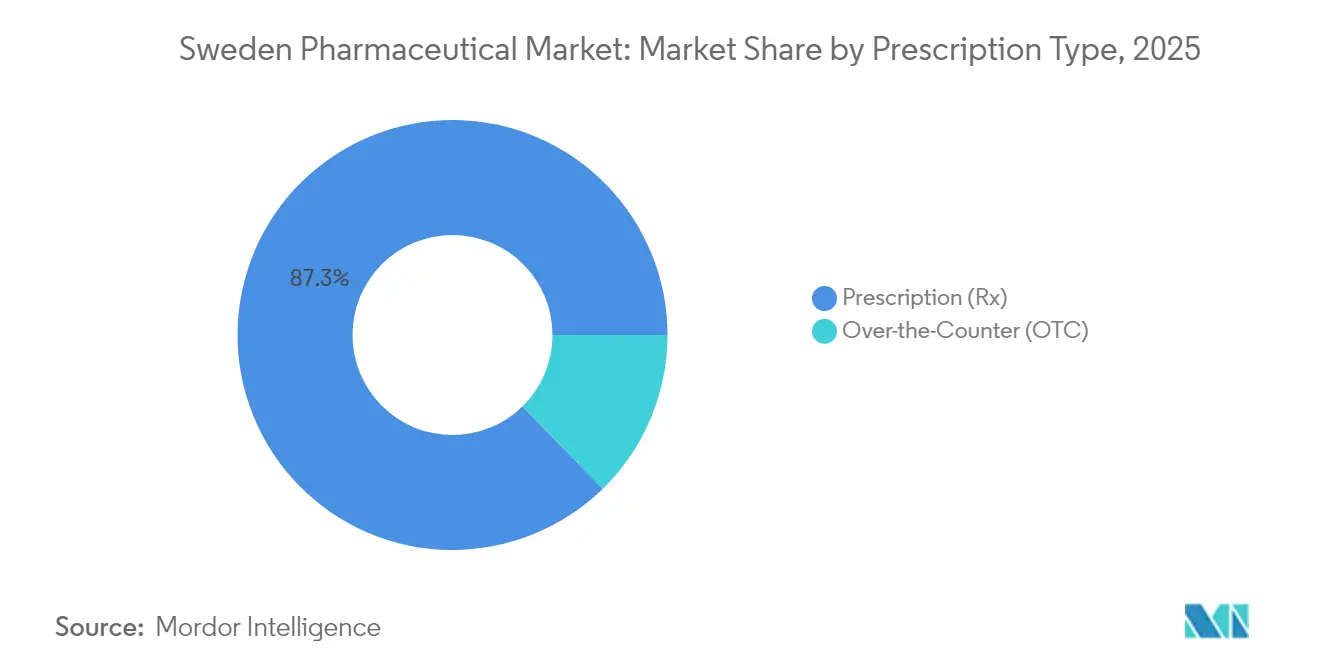
- By prescription type, prescription medicines accounted for an 87.32% share of the Sweden pharmaceutical market size in 2025; over-the-counter items are advancing at a 6.86% CAGR to 2031.
- By distribution channel, hospital pharmacies captured 52.48% of Sweden pharmaceutical market share in 2025, whereas online pharmacies post the top CAGR at 6.25% through 2031.
Note: Market size and forecast figures in this report are generated using Mordor Intelligence’s proprietary estimation framework, updated with the latest available data and insights as of 2026.
Sweden Pharmaceutical Market Trends and Insights
Drivers Impact Analysis*
| Driver | (~) % Impact on CAGR Forecast | Geographic Relevance | Impact Timeline |
|---|---|---|---|
| Growing oncology-drug spend driven by aging & lifestyle change | +1.2% | National, concentrated in Stockholm, Gothenburg, Malmö | Long term (≥ 4 years) |
| National Life-Science Strategy funding translational research | +0.8% | National, with research clusters in Stockholm, Uppsala, Lund | Medium term (2-4 years) |
| Accelerated approval pathway for ATMPs & orphan drugs | +0.6% | National, with regulatory center in Uppsala | Medium term (2-4 years) |
| Hospital procurement reforms favour value-based contracts | +0.4% | National, regional implementation variations | Short term (≤ 2 years) |
| Digital therapeutics reimbursement pilot | +0.3% | National, pilot regions initially | Medium term (2-4 years) |
| Nordic cross-border trials hub attracting FDI | +0.5% | Nordic region, Sweden as coordination center | Long term (≥ 4 years) |
| Source: Mordor Intelligence | |||
Growing Oncology-Drug Spend Driven by Aging & Lifestyle Change
Sweden’s 65-plus demographic is on course to hit 23% of the population by 2030, intensifying the national oncology bill. Pharmaceutical costs are projected to climb from SEK 38.7 billion in 2024 to SEK 46.4 billion in 2028, with oncology drugs rising fastest. Higher incidence of lung and colorectal cancers linked to lifestyle factors magnifies the need for targeted therapies and immuno-oncology agents. Universal access guarantees uptake of novel CAR-T and precision-medicine products, and richly linked national health registries provide real-world evidence that reinforces Sweden as a preferred location for global oncology trials. These dynamics collectively lift the Sweden pharmaceutical market by deepening demand for premium cancer treatments.
National Life-Science Strategy Funding Translational Research
Government backing totaling SEK 3.1 billion through 2030 underwrites the SciLifeLab & Wallenberg program, which recruits 185 PhDs and expands data-driven life-science platforms. Prioritized fields include cell biology, precision medicine, and infection epidemiology, giving pharmaceutical developers an ecosystem for AI-enabled drug discovery. Funding also supports advanced-therapy development centers, evidenced by 48 active ATMP trials that generate regulatory knowledge and entice multinational R&D investment. The initiative enriches human capital and infrastructure, bolstering Sweden pharmaceutical market growth via accelerated bench-to-bedside cycles.
Accelerated Approval Pathway for ATMPs & Orphan Drugs
Streamlined review processes aligned with EMA guidelines shaved 30% off Sweden’s average approval timeline for orphan designations in 2024 [1]Swedish Medical Products Agency, “Orphan Drug Designations and Market Authorizations 2024,” lakemedelsverket.se. Employment in the domestic ATMP segment has surged 183% since 2018, with 25 SMEs active in gene and cell therapy. Ten-year market exclusivity for orphan drugs and favorable clinical-trial conditions tied to a genetically homogeneous population attract both local and global innovators. The regulatory edge adds momentum to the Sweden pharmaceutical market by fast-tracking novel therapies toward commercial launch.
Hospital Procurement Reforms Favor Value-Based Contracts
The 2025 rollout of a revised NordDRG system introduces standardized cost weights that spotlight therapeutic outcomes in reimbursement discussions. Regions now ink managed-entry agreements linking payments to real-world performance, favoring companies able to supply robust health-economics data. Enhanced transparency influences formulary decisions and spurs greater emphasis on patient-support programs. The governance shift strengthens the Sweden pharmaceutical market as data-rich suppliers gain competitive traction.
Restraints Impact Analysis*
| Restraint | (~) % Impact on CAGR Forecast | Geographic Relevance | Impact Timeline |
|---|---|---|---|
| Stricter price-pressure from TLV reference-pricing updates | -0.9% | National, affecting all pharmaceutical pricing | Short term (≤ 2 years) |
| Skilled-labour shortage in biomanufacturing facilities | -0.6% | National, concentrated in Stockholm, Gothenburg regions | Medium term (2-4 years) |
| EU HTA regulation raising evidence thresholds | -0.4% | EU-wide, affecting Sweden's market access | Medium term (2-4 years) |
| Supply-chain risk from API dependence on Asia | -0.3% | Global, affecting Swedish pharmaceutical imports | Long term (≥ 4 years) |
| Source: Mordor Intelligence | |||
Stricter Price-Pressure from TLV Reference-Pricing Updates
TLV’s international price benchmarking now places Swedish non-generic prices sixth lowest in Europe, while generics are the cheapest among 19 countries. The product-of-the-month system mandates substitution to the lowest-cost option, eroding margins for innovators. A new co-payment ceiling of SEK 3,800 from July 2025 signals unwavering cost-containment. Collectively these measures temper revenue expansion within the Sweden pharmaceutical market and compel firms to validate premium pricing through superior outcomes.
Skilled-Labour Shortage in Biomanufacturing Facilities
Advanced manufacturing investments across the Nordic region, such as Novo Nordisk’s DKK 42 billion capacity build-out, heighten competition for specialists. Recruiting hurdles, prolonged work-permit processes, and curriculum lags in automation and regulatory disciplines constrain scale-up of ATMP production. Talent scarcity slows facility commissioning, which suppresses the Sweden pharmaceutical market’s ability to absorb demand for novel biologics.
*Our forecasts treat driver/restraint impacts as directional, not additive. The impact forecasts reflect baseline growth, mix effects, and variable interactions.
Segment Analysis
By ATC Therapeutic Class: Cardio Leadership, Dermatology Momentum
The cardiovascular system category delivered 15.10% of the 2025 Sweden pharmaceutical market, supported by nationwide cardiac-care protocols and an aging population that sustains use of antihypertensives, anticoagulants, and lipid modulators. Antineoplastic and immunomodulating agents follow closely, boosted by the national cancer strategy and expedited approvals. Dermatologicals, while smaller in absolute terms, post a 6.12% CAGR that outpaces all other classes due to rising incidence of inflammatory skin diseases and greater biologic uptake. Sweden’s antimicrobial stewardship keeps anti-infective volumes flat, yet sustained hospital demand maintains a stable contribution. Respiratory therapies face smoking-rate declines, but gains in biologic asthma treatments balance volume attrition. Musculoskeletal, genito-urinary, and specialized hospital drugs together carve out a diverse tail of opportunity, especially where orphan status or niche clinical needs apply.
Market leadership is unlikely to change abruptly, but dermatology growth could narrow the gap with cardiovascular lines by 2031. Expansion in oncology and dermatology underscores Sweden’s orientation toward high-complexity care, which in turn supports premium pricing and trial activity. The strategic spread of therapy classes fosters resilience for the Sweden pharmaceutical market against single-segment shocks, giving manufacturers multiple entry points anchored in clearly defined clinical guidelines.



By Drug Type: Brand Primacy Confronts Generic Velocity
Branded products maintained a 70.55% grip on 2025 sales, reflecting clinicians’ preference for evidence-led outcomes and a reimbursement model that rewards genuine innovation. Specialty biologics and orphan drugs extend exclusivity windows, insulating premium lines from immediate biosimilar or generic threats. TLV’s health-technology assessments, which place clinical value ahead of mere cost minimization, reinforce brand durability for therapies targeting unmet needs.
Generics, however, accelerate at 6.71% CAGR as reference pricing and mandatory substitution sharpen price competition. The effect is most pronounced in cardiovascular and central-nervous-system drugs where therapeutic interchangeability is high. Biosimilar adoption remains selective, especially in oncology where switching hesitancy endures. The interplay of these forces cultivates a two-tier market: high-value specialty brands at the upper end, and commoditized small-molecule generics at the base, together forming a balanced yet dynamic Sweden pharmaceutical market
By Prescription Type: Physician Oversight Remains Central
Prescription drugs accounted for 87.32% of 2025 sales, underscoring a healthcare model in which medical professionals control access to most treatments. Comprehensive reimbursement, capped out-of-pocket costs, and near-universal digital prescriptions enhance adherence and safety. National databases track dispensing and outcomes, strengthening pharmacovigilance and supporting value-based contracting.
Over-the-counter items expand at 6.86% CAGR on the back of self-care trends in pain management, gastrointestinal health, and vitamin supplementation. Regulatory reclassification of certain compounds, allied with digital guidance tools, makes it easier for consumers to select appropriate products. OTC momentum is meaningful yet remains complementary, not substitutional, reinforcing the prescription-centric architecture of the Sweden pharmaceutical market.
By Distribution Channel: Hospitals Anchor, Online Gains
Hospital pharmacies retained 52.48% channel share in 2025 due to their pivotal role in administering oncology, ATMPs, and other specialized medications. Regional procurement bodies negotiate volume contracts, leveraging economies of scale and centralized cold-chain logistics. In the specialty sphere, clinical oversight and tailored preparation requirements secure hospital dominance.
Online pharmacies, growing at 6.25% CAGR, ride Sweden’s 99% e-prescription penetration and consumer appetite for doorstep delivery. Expanded e-health services—consultations, adherence apps, home monitoring—deepen engagement and open avenues for chronic-disease management programs. Traditional retail outlets still cater to routine dispensing and OTC sales but face share dilution as digital adoption widens. Overall, channel diversification equips the Sweden pharmaceutical market with multiple touchpoints that accommodate evolving patient preferences while maintaining clinical standards.
Geography Analysis
Sweden’s pharmaceutical ecosystem benefits from its integration into the Nordic bloc, where shared regulatory frameworks and cross-border initiatives such as Medicon Valley create scale advantages. The region employs more than 65,000 life-science professionals and houses a dense cluster of GMP sites, with Denmark hosting over half the total and Sweden contributing specialized capacity in rare diseases and digital health solutions.
In Q1 2024, Swedish pharmaceutical exports reached SEK 39.5 billion against imports of SEK 6.46 billion, yielding a sizable surplus that underscores competitive manufacturing assets . Leading destinations include Germany, Norway, and the United States, while key import sources remain Germany and the Netherlands for APIs and finished dose forms. EU harmonization through the January 2025 joint clinical-assessment rules raises evidence thresholds for cancer drugs and ATMPs, prolonging dossiers but also granting unified scientific opinions that ease broader European rollout .
Domestically, Stockholm anchors headquarters and regulatory agencies, Gothenburg concentrates R&D and analytics, and Uppsala specializes in regulatory science and ATMP trials. Regional variations across 21 counties shape localized demand patterns—elderly-dense counties drive cardiovascular uptake, while urban centers with higher lifestyle-disease prevalence elevate oncology and dermatology consumption. The geographic tapestry nourishes the Sweden pharmaceutical market by balancing export-oriented manufacturing with an innovation-driven internal demand profile.
Regulatory Landscape
Sweden’s pharmaceutical regulation tracks EU requirements and is anchored in the Medicinal Products Act (Läkemedelslag 2015:315). Marketing authorization can follow the EU centralized, decentralized, mutual recognition, and national routes, with the Swedish Medical Products Agency (Läkemedelsverket) handling national implementation, supervision, and post-approval change control (for example, variations), alongside GMP and GDP oversight. Labeling and patient information requirements include Swedish-language materials, reflecting domestic patient-safety and communication norms.
Market access and public funding are largely shaped by the Dental and Pharmaceutical Benefits Agency (TLV), which determines reimbursement and value-based pricing decisions for the national benefits scheme. In March 2026, Läkemedelsverket said that a new report from its Knowledge Center for Pharmaceuticals in the Environment will support implementation of Sweden’s Strategy against Antimicrobial Resistance (AMR) 2026-2035, adding an explicit environmental and stewardship lens to medicine-use governance. Manufacturers are expected to incorporate this in lifecycle management and compliance planning.
Value Chain Analysis
Sweden’s pharmaceutical value chain runs from R&D and clinical development through manufacturing and import (including parallel import), then wholesaling and distribution under GDP requirements, and finally dispensing through hospital pharmacies, community pharmacies, and online pharmacies backed by national e-health infrastructure. Läkemedelsverket regulates development, manufacturing, and trade, TLV sets pricing and reimbursement, and E-hälsomyndigheten provides central digital services that support e-prescription penetration and pharmacy workflows.
Availability management and shortage mitigation are institutionalized through ADL (Aktorsgemensamt Dialogmote om Lakemedelstillganglighet), a permanent cross-stakeholder forum that links authorities, industry, and distributors to identify bottlenecks and coordinate actions. On the dispensing side, the pharmacy network at end-2024 included 1,397 community pharmacies, 7 online-only pharmacies, and 26 hospital pharmacies, with hospital supply concentrated among Apoteket AB and ApoEx. Export orientation also feeds upstream capacity and supply planning, with pharmaceuticals reported at SEK 154 billion in 2025 (7.5% of Sweden’s total exports), while parallel import remains a meaningful flow shaped by EU/EEA price differentials and currency movements.
Competitive Landscape
Competitive rivalry is moderate, with a blend of multinational leaders and niche Swedish firms. Global giants exploit established hospital relationships and comprehensive clinical-trial networks to roll out next-generation therapies. Local champions such as Sobi, which posted SEK 26 billion revenue in 2024, focus on haematology and immunology, harnessing orphan-drug advantages and deep patient-support frameworks.
Strategic moves in 2024 showcased capital deployment and regulatory collaboration. AstraZeneca earmarked USD 135 million for a 2,700-square-meter expansion of its Södertälje Biomanufacturing Center, reinforcing high-value bulk formulation capacity. The Swedish government instructed the Medical Products Agency to explore a national clinical-trials partnership, signaling public-sector commitment to attract multinational studies. Genomic Medicine Sweden secured SEK 15 million for pediatric precision-medicine initiatives, broadening the genomic-testing footprint that feeds drug-development data pipelines.
Digital-therapeutics start-ups and ATMP developers intensify competition by offering outcome-based solutions aligned with value-based contracts. Companies differentiate by integrating real-world-evidence collection tools, AI algorithms, and patient-reported outcomes into product-service bundles. Those able to meet TLV’s tough health-economics benchmarks seize an inside track in formulary negotiations, cementing position within the Sweden pharmaceutical market.
Sweden Pharmaceutical Industry Leaders
Amgen Inc.
Pfizer Inc.
Orifarm Group A/S
Merck & Co., Inc.
Novartis AG
- *Disclaimer: Major Players sorted in no particular order

Market Opportunities and Future Outlook
Ongoing centralization and system sustainability work is opening room for suppliers that can support national-level contracting, interoperability, and evidence generation. In December 2025, the Government of Sweden assigned new 2026 mandates to bodies including E-halsomyndigheten, TLV, and Lakemedelsverket to strengthen a sustainable pharmaceutical system, including work tied to more centralized management of pharmaceutical contracts and more streamlined clinical trial permitting. In March 2026, the government also appointed a special investigator (Karin Johansson) to propose expanded state responsibility for pharmaceuticals and vaccines, with interim reporting due June 2027 and final reporting due December 2027. This points toward procurement and governance that rewards vendors prepared for more standardized procurement interfaces.
Supply reliability and shortage management are another near-term opportunity area, given the scale of visible shortages. Lakemedelsverket’s 2025 annual reporting referenced 2,657 shortage reports and 169 manufacturer/wholesaler inspections, reinforcing the value of resilient supply setups and compliance-ready distribution. TLV’s review of generic reference pricing (takpriser) during 2026 targets market flexibility and shortage mitigation, which supports portfolio and tender strategies that balance competitive pricing with continuity commitments. The National Pharmaceutical Strategy 2024-2026 also keeps availability, appropriate use and handling, and the development of new drugs and clinical trials as core themes, aligning opportunity with clinical trial enablement, real-world evidence generation, and operational models that reduce regional fragmentation.
Recent Industry Developments
- July 2026: Newbury Pharmaceuticals announced marketing authorization in Sweden for Dalbavancin Newbury (500 mg), a generic version of Xydalba. The authorization supports Newbury’s push into hospital anti-infectives and adds another competitor in injectable hospital supply chains where procurement and substitution dynamics are sensitive to availability.
- June 2026: Pfizer received a TLV decision granting public subsidy for Litfulo (ritlecitinib) for severe alopecia areata in adults and adolescents aged 12 and older, effective from 1 June 2026. The reimbursement outcome broadens funded access in a specialty dermatology indication and highlights the role of TLV decisions in shaping uptake for higher-value therapies.
- August 2024: AstraZeneca announced a USD 135 million investment to expand its Sweden Biomanufacturing Center in Sodertalje by 2,700 square meters. The expansion increases domestic biomanufacturing capacity and supports Sweden’s role in supplying advanced biologics from an EU-aligned quality and regulatory environment.


Research Methodology Framework and Report Scope
Market Definition and Coverage
This market is defined as the value of human prescription and over-the-counter finished pharmaceutical products sold within Sweden across retail and hospital channels, measured at ex-factory prices.
Scope exclusions: Veterinary medicines, active pharmaceutical ingredients, medical devices, and distribution or pharmacy service revenues are excluded.
Segmentation Overview
- By ATC / Therapeutic Class
- Cardiovascular System
- Dermatological
- Genito-Urinary & Sex Hormones
- Anti-infectives (Systemic)
- Antineoplastic & Immunomodulating Agents
- Musculoskeletal System
- Nervous System
- Respiratory System
- Other Classes
- By Drug Type
- Branded
- Generic
- By Prescription Type
- Prescription (Rx)
- Over-the-Counter (OTC)
- By Distribution Channel
- Hospital Pharmacies
- Retail Pharmacies
- Online Pharmacies
Data Sources, Market Sizing, and Validation
Desk Research
Desk research helped us set the boundaries and anchor the model to public health and medicine spend signals. We leaned on sources such as the Swedish eHealth Agency for prescription system context, the Swedish Medical Products Agency for regulatory and product landscape cues, and OECD health statistics for consistent health expenditure baselines. We also referenced materials from the European Medicines Agency, Eurostat, and the World Health Organization where they helped confirm trend direction and cross-country comparability.
To translate these signals into a workable Sweden-only value model, we then used annual reports, investor presentations, and public price and reimbursement discussions as sense checks on pricing pressure, tender behavior, and mix shift toward specialty drugs. In a few places, paid subscriptions were used only to speed up company financials review, patent lookups, and shipment-level trade checks where public reporting was thin. The desk sources listed here are illustrative, and many other public documents and data tables were also used for cross-checking and clarification.
Primary Interviews and Surveys
Primary work focused on validating what drives real demand inside Sweden, with specific attention to hospital procurement patterns, retail dispensing behavior, and product mix changes between branded, generic, and biosimilar medicines. We spoke with manufacturers, distributors, pharmacy-side stakeholders, and healthcare purchasers so gaps from desk inputs could be closed and assumptions adjusted before the final numbers were signed off.
Distribution of primary research fieldwork respondents
| Company type | Respondent position |
|---|---|
| Top tier: 31% | CXOs: 19% |
| Mid tier: 50% | Functional/Unit leaders: 38% |
| Smaller Players: 19% | Managers: 43% |
Market-Sizing & Forecasting
The core model was built using a top-down approach where national medicine spending signals are reconstructed into an ex-factory pharmaceuticals pool for Sweden, and then aligned to what is actually dispensed and procured through retail and hospital pathways. Once this total was formed, it was corroborated using selective bottom-up approximations, such as sampled volume times average selling price checks by major therapy groups, plus channel checks on hospital tender intensity and retail substitution.
Inputs used in the sizing included public reimbursement and pricing direction, tender uptake in hospitals, generic and biosimilar penetration, changes in specialty drug share, and the pace of new product availability and switching behavior. Where direct inputs were missing, gaps were handled through conservative proxy ratios that were reviewed with interviewees and then stress-tested against adjacent indicators. For forecasting, we primarily relied on scenario analysis, since policy changes, tender outcomes, and specialty mix shifts can move growth up or down faster than older trends suggest.
Data Validation & Update Cycle
Validation was done through step-by-step triangulation across independent signals, followed by variance checks to flag years where price changes, tenders, or mix shifts could have created a false jump. If an outlier appeared, we revisited the assumptions behind pricing, penetration, or channel split, and re-contacted targeted respondents to confirm whether the move reflected real market behavior.
Before sign-off, another analyst reviews the model logic, calculations, and the reasonableness of each major input so errors do not carry through. Reports are refreshed annually, and interim updates are made when material events occur, such as reimbursement rule shifts or major procurement changes. Right before delivery, a final review pass is completed so the client receives the latest updated view.
Mordor Intelligence's Sweden Pharmaceutical Market Size Measured Against Other Published Estimates
Published market sizes for Sweden pharmaceuticals often differ, even when they appear to cover the same space. The gaps usually come down to what gets counted as a medicine sale, which channel is included, and whether the number is closer to manufacturer pricing or to end-user spending.
Veterinary medicines are kept out, and that item sits outside Mordor Intelligence's scope because the value is meant to reflect human prescription and OTC finished drugs only at ex-factory pricing, which avoids mixing in pharmacy markups and non-human demand pools.
Benchmark comparison
| Source | Market Size | Gaps in Research Methodology |
|---|---|---|
| Mordor Intelligence | USD 5.91 B (2025) | |
| Industry Association A | USD 6.45 B (2025) | Often reflects company-reported medicine sales that can include veterinary products and may be closer to list-value measures, which can sit above an ex-factory human-only view. |
| Trade Journal B | USD 5.20 B (2023) | May track retail pharmacy turnover more heavily, which can undercount hospital tenders and also varies with currency timing and the specific SEK to USD conversion window used. |
The table shows that most of the spread can be explained by scope and pricing basis, not by a different story on demand. When human-only finished medicines are valued consistently at ex-factory levels and then checked against channel signals, the result stays traceable to a few clear variables that can be repeated year to year.


Key Questions Answered in the Report
How big is the Sweden Pharmaceutical Market?
The Sweden Pharmaceutical Market size is expected to reach USD 6.21 billion in 2026 and grow at a CAGR of 5.08% to reach USD 7.96 billion by 2031.
Which therapeutic class holds the largest share?
Cardiovascular system drugs lead with 15.10% of Sweden pharmaceutical market share in 2025.
Who are the key players in Sweden Pharmaceutical Market?
Amgen Inc., Pfizer Inc., Orifarm Group A/S, Merck & Co., Inc. and Novartis AG are the major companies operating in the Sweden Pharmaceutical Market.
How fast are dermatology drugs growing in Sweden?
Dermatology therapies are forecast to rise at a 6.12% CAGR through 2031 on expanding biologic use
Page last updated on:


 Your data is secure and never sold or shared.


