Market Overview
| Study Period | 2020 - 2031 |
|---|---|
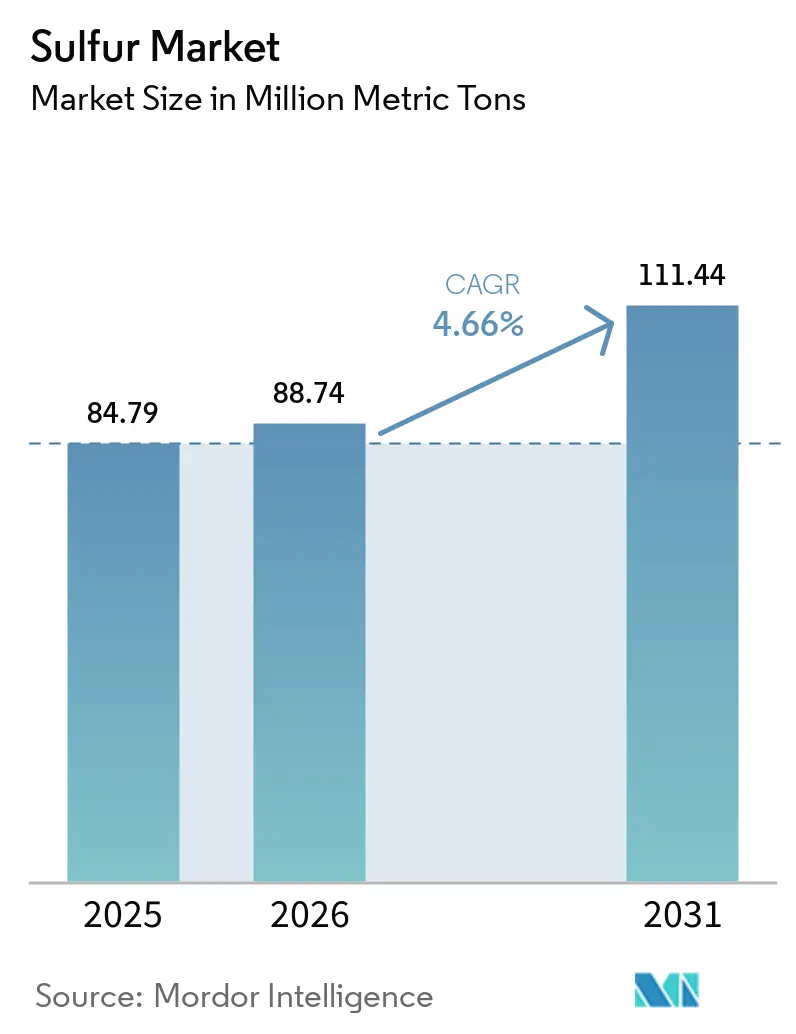
| Market Volume (2026) | 88.74 Million metric tons |
| Market Volume (2031) | 111.44 Million metric tons |
| Growth Rate (2026 - 2031) | 4.66% CAGR |
| Fastest Growing Market | Asia Pacific |
| Largest Market | Asia Pacific |
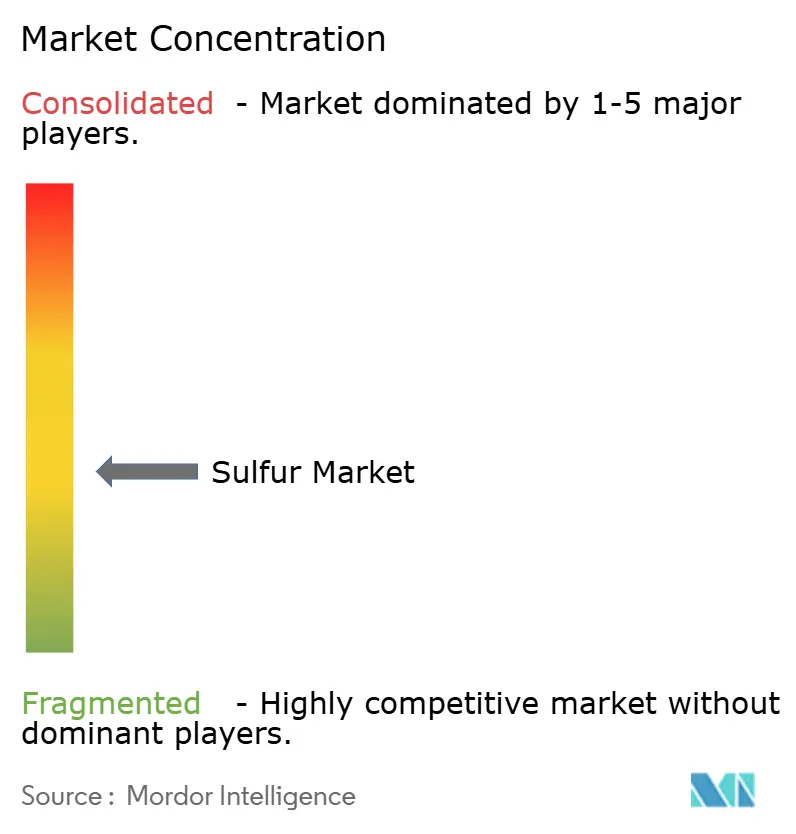
| Market Concentration | Medium |
Major Players *Disclaimer: Major Players sorted in no particular order Image © Mordor Intelligence. Reuse requires attribution under CC BY 4.0. | |
Sulfur Market Analysis by Mordor Intelligence
The Sulfur Market size was valued at 84.79 Million metric tons in 2025 and estimated to grow from 88.74 Million metric tons in 2026 to reach 111.44 Million metric tons by 2031, at a CAGR of 4.66% during the forecast period (2026-2031). Ongoing fertilizer consumption, refinery output tied to ultra-low-sulfur diesel (ULSD) mandates, and early-stage battery innovation keep the sulfur industry on a steady expansion path even as environmental rules tighten. Asia-Pacific remains the geographic anchor, supplying and consuming the largest volumes thanks to population-driven food demand, refinery capacity, and industrial diversification. Solid-form material dominates logistics because it avoids the costly heating, specialized tanks, and safety controls required for molten handling. Competitive behavior skews toward integrated oil and gas conglomerates that treat sulfur recovery as a cost-offsetting by-product, yet premium outlets in lithium-sulfur batteries and sulfur-modified construction materials are motivating smaller specialists to build high-purity capacity. Persistent SOx-emission caps and high-cost molten logistics pose near-term hurdles, but they do not dilute the five-year growth outlook for the sulfur industry.
Key Report Takeaways
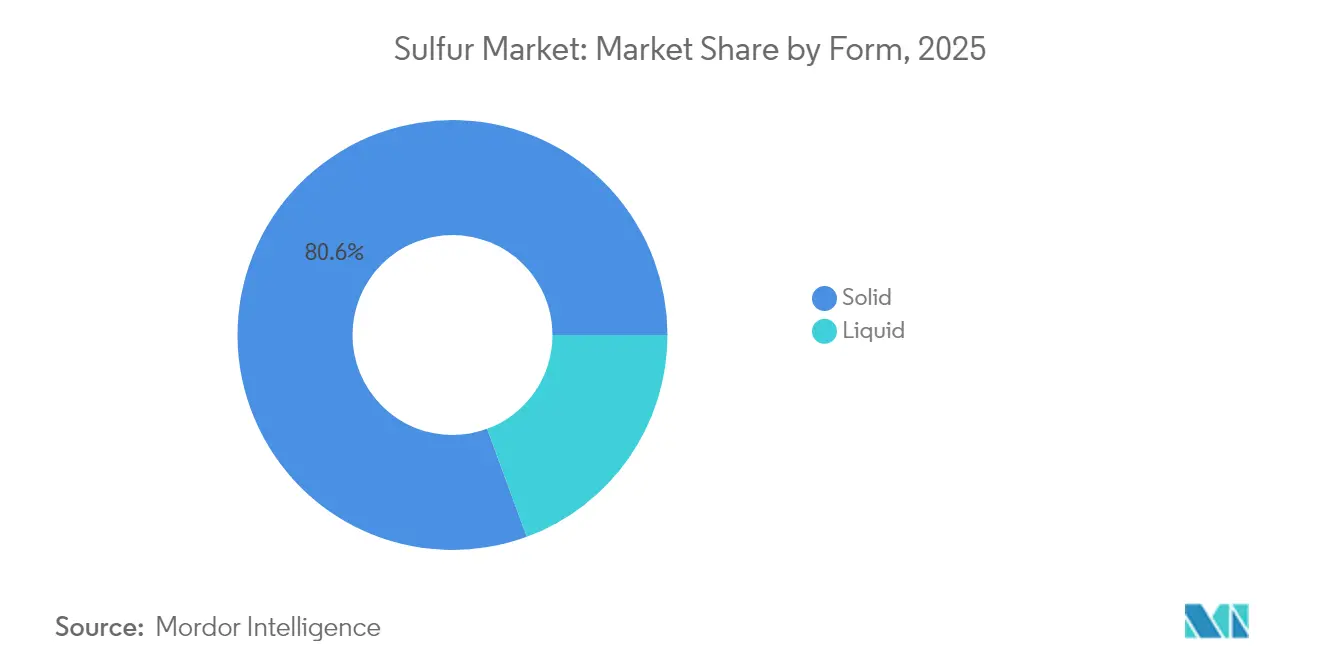
- By form, solid products accounted for 80.62% of the sulfur market share in 2025 and also posted the fastest growth with a CAGR of 5.08%.
- By finishing technology, granulation held 74.39% of the sulfur market size in 2025 and is tracking a 5.21% CAGR through 2031.
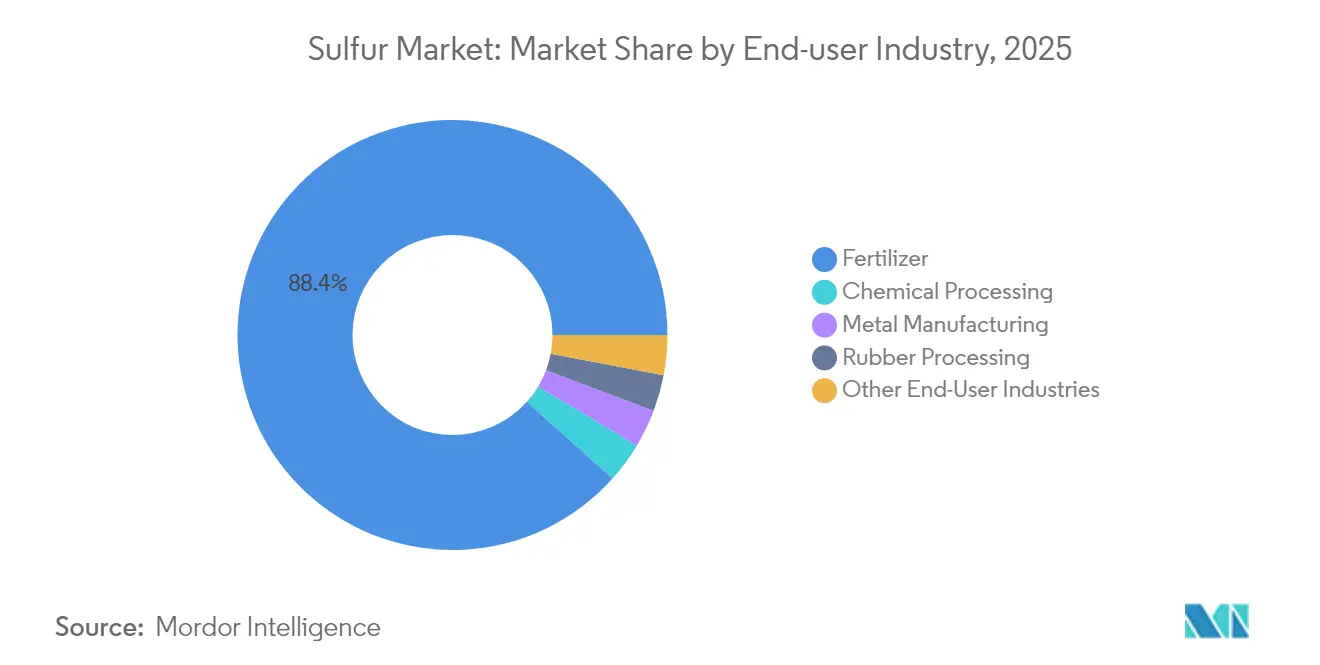
- By end-user industry, fertilizers commanded 88.36% revenue in 2025, while chemical processing is advancing at a 5.40% CAGR to 2031.
- By geography, Asia-Pacific carried 39.40% volume share in 2025 and is projected to grow at a 5.55% CAGR over the forecast period.
Note: Market size and forecast figures in this report are generated using Mordor Intelligence’s proprietary estimation framework, updated with the latest available data and insights as of 2026.
Global Sulfur Market Trends and Insights
Drivers Impact Analysis*
| Drivers | (~) % Impact on CAGR Forecast | Geographic Relevance | Impact Timeline |
|---|---|---|---|
| Rising demand from fertilizer manufacturing | +1.8% | Global with APAC core concentration | Long term (≥ 4 years) |
| Expansion of ULSD refining capacity | +1.2% | North America and Europe; spill-over to APAC | Medium term (2-4 years) |
| Increasing sulfur usage in rubber vulcanization | +0.9% | APAC hubs; MEA emerging | Medium term (2-4 years) |
| Commercialization of lithium-sulfur batteries | +0.7% | North America and EU early adoption; APAC scale-up | Long term (≥ 4 years) |
| Adoption of sulfur-modified asphalt and concrete | +0.4% | EU leadership; North America following | Long term (≥ 4 years) |
| Source: Mordor Intelligence | |||


Rising Demand from Fertilizer Manufacturing
Global food-security targets keep fertilizer output high, anchoring 88.96% of sulfur market demand in 2025. India earmarked USD 68 billion to subsidize phosphate and potash nutrients in 2024, a policy that pulled large sulfur volumes into controlled-release blends. China’s modernization drive supports sulfur supplementation to upgrade depleted soils, while palm-oil acreage in Indonesia and Malaysia lifts regional nutrient intensity. Precision agriculture systems require sulfur-rich micronutrient formulations, which raise the sulfur content per fertilizer unit and create a dispersed demand base that shields the sulfur market from regional shocks.
Expansion of Ultra-Low-Sulfur Diesel Refining Capacity
ULSD legislation forces refiners to extract sulfur from fuel, generating a supply that flows back into the sulfur market. New desulfurization units in Saudi Arabia’s Jazan refinery added 650,000 metric tons in 2024, and Marathon Petroleum’s Galveston Bay expansion supplied another 420,000 metric tons. North American and European refiners continue to invest, ensuring steady by-product output through 2030 and improving downstream access in regions that once struggled with limited sulfur availability.
Increasing Sulfur Usage in Rubber Vulcanization
Tire production rebounded to 1.8 billion units in 2024, absorbing 1.2 million metric tons of sulfur for vulcanization in the sulfur industry. Electric-vehicle tires need stronger compounds, driving higher sulfur ratios per unit and expanding the additive’s penetration in performance rubber. APAC tire plants, especially in Thailand and Indonesia, increased capacity 12% in 2024, strengthening regional sulfur consumption and minimizing freight costs tied to long-distance imports.
Commercialization of Lithium-Sulfur Batteries for E-Mobility
Lithium-sulfur designs promise energy densities of 2,600 Wh/kg, far above lithium-ion’s 350 Wh/kg limit. Lyten’s USD 1 billion plant in Nevada will open in 2027 with 10 GWh capacity, pulling 15,000 metric tons of high-purity sulfur per year at prices 40-60% above commodity levels. Automotive OEMs extend research and development budgets toward sulfur-based cathodes, supporting a premium niche that lifts overall sulfur market value as commercialization scales.
Restraints Impact Analysis*
| Restraints | (~) % Impact on CAGR Forecast | Geographic Relevance | Impact Timeline |
|---|---|---|---|
| Stringent SOx-emission regulations | -1.1% | EU leadership; North America following; APAC selective | Short term (≤ 2 years) |
| High logistics and handling cost for molten sulfur | -0.8% | Global, acute in landlocked regions | Medium term (2-4 years) |
| Declining sulfur recovery as refineries decarbonize | -0.6% | EU early adoption; North America gradual | Long term (≥ 4 years) |
| Source: Mordor Intelligence | |||
Stringent SOx-Emission Regulations Across Regions
The EU Industrial Emissions Directive mandates 95% SOx abatement in sulfuric-acid plants by 2030. The U.S. National Ambient Air Quality Standards add USD 2-4 per metric ton in monitoring and scrubber costs, nudging small processors toward consolidation[1]U.S. Environmental Protection Agency, “Sulfur Dioxide Air Quality Standards,” epa.gov. China’s tighter stack-emission limits introduce fines at 10% of revenue for non-compliance. These rules raise capital barriers that slow capacity additions, trimming growth momentum for the sulfur market in the near term.
High Logistics and Handling Cost for Molten Sulfur
Molten sulfur requires heated tanks and dedicated railcars, inflating freight bills by USD 15-25 per metric ton versus solid forms. Only 23 ports worldwide can load molten material, causing routing detours and inventory costs that cut margins for inland fertilizer makers. Road rules classify molten sulfur as hazardous, adding permit fees and restricting trucking lanes, which presses buyers to favor solid product streams in the sulfur industry.
*Our forecasts treat driver/restraint impacts as directional, not additive. The impact forecasts reflect baseline growth, mix effects, and variable interactions.
Segment Analysis
By Form: Solid Dominance Driven by Handling Efficiency
Solid products represented 80.62% of the sulfur market share in 2025 and are tracking a 5.08% CAGR to 2031. Handling ease, lower insurance premiums and the absence of heated storage explain the preference among fertilizer producers lacking specialized infrastructure. The sulfur market size for solid material is poised to rise further as automated loading and dust-suppression upgrades lower operational risks.
Granular and prilled formats also improve product integrity during transport, align with ISO 14001 management systems and reduce environmental exposure. Liquid sulfur stays limited to large sulfuric-acid complexes where molten feed integrates directly into process lines, but its high logistics bill caps broad adoption. Solid sulfur therefore keeps its leadership as emerging battery and construction users also specify granulated inputs.


By Finishing-Process Technology: Granulation Leads Through Operational Advantages
Granulation controlled 74.39% of the sulfur industry in 2025 and is expanding at 5.21% CAGR. Uniform particle size, reduced dust and compatibility with automated conveyors underpin its leadership. The sulfur market size tied to granulation will extend as modular systems enable phased capacity boosts in cost-sensitive APAC plants.
Pastilles technology addresses rapid-dissolution needs in liquid fertilizers, while prilling remains the low-capex option for base-grade product. Coated granules commanding 15-20% premiums have appeared, targeting controlled nutrient release in precision farming. Such innovations keep granulation at the forefront of the sulfur market expansion.
By End-User Industry: Fertilizers Maintain Dominance Amid Chemical Processing Growth
Fertilizers absorbed 88.36% of total demand in 2025, reflecting sulfur’s irreplaceable role in phosphate acids and soil-pH management. The sulfur market size tied to fertilizers will inch upward at stable rates given the inelastic nature of food production. Chemical processing is charting a 5.40% CAGR as sulfuric acid for battery cathodes and specialty chemicals elevates purity requirements.
Metal-manufacturing uses focus on flotation agents in copper and zinc mines, where regional ore projects in South America and Africa sustain baseline demand. Rubber processing benefits from automotive output rebounds, and sulfur-modified asphalt adds niche growth. Each segment increases diversification, lowering revenue volatility for the sulfur industry.
Geography Analysis
Asia-Pacific held 39.40% of global volume in 2025 and is pacing a 5.55% CAGR to 2031. China consumed 28.5 million metric tons, driven by phosphate fertilizer targets aligned with grain self-sufficiency goals. India’s farm-support schemes and Southeast Asian plantation crops push fertilizer tonnage upward, making the region the core growth engine of the sulfur market.
North America is propelled by ULSD investments and lithium-sulfur battery plants in Nevada and Texas, placing incremental pull on regional supply, anchoring a balanced demand-supply position. Europe advances on precision farming and regulatory shifts that favor sulfur-based soil additives over synthetic chemicals. Middle East and Africa expand refinery recovery and promote agriculture programs that enlarge fertilizer use, widening geographic diversification for the sulfur industry.


Competitive Landscape
The market is moderately fragmented in nature. Integrated oil majors such as Saudi Aramco, Shell, and Gazprom dominate supply through refinery by-product recovery, achieving cost advantages of 15-25% versus standalone miners. Automation, ISO 14001 compliance, and continuous-monitoring technology protect incumbents from new entrants that face steep CAPEX for environmental systems. However, specialized firms targeting lithium-sulfur battery cathodes and sulfur-modified materials are carving profitable niches where purity, particle morphology, and trace-metal limits fetch premium prices. Partnerships between refiners and advanced-material startups illustrate a shift from commodity focus toward value-added downstream integration inside the sulfur market.
Sulfur Industry Leaders
ADNOC
China Petroleum & Chemical Corporation (Sinopec)
Gazprom International Limited
Saudi Arabian Oil Co.
Shell plc
- *Disclaimer: Major Players sorted in no particular order

Recent Industry Developments
- June 2025: The Indian government imposed anti-dumping duties on imports of insoluble sulfur from China and Japan to shield local producers.
- June 2025: Flexsys raised insoluble sulfur prices in India by USD 0.25/kg, citing raw-material inflation and heightened research and development spending.


Global Sulfur Market Report Scope
Sulfur is a multivalent non-metal, abundant, tasteless, and odorless. In its native form, sulfur is a yellow crystalline solid. In nature, it occurs as a pure element or as sulfide and sulfate minerals.
The sulfur market is segmented by form, technology (finishing process), end-user industry, and geography. By form, the market is segmented into solid and liquid. By technology, the market is segmented into granules, pastilles, and prilling. By end-user industry, the market is segmented into fertilizer, chemical processing, metal manufacturing, rubber processing, and other end-user industries. The report also covers the market size and forecasts for the sulfur market in 16 countries across major regions. For each segment, the market sizing and forecasts have been done on the basis of volume (million metric tons).
By Form
| Solid |
| Liquid |
By Finishing-Process Technology
| Granules |
| Pastilles |
| Prilling |
By End-User Industry
| Fertilizer |
| Chemical Processing |
| Metal Manufacturing |
| Rubber Processing |
| Other End-User Industries |
By Geography
| Asia-Pacific | China |
| India | |
| Japan | |
| South Korea | |
| ASEAN Countries | |
| Rest of Asia-Pacific | |
| North America | United States |
| Canada | |
| Mexico | |
| Europe | Germany |
| United Kingdom | |
| Italy | |
| France | |
| Russia | |
| Rest of Europe | |
| South America | Brazil |
| Argentina | |
| Rest of South America | |
| Middle-East and Africa | Saudi Arabia |
| South Africa | |
| Rest of Middle-East and Africa |
| By Form | Solid | |
| Liquid | ||
| By Finishing-Process Technology | Granules | |
| Pastilles | ||
| Prilling | ||
| By End-User Industry | Fertilizer | |
| Chemical Processing | ||
| Metal Manufacturing | ||
| Rubber Processing | ||
| Other End-User Industries | ||
| By Geography | Asia-Pacific | China |
| India | ||
| Japan | ||
| South Korea | ||
| ASEAN Countries | ||
| Rest of Asia-Pacific | ||
| North America | United States | |
| Canada | ||
| Mexico | ||
| Europe | Germany | |
| United Kingdom | ||
| Italy | ||
| France | ||
| Russia | ||
| Rest of Europe | ||
| South America | Brazil | |
| Argentina | ||
| Rest of South America | ||
| Middle-East and Africa | Saudi Arabia | |
| South Africa | ||
| Rest of Middle-East and Africa | ||


Key Questions Answered in the Report
What is the expected global demand for sulfur in 2031?
The sulfur market is projected to reach 111.44 million metric tons by 2031.
Which region contributes the most to sulfur consumption?
Asia-Pacific leads with 39.40% share in 2025 and remains the fastest-growing region through 2031.
Why does solid sulfur dominate logistics?
Solid form avoids costly heated tanks and hazardous-material permits, lowering insurance and freight expenses.
How are lithium-sulfur batteries influencing demand?
New gigafactories will consume high-purity sulfur at premium prices, adding a growth channel beyond fertilizer uses.
What is the main regulatory hurdle for sulfur producers?
Stringent SOx-emission standards increase scrubber and monitoring costs, especially in the EU and United States.
Which finishing technology holds the largest share?
Granulation technology controlled 74.39% of processed sulfur volume in 2025 due to superior handling benefits.
Page last updated on:


