
Market Overview
| Study Period | 2020 - 2031 |
|---|---|
| Market Size (2026) | USD 12.38 Billion |
| Market Size (2031) | USD 16.07 Billion |
| Growth Rate (2026 - 2031) | 5.36 % |
| Fastest Growing Market | Asia Pacific |
| Largest Market | North America |
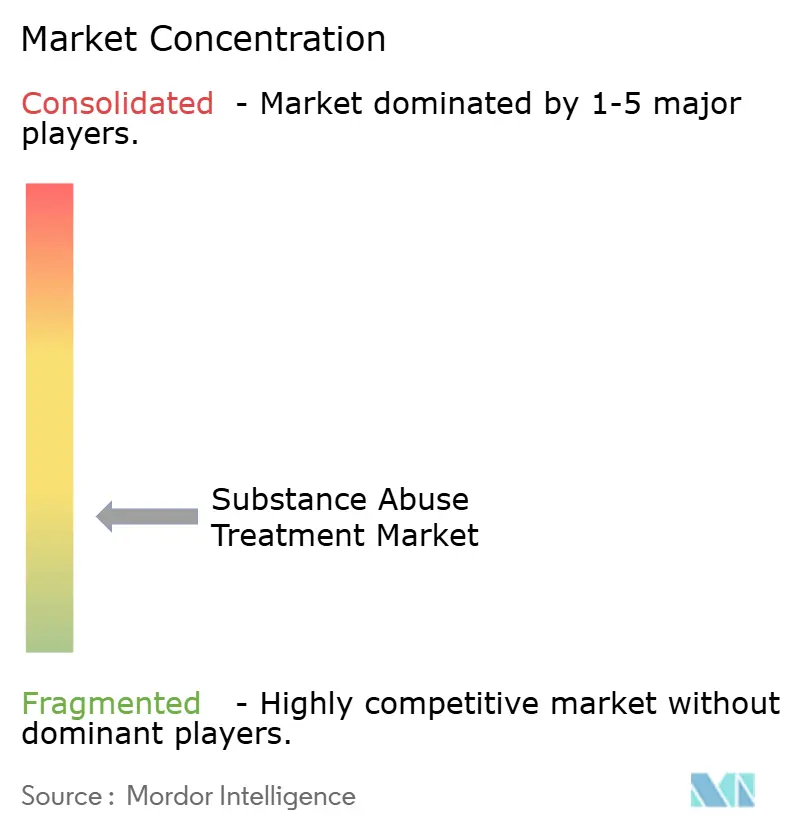
| Market Concentration | Low |
Major Players *Disclaimer: Major Players sorted in no particular order Image © Mordor Intelligence. Reuse requires attribution under CC BY 4.0. | |
Substance Abuse Treatment Market Analysis by Mordor Intelligence
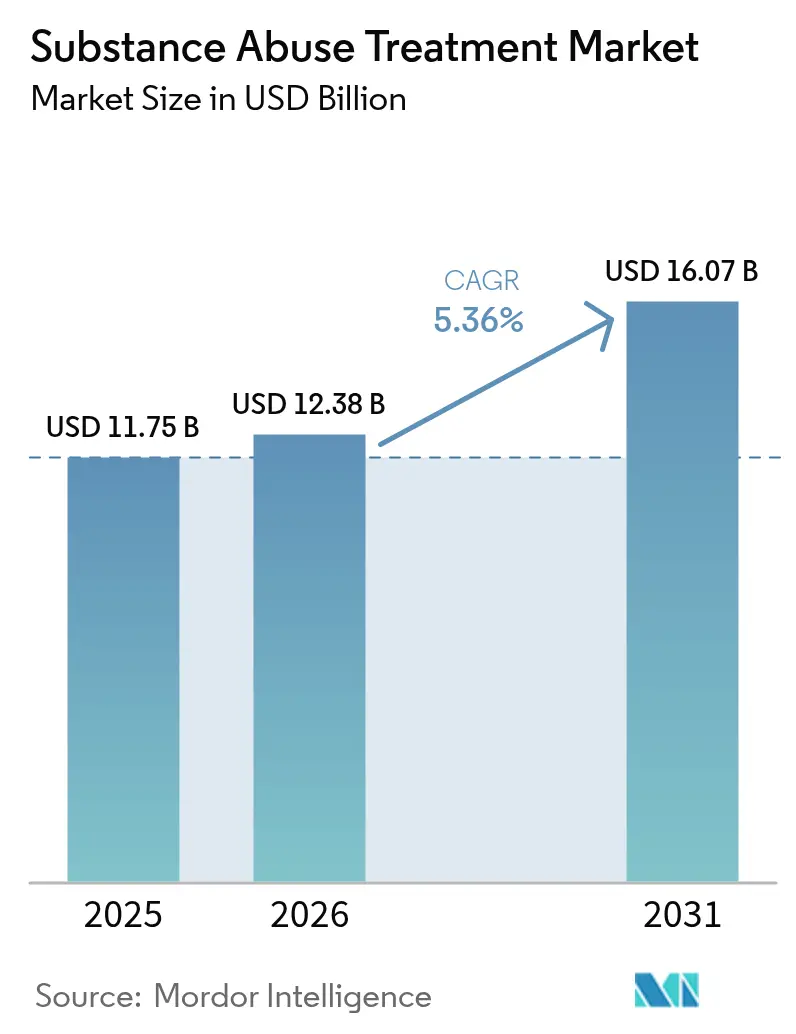
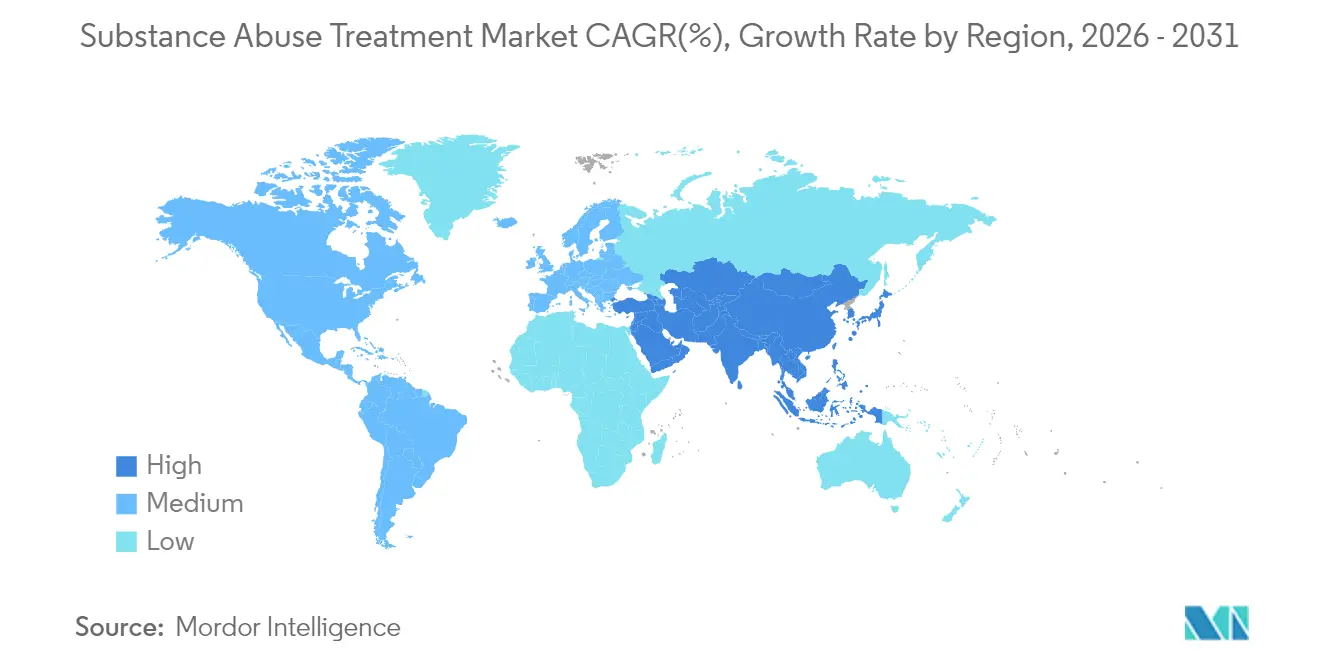
substance abuse treatment market size in 2026 is estimated at USD 12.38 billion, growing from 2025 value of USD 11.75 billion with 2031 projections showing USD 16.07 billion, growing at 5.36% CAGR over 2026-2031. Growth rests on unprecedented public-sector funding such as the USD 46.8 million behavioral-health grants announced in May 2024; and regulatory modernization that removed the Drug Addiction Treatment Act waiver in October 2024, letting any qualified clinician prescribe buprenorphine[1]Source: U.S. Federal Register, “Medications for the Treatment of Opioid Use Disorder; Final Rule,” federalregister.gov . These forces are re-shaping competitive strategy: technology firms now partner with clinics to deploy FDA-cleared prescription digital therapeutics, while insurers rapidly widen reimbursement under the parity rules that came into full effect in January 2025. Asia-Pacific’s 7.15% CAGR underlines a pivot from infrastructure building to integrated care, showcased by China’s 191 detoxification pilots that treated 1.7 million people by end-2023.
Key Report Takeaways
- By product type, pharmacotherapy led with 43.12% of substance abuse treatment market share in 2025, whereas digital therapeutics is projected to grow at 6.16% CAGR through 2031.
- By treatment setting, outpatient services commanded 52.08% share of the substance abuse treatment market size in 2025, while telehealth is expanding at 6.72% CAGR to 2031.
- By substance dependency, alcohol use disorder accounted for 31.05% share of the substance abuse treatment market in 2025; opioid use disorder registers the highest projected CAGR at 6.01% to 2031.
- By end user, government and non-profit facilities held 33.12% share in 2025, whereas workplace programs are set to advance at 5.77% CAGR through 2031.
- By geography, North America controlled 44.05% of market revenue in 2025; Asia-Pacific is the fastest-growing region at 6.88% CAGR through 2031.
Note: Market size and forecast figures in this report are generated using Mordor Intelligence’s proprietary estimation framework, updated with the latest available data and insights as of 2026.
Market Trends and Insights
Drivers Impact Analysis of Substance Abuse Treatment Market*
| Driver | % Impact on CAGR Forecast | Geographic Relevance | Impact Timeline |
|---|---|---|---|
| Rising prevalence of opioid & alcohol use disorders | +1.20% | Global, concentrated in North America | Medium term (2-4 years) |
| Expansion of insurance & government funding | +0.90% | North America & EU, expanding to APAC | Short term (≤ 2 years) |
| Wider adoption of medication-assisted treatment (MAT) | +0.80% | Global, led by North America | Medium term (2-4 years) |
| Employer-sponsored recovery benefits | +0.40% | North America, emerging in EU | Long term (≥ 4 years) |
| AI-enabled early OUD detection in EHRs | +0.30% | North America, pilot programs in EU | Long term (≥ 4 years) |
| Demographic-specific & culturally-tailored programs | +0.20% | APAC core, spill-over to global markets | Long term (≥ 4 years) |
| Source: Mordor Intelligence | |||
Rising Prevalence of Opioid & Alcohol Use Disorders
In 2023, 48.5 million Americans aged 12 or older had a substance use disorder, but only 23.6% accessed treatment. The resulting treatment gap fuels sustained demand as policymakers shift from punitive to medical models. Younger demographics intensify service redesign, illustrated by China’s youth-focused detoxification centers. Polysubstance fatalities—particularly stimulants co-used with opioids—necessitate protocols that address multiple dependencies at once. The WHO’s updated opioid-dependence guidelines, scheduled for October 2025, elevate opioid agonist maintenance to global standard of care[2]Source: World Health Organization, “Guidelines on Opioid Dependence Treatment and Overdose Prevention,” who.int .
Expansion of Insurance & Government Funding
Parity enforcement effective January 2025 obliges U.S. health plans to prove equal coverage for behavioral care, removing prior-authorization hurdles for addiction treatment. Complementing regulation, the Biden administration’s USD 1.48 billion State Opioid Response grants emphasize evidence-based practice and underserved communities. Internationally, WHO’s May 2025 controlled-medicine guidance pushes low- and middle-income countries to balance opioid access and diversion control.
Wider Adoption of Medication-Assisted Treatment (MAT)
Revised 42 CFR Part 8 rules eliminated the one-year opioid-use history requirement and allowed telehealth initiation of MAT in October 2024. Evidence supports expansion: the ADAPT-2 trial showed a 27% response for naltrexone-bupropion in methamphetamine use disorder, while continuous MAT halves overdose mortality relative to abstinence-only care.
Employer-Sponsored Recovery Benefits
U.S. productivity losses from addiction reach USD 442 billion annually. Corporations respond with recovery-ready workplace programs that blend flexible scheduling, peer coaching, and digital wellbeing portals. Kaiser Permanente reports higher retention and lower absenteeism among employees in recovery, positioning employer initiatives as a high-growth channel.
Restraints Impact Analysis of Substance Abuse Treatment Market*
| Restraint | % Impact on CAGR Forecast | Geographic Relevance | Impact Timeline |
|---|---|---|---|
| Social stigma limiting treatment uptake | -0.70% | Global, particularly acute in APAC | Medium term (2-4 years) |
| Shortage of certified addiction specialists | -0.50% | Global, most severe in rural North America | Long term (≥ 4 years) |
| Fragmented reimbursement for digital therapeutics | -0.30% | North America & EU, emerging in APAC | Short term (≤ 2 years) |
| Zoning opposition to new residential centers | -0.20% | North America, localized urban markets | Medium term (2-4 years) |
| Source: Mordor Intelligence | |||
Social Stigma Limiting Treatment Uptake
94.7% of U.S. adults with a substance use disorder do not seek care, chiefly because they deny a need for treatment despite clinical criteria. Stigma is deeply cultural: Asian clients often avoid formal programs to protect family reputation, pushing providers to adopt family-oriented and community-based models. Digital anonymity helps but cannot fully erase entrenched attitudes.
Shortage of Certified Addiction Specialists
WHO surveillance shows 37% of countries lack postgraduate addiction-medicine training programs who.int. Rural U.S. counties exemplify the gap; even after DATA-waiver repeal, prescribers need mentoring and decision-support tools. AI-based clinical aids lower diagnostic burden—NIH studies found automated OUD screening cut readmissions by 47%—yet full deployment hinges on funding for training and broadband.
*Our forecasts treat driver/restraint impacts as directional, not additive. The impact forecasts reflect baseline growth, mix effects, and variable interactions.
Substance Abuse Treatment Market Segment Analysis
By Product Type:
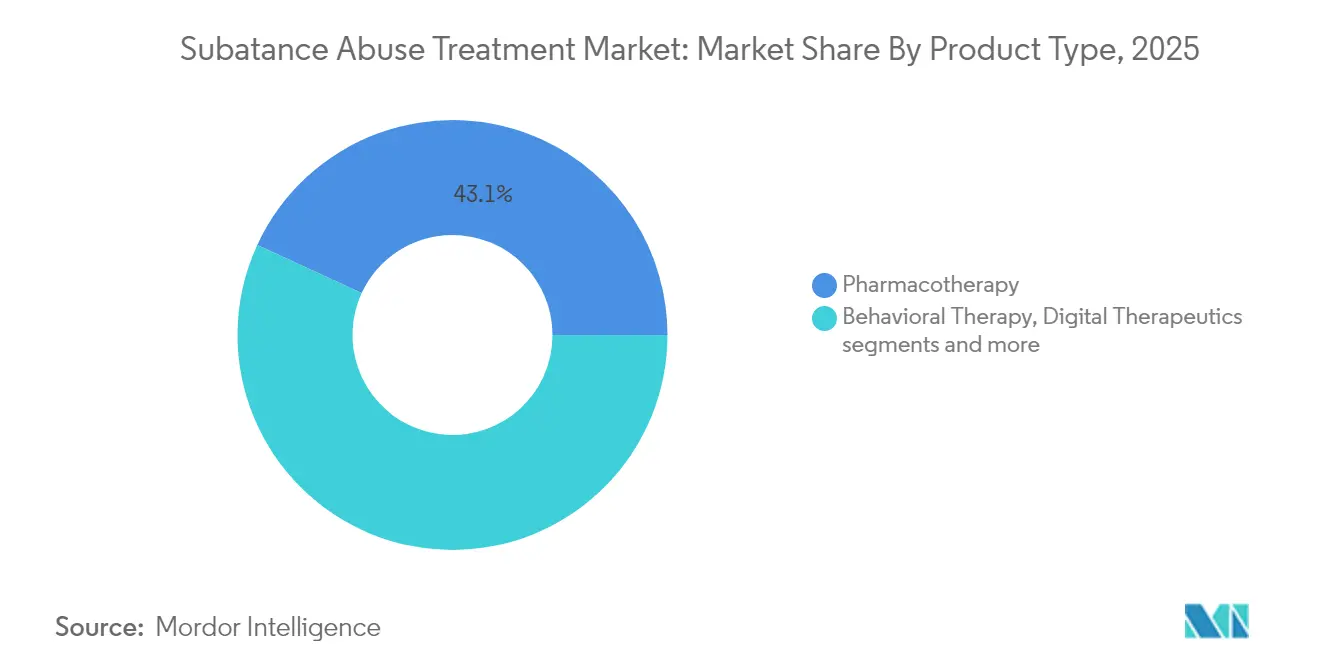
Integrated Therapeutics Redefine CarePharmacotherapy remains the largest revenue generator, holding 43.12% of substance abuse treatment market share in 2025. Methadone, buprenorphine, and extended-release naltrexone anchor clinical guidelines and receive widening reimbursement under parity enforcement. Digital therapeutics, however, is the fastest climber at 6.16% CAGR through 2031. FDA-cleared apps such as reSET-O pair cognitive behavioral therapy with real-time adherence tracking, permitting clinicians to monitor dosage logs and craving scores remotely. Insurers increasingly bundle software prescriptions with medication bills, ensuring revenue capture without direct facility expansion. Behavioral therapy retains relevance as the human connective tissue that sustains engagement and addresses trauma; culturally-tailored cognitive restructuring is critical for younger cohorts and minority groups whose relapse triggers differ from historical norms. The substance abuse treatment market benefits from converging data streams—wearable biosignals, electronic health record (EHR) alerts, and patient-reported outcomes—that feed predictive analytics. NIH-supported pilots show AI-driven dashboards reduce hospital readmissions, reinforcing payers’ interest in data-validated interventions. Downstream, combination protocols—long-acting injectable buprenorphine plus prescription digital therapeutic coaching—signal a hybrid future where care teams orchestrate medication, software, and counseling into a singular treatment pathway.
A parallel monetization shift is unfolding. Software-as-a-medical-device (SaMD) companies license platforms to health systems, collecting per-member-per-month fees rather than episodic therapy margins. Pharma firms are co-packaging adherence apps with new formulations, betting that digital support will boost refill persistence and protect patent value. Investors deem the blended model more defensible than stand-alone clinics, amplifying merger activity between tele-MAT providers and analytics startups. This synergy underlines how the substance abuse treatment market is migrating from unit-based payments toward longitudinal value contracts tied to relapse-free days and workforce productivity metrics.



By Treatment Setting:
Virtual Care Mainstreams Outpatient ModelsOutpatient programs provided 52.08% of total revenue in 2025, driven by clinical guidelines that favor continuous, community-based MAT over expensive inpatient stays. The DEA’s telemedicine flexibility—now extended through December 2025—lets clinicians prescribe buprenorphine after virtual evaluation, collapsing geographical barriers and accelerating telehealth uptake at a 6.72% CAGR. Clinics re-engineer workflows for hybrid care: initial stabilization may occur onsite, followed by digital check-ins, synchronous therapy, and asynchronous medication refills. Research funded by HHS confirms tele-MAT maintains parity with in-person retention and satisfaction scores.
Cost dynamics reinforce the trend. Payers observe that a 12-week virtual intensive outpatient episode costs materially less than residential admission yet yields equivalent abstinence days. Providers leverage remote urine-drug testing kits and computer-vision pill counts to satisfy compliance audits. Rural health systems capitalize by embedding addiction specialists via e-consult portals, bypassing recruitment bottlenecks. The substance abuse treatment market size for hybrid outpatient services is projected to expand at 6.58% annually, reflecting payer preference for capitated models that bundle telehealth, pharmacy, and lab services. Brick-and-mortar operators respond by converting under-utilized beds into community hubs for group therapy and peer-led recovery coaching, aligning physical assets with digital service layers.
By Substance Dependency:
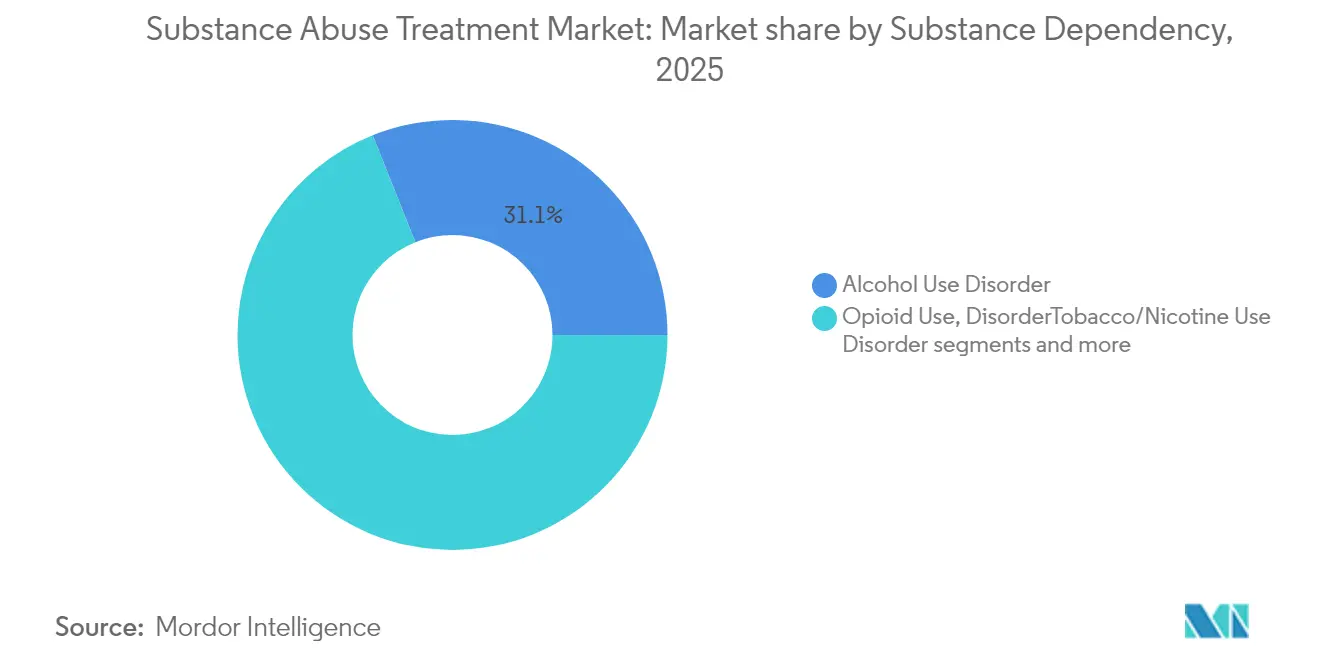
Opioid Innovation Outpaces Alcohol DominanceAlcohol use disorder remained the largest pathology, representing 31.05% of global revenue in 2025. Yet opioid use disorder posts the quickest climb—6.01% CAGR to 2031—propelled by regulatory easing and novel treatments. Eliminating the waiver for buprenorphine prescribing instantly broadened eligible clinician ranks from specialists to primary care, multiplying access points. Simultaneously, research into non-opioid adjuncts such as lofexidine, acquired by BioCorRx in 2025, widens detox options without precipitating respiratory depression. Methamphetamine-opioid polysubstance cases complicate care trajectories; UCLA’s ADAPT-2 data suggest pharmacologic synergy for stimulant withdrawal, spurring guideline revisions that integrate multi-drug regimens.
Tobacco and synthetic cannabinoid dependencies draw less venture funding but hold strategic significance for population-health contracts. Employers seek bundled cessation-plus-recovery offerings that tackle nicotine, alcohol, and opioids in one benefits line. Regional profiles diverge: fentanyl dominates U.S. overdose statistics, whereas emerging synthetic opioids pose rising threats in India’s under-regulated markets, prompting WHO to recommend swift scheduling under international control who.int. Tailoring pharmacologic and psychosocial protocols to regional substance mixes reinforces the need for agile, data-driven program design within the substance abuse treatment market.
By End User:
Public Facilities Anchor Access as Employers Accelerate AdoptionGovernment and non-profit centers accounted for 33.12% of 2025 revenue, reflecting their safety-net role for the uninsured. Expansion of the Certified Community Behavioral Health Clinic model—adopted by 10 new states in 2024—extends wrap-around services including transportation and peer navigation. Public-sector demand often spikes during economic downturns, bolstering the recession resistance of the substance abuse treatment market. Meanwhile, employer programs record the fastest trajectory at 5.77% CAGR. Parity enforcement, combined with evidence that workers in recovery have higher retention, pushes large self-insured firms to contract directly with digital MAT vendors, negotiate Center-of-Excellence networks, and include family counseling benefits. ADA provisions protect recovering employees, legitimizing accommodations such as flexible scheduling for therapy sessions.
Private for-profit chains refine positioning by offering specialized tracks—perinatal addiction, veterans, LGBTQ+ populations—supported by outcome guarantees attractive to value-based contracts. Correctional institutions, while outside mainstream insurance flows, represent a pivotal relapse-reduction opportunity; drug courts backed by federal grants increasingly mandate MAT instead of incarceration, creating new demand channels. Across all end users, data integration with state prescription drug monitoring programs is now baseline, raising the compliance bar and differentiating providers with robust health-IT investments.
Geography Analysis
North America Substance Abuse Treatment Market
North America captured 44.05% of total revenue in 2025, underpinned by mature insurance coverage, robust prescribing capacity, and prompt adoption of FDA-authorized digital therapeutics. The Mental Health Parity Act’s 2025 enforcement milestone compels commercial plans covering 175 million lives to remove non-quantitative limits such as fail-first policies, immediately lifting utilization ceilings. Federal funding remains pivotal: USD 1.48 billion in State Opioid Response grants finance naloxone distribution, peer recovery coaches, and mobile MAT units in high-overdose counties. Canada’s publicly-funded systems lag in digital-therapy reimbursement yet pioneer safe-supply pilots, while Mexico expands cross-border tele-MAT partnerships to reach remote regions.
APAC Substance Abuse Treatment Market
Asia-Pacific is the fastest-growing territory, advancing at 6.88% CAGR through 2031. China’s deployment of 191 detoxification centers serving 1.7 million patients by end-2023 exemplifies state-driven infrastructure scaling globaltimes.cn. Australia introduces nurse-prescribing of buprenorphine in rural zones, easing workforce scarcity. India confronts fentanyl spill-over risks, prompting draft rules for precursor surveillance and joint task forces with WHO. However, digital mental-health access gaps persist; broadband penetration and mental-health literacy remain uneven, necessitating mobile-first solutions and culturally-adapted content in local languages.
EMEA Substance Abuse Treatment Market
Europe occupies a middle ground, boasting universal coverage but facing fragmented reimbursement for digital therapeutics. Germany’s DiGA framework fast-tracks software-as-a-medical-device reimbursement, yet addiction apps constitute only 4% of listings. Workforce shortages—particularly psychiatrists trained in addiction—slow throughput in rural Scandinavia and Eastern Europe. Middle East & Africa show nascent yet accelerating demand; Saudi Arabia funds medically-supervised detox centers as part of Vision 2030, while South Africa pilots community-based harm-reduction projects aligned with WHO guidelines. Regional heterogeneity underscores the need for adaptable, evidence-backed models within the substance abuse treatment market.

Regulatory Landscape
Regulation for substance abuse treatment continues to move toward easier access to medication for opioid use disorder (MOUD) and broader telemedicine use, while privacy and controlled-substance compliance requirements remain tighter. In the United States, SAMHSA updates to 42 CFR Part 8 modernized opioid treatment program (OTP) standards and codified post-pandemic flexibilities, and DEA and HHS finalized rules that enable telemedicine prescribing of controlled substances for OUD with required checks, including state prescription drug monitoring program (PDMP) review. These changes broaden the number of care settings and clinician types that can deliver MOUD, reinforcing outpatient and virtual-first models.
Compliance requirements also raise operational and data-governance expectations across providers and their technology partners. The 42 CFR Part 2 final rule for confidentiality of substance use disorder patient records has a compliance deadline of February 16, 2026, pushing health systems, tele-MAT platforms, and digital therapeutics vendors to strengthen consent management, segment SUD records, and control data sharing. Funding policy remains a design input: SAMHSA guidance in July 2025 shifted federal funding direction toward comprehensive, multi-modal treatment and away from supplying certain harm-reduction items, affecting how grant-funded providers structure services and procure ancillary supplies.
Value Chain Analysis
The value chain covers regulated pharmaceutical manufacturing and distribution for controlled and non-controlled medications, along with service delivery through outpatient clinics, OTPs, hospitals, residential centers, telehealth providers, and employer-sponsored programs. Upstream, active pharmaceutical ingredient (API) manufacturers and contract development and manufacturing organizations (CDMOs) produce MOUD and adjunct therapies within a closed distribution environment governed by the Controlled Substances Act, with oversight by the DEA and FDA. Annual DEA manufacturing quotas and strict ordering controls influence supply planning, while serialization and traceability requirements under the Drug Supply Chain Security Act (DSCSA) increase documentation and system integration needs for manufacturers and distributors.
Midstream and downstream, wholesale distributors, specialty and retail pharmacies, and provider organizations manage dispensing and administration, including long-acting formulations, and continuity-of-care services. Diversion-control steps, such as suspicious order monitoring, PDMP integration, and automated order holds for anomalous purchasing patterns, have become embedded workflows that affect lead times, contracting, and technology spend. As tele-MAT and prescription digital therapeutics adoption rises, a parallel digital supply layer adds e-prescribing, identity verification, remote adherence monitoring, and integration with electronic health records, creating additional interoperability and privacy compliance checkpoints before providers expand virtual programs.
Competitive Landscape
Competitive intensity remains high as no single operator holds dominant share, and market entry barriers ease with virtual-first models. Traditional residential chains pivot toward specialized tracks and payer-tied outcome guarantees, while venture-backed tele-MAT startups exploit low fixed-asset bases. Teladoc Health’s USD 30 million acquisition of UpLift in May 2025 embeds psychiatric services into its BetterHelp platform, creating an end-to-end digital pathway from screening to medication management. NeuroFlow’s analytics suite integration with Intermountain Health’s risk model in January 2025 scales measurement-based care across 17 million covered lives, strengthening payer relationships.
AI and data assets increasingly separate leaders from followers. NIH-funded trials confirm that machine-learning algorithms embedded in EHRs can flag opioid-use disorder risk weeks before clinical diagnosis, enhancing prescriber outreach and insurer predictive modeling [3]Source: National Institutes of Health, “AI Screening for Opioid Use Disorder Associated with Fewer Hospital Readmissions,” nih.gov. Platform players bundle these analytics with tele-prescribing, drug-delivery logistics, and peer-support networks, delivering turnkey solutions attractive to self-insured employers. Facility consolidation remains selective; private equity targets niche centers with strong referral pipelines rather than large-scale roll-ups. With payment models shifting toward bundled and capitated contracts, the strategic race centers on demonstrating superior outcomes at lower total cost—a dynamic that rewards data-rich, tech-enabled operators in the substance abuse treatment market.
Substance Abuse Treatment Industry Leaders
Alkermes PLC
Mallinckrodt LLC
Cipla Ltd
GlaxoSmithKline PLC
Indivior PLC
- *Disclaimer: Major Players sorted in no particular order
Substance Abuse Treatment Market Companies Covered in this Report
- AstraZeneca
- Merck
- Roche
- Bristol-Myers Squibb
- Novartis
- Pfizer
- Eli Lilly and Company
- Amgen
- BeiGene
- Takeda Pharmaceuticals
- Regeneron
- Sanofi
- Daiichi Sankyo
- Johnson & Johnson
- Boehringer Ingelheim
- Innovent Biologics
- Exelixis
- Mirati Therapeutics
- Blueprint Medicines
- Zai Lab

Market Opportunities and Future Outlook
A near-term whitespace exists in scalable hybrid care models that extend treatment beyond facility catchment areas without relying entirely on new inpatient footprints. In 2026, providers showed concrete demand for virtual-intensive outpatient program (IOP) expansion and post-discharge continuity tools: Recovery Centers of America broadened its virtual IOP into states without physical locations, and Banyan Treatment Centers with HoloMD reported results from a 90-day pilot of an AI-supported monitoring platform for post-discharge recovery. These moves align with payer and employer interest in longitudinal management, particularly where specialist shortages and travel barriers limit in-person capacity.
Physical capacity additions also create localized opportunities where access gaps are documented, especially for Medicaid-eligible residential beds and step-down care pathways. In 2026, ABC Recovery Center announced a USD 27 million campus expansion in Indio, California, adding 120 licensed treatment beds, and the Seattle Indian Health Board prepared to open the 92-bed Thunderbird Treatment Center in Washington, expanding residential capacity for eligible populations. On the policy side, the SUPPORT for Patients and Communities Reauthorization Act (P.L. 119-44) extends multiple SUD-related program authorizations and workforce loan repayment elements through FY2030, supporting provider recruitment, training, and service-line buildouts where staffing is still the binding constraint.
Recent Industry Developments in Substance Abuse Treatment Market
- July 2026: Spero Health acquired CleanSlate Centers, expanding its office-based opioid treatment footprint to 128 locations across 10 states. The deal consolidates outpatient MOUD capacity and referral networks, strengthening payer contracting leverage across multi-state markets.
- May 2025: Teladoc Health acquired UpLift for USD 30 million to expand insurance-covered virtual therapy capabilities within BetterHelp. The acquisition deepens Teladoc’s pathway from screening to ongoing behavioral care, supporting integrated management for co-occurring substance use and mental health needs.
- February 2024: SAMHSA updated 42 CFR Part 8 opioid treatment program standards to modernize care delivery and codify key flexibilities adopted during the pandemic. The changes reduce operational friction for OTPs and support broader use of telehealth-enabled workflows alongside required compliance controls.


Substance Abuse Treatment Market Report Scope and Research Methodology
Market Definition and Coverage
This market covers clinical treatment used to help people reduce, stop, or manage substance use disorders, including medically guided therapies and structured care programs delivered through inpatient, outpatient, and supervised remote care.
Scope exclusions: Excludes standalone drug screening labs, non-clinical peer support that is not part of a treatment episode, and self-help apps that do not involve a certified caregiver.
Segments Covered in This Report
- By Histology
- Adenocarcinoma
- Squamous Cell Carcinoma
- Large Cell Carcinoma
- By Treatment Modality
- Surgery
- Radiation Therapy
- Chemotherapy
- Targeted Therapy
- Immunotherapy
- Radiopharmaceuticals
- By Drug Class
- EGFR TKIs
- ALK/ROS1/RET Inhibitors
- PD-1 / PD-L1 Inhibitors
- CTLA-4 & LAG-3 Inhibitors
- Antibody-Drug Conjugates (ADC)
- By Region
- North America
- United States
- Canada
- Mexico
- Europe
- Germany
- United Kingdom
- France
- Spain
- Italy
- Rest of Europe
- Asia-Pacific
- China
- India
- Japan
- South Korea
- Australia
- Rest of Asia Pacific
- Middle East and Africa
- GCC
- South Africa
- Rest of Middle East and africa
- South America
- Brazil
- Argentina
- Rest of South America
- North America
Data Sources, Market Sizing, and Validation
Desk Research
Desk research was used to build the starting demand picture and the rules for what counts as treated care. Public sources such as the CDC, SAMHSA, NIH and NIDA publications, and the WHO help map treated population signals, care pathways, and how substance categories are tracked over time.
We also reviewed payer and provider context using sources such as CMS releases, state and national public health dashboards, peer reviewed journals on treatment utilization and retention, and selected company filings and investor presentations for capacity and service mix indicators. For cross-checks, we used news and financial databases, import and export shipment-level data where it was relevant to medication supply signals, and patent databases to sanity check pipeline and adoption timing assumptions. The sources listed here are illustrative only, and many other public materials were also used for data collection, validation, and clarification.
Primary Interviews and Surveys
Primary work focused on interviews and structured surveys with treatment providers, clinicians, payers, and distribution stakeholders to validate how treatment episodes are defined, what is reimbursed, and how pricing changes are flowing through contracts. We also covered major regions so assumptions on capacity constraints, telehealth uptake, and therapy mix could be adjusted with local delivery realities before the model was finalized.
Distribution of primary research fieldwork respondents
| Company type | Respondent position | Region |
|---|---|---|
| Top tier: 29% | CXOs: 13% | APAC: 47% |
| Mid tier: 57% | Functional/Unit leaders: 27% | EMEA: 34% |
| Smaller Players: 14% | Managers: 60% | Americas: 19% |
Market-Sizing & Forecasting
Market sizing used a top-down build where treated population and care access indicators were translated into paid treatment episodes and then valued using blended pricing by setting. To keep the result practical, we corroborated the totals with selective bottom-up approximations, such as sampled provider capacity checks and a volume-by-average-price build for key therapy types, and then adjusted for gaps where reporting is thin.
Inputs were chosen because they can be tracked each year without relying on private billing files. Illustrative model drivers include treatment admission and discharge patterns, share of care delivered in inpatient versus outpatient settings, medication-assisted treatment penetration for opioid use disorder, telehealth adoption in supervised programs, reimbursement rate movement by payer type, and workforce capacity signals that can limit throughput. For forecasting, we used scenario analysis supported by expert views on policy stability, funding direction, and the expected pace of service mix change, followed by sensitivity checks around utilization and price progression.
Data Validation & Update Cycle
Outputs were validated through cross checks against independent signals, including treated prevalence direction, capacity indicators, and reimbursement trend markers, so the totals do not drift away from realistic care delivery. When variances appeared, we reviewed the underlying assumptions and ran targeted follow ups to confirm whether the issue was definitional or a real market shift.
Before sign-off, the model and calculations go through multi-step analyst review, including sanity checks on year-over-year movement at region level and major service settings. Reports are refreshed annually, and interim updates are made when material events occur, such as major reimbursement changes or policy shifts affecting access to care. Right before delivery, a final review pass is done so clients receive the most current view available.
Mordor Intelligence's Substance Abuse Treatment Market Size Compared With Other Published Estimates
Published market sizes for substance abuse treatment often differ because the counted services are not consistent, and the data series used for treated demand and pricing are not the same. Variations also show up when some studies mix treatment services with broader support offerings, or when the forecast path assumes faster policy and reimbursement expansion than what providers are seeing.
Standalone drug screening and lab-only testing revenues sit outside Mordor Intelligence's scope for this market, which typically narrows the total versus estimates that treat testing as part of the same spend pool. Differences also come from how telehealth is treated, whether only licensed and supervised digital therapeutics are included, and how average price is progressed when payer mix shifts year to year. Currency timing and refresh cadence add more spread because even small utilization changes can move the totals when applied at global scale.
Benchmark comparison
| Source | Market Size | Gaps in Research Methodology |
|---|---|---|
| Mordor Intelligence | USD 12.38 B (2026) | |
| Industry Publisher A | USD 11.60 B (2025) | Uses a therapeutics-led view that can undercount non-drug program revenue, and the base year and forecast window differ, which shifts pricing and utilization assumptions. |
| Industry Publisher B | USD 11.74 B (2024) | Uses a broader service revenue lens with a different historic year and faster near-term CAGR, so the implied utilization and price ramp can diverge from treated-episode based modeling. |
Taken together, the spread is mostly explained by what is counted as a paid treatment episode, whether testing or non-clinical services are rolled in, and which year anchors the pricing and utilization baseline. Our approach keeps the total traceable to treated demand signals, care setting mix, and realistic reimbursement progression, which makes it easier for buyers to reconcile differences and reuse the logic in updates.


Key Questions Answered in the Report
What is the current Substance Abuse Treatment Market size?
The Substance Abuse Treatment Market is projected to register a CAGR of 5.36% during the forecast period (2026-2031)
Who are the key players in Substance Abuse Treatment Market?
Alkermes PLC, Mallinckrodt LLC, Cipla Ltd, GlaxoSmithKline PLC and Indivior PLC are the major companies operating in the Substance Abuse Treatment Market.
Which is the fastest growing region in Substance Abuse Treatment Market?
Asia Pacific is estimated to grow at the highest CAGR over the forecast period (2026-2031).
Which region has the biggest share in Substance Abuse Treatment Market?
In 2025, the North America accounts for the largest market share in Substance Abuse Treatment Market.
What years does this Substance Abuse Treatment Market cover?
The report covers the Substance Abuse Treatment Market historical market size for years: 2019, 2020, 2021, 2022, 2023 and 2024. The report also forecasts the Substance Abuse Treatment Market size for years: 2026, 2027, 2028, 2029, 2030 and 2031.
Page last updated on:





