Stone Flooring Market Size and Share
Market Overview
| Study Period | 2020 - 2031 |
|---|---|
| Market Size (2026) | USD 13.99 Billion |
| Market Size (2031) | USD 16.62 Billion |
| Growth Rate (2026 - 2031) | 3.52% CAGR |
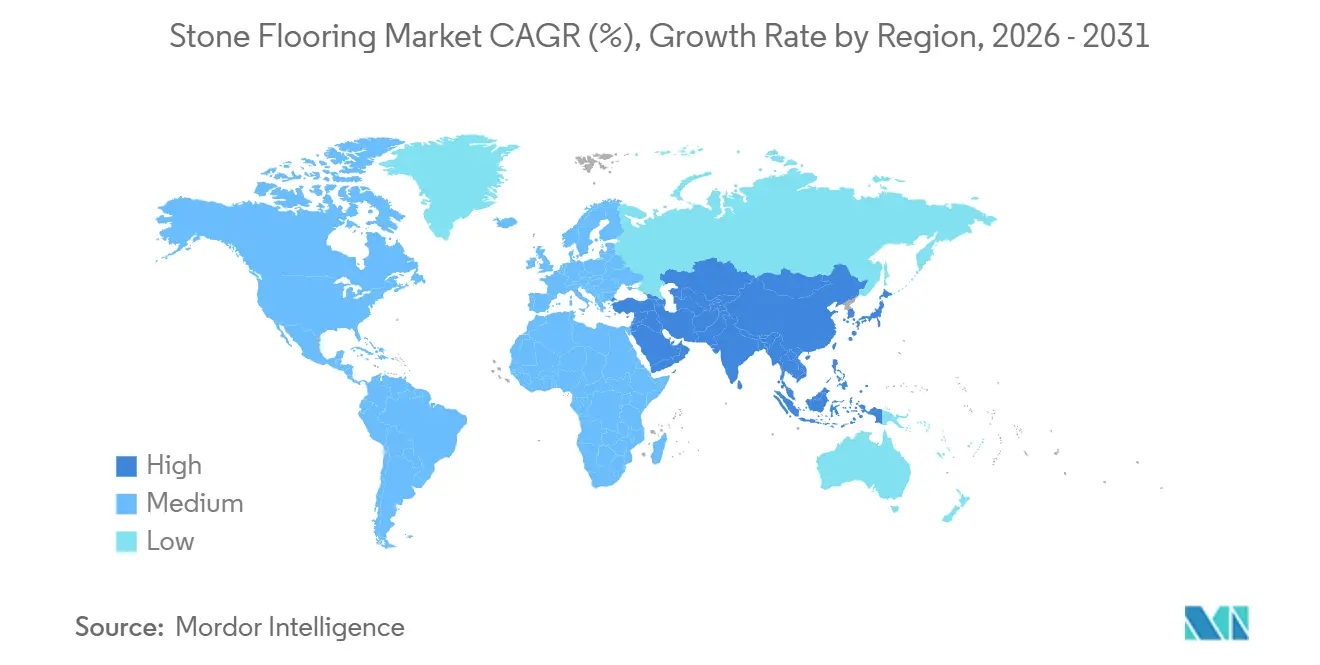
| Fastest Growing Market | Middle East and Africa |
| Largest Market | Asia Pacific |
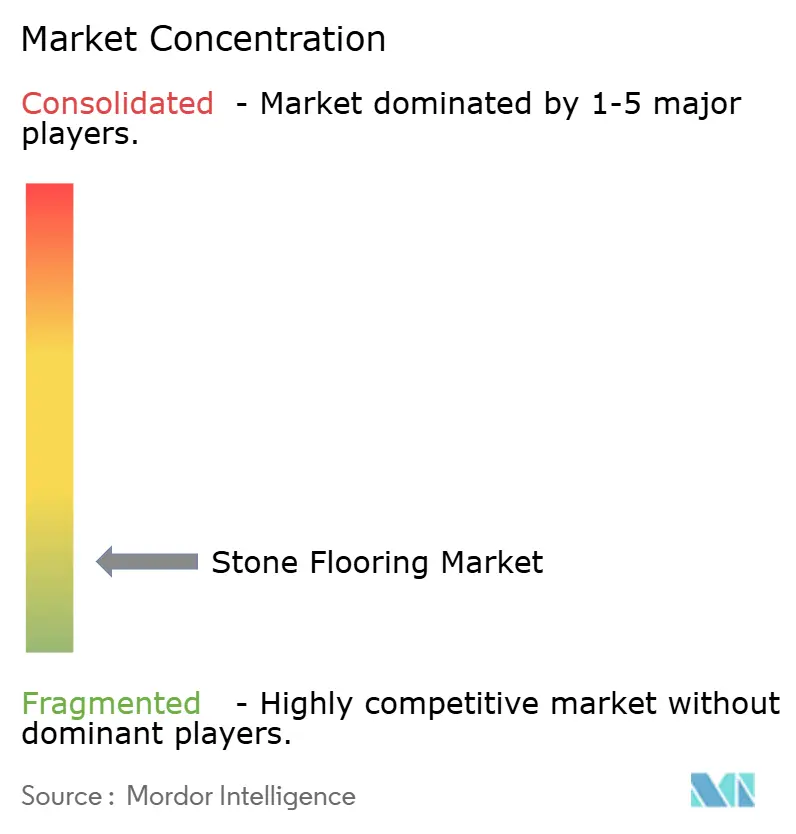
| Market Concentration | Low |
Major Players *Disclaimer: Major Players sorted in no particular order Image © Mordor Intelligence. Reuse requires attribution under CC BY 4.0. | |
Stone Flooring Market Analysis by Mordor Intelligence
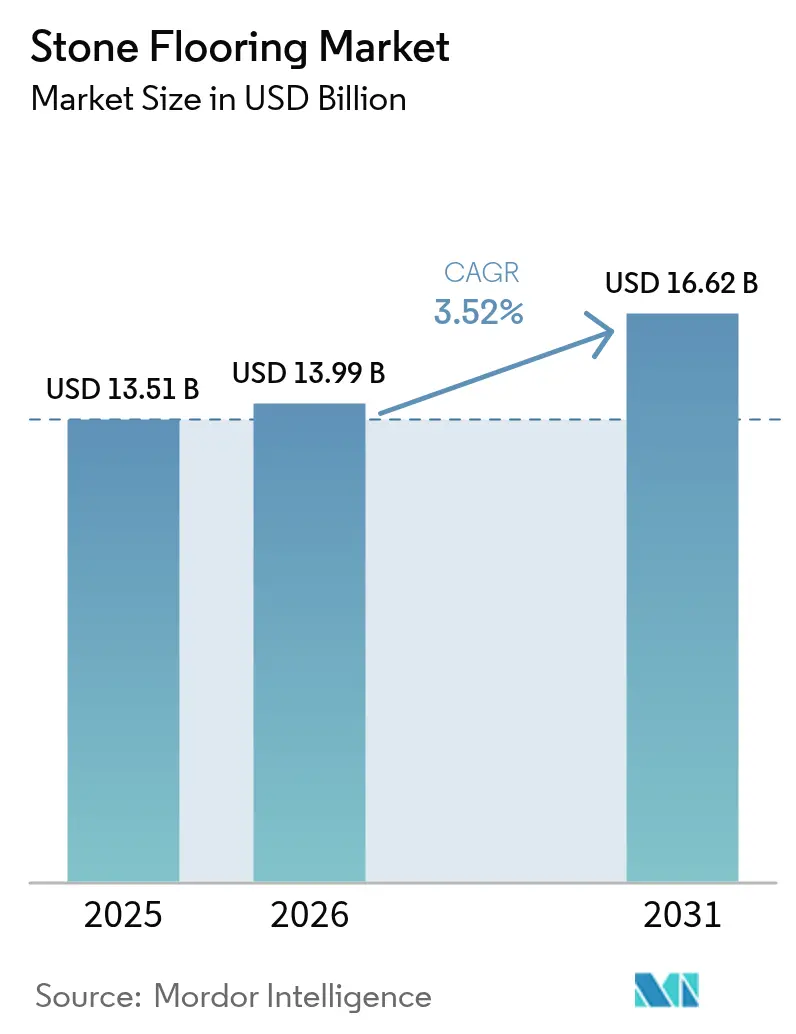
The stone flooring market size is expected to grow from USD 13.51 billion in 2025 to USD 13.99 billion in 2026 and is forecast to reach USD 16.62 billion by 2031 at a 3.52% CAGR over 2026-2031. This outlook is consistent with a category that grows through premiumization, technical specifications, and sustainable sourcing far more than through volume gains, which supports steady pricing and mix upgrades in the stone flooring market. Competitive dynamics remain fragmented and favor regional specialists alongside integrated suppliers that invest in traceable, low-impact extraction and fabrication, which keeps bidding disciplined in the stone flooring market. Product and process innovation accelerates adoption where performance and compliance matter, with sintered and engineered formulations broadening specifications for high-traffic commercial flooring. Environment, health, and safety considerations also influence choices, since natural stone and next-generation low-silica engineered surfaces align with evolving occupational safety and air-quality expectations in major building programs.
Key Report Takeaways
- By product type, marble led with 32.20% of the stone flooring market share in 2025, while engineered & composite stone is forecast to expand at a 5.26% CAGR to 2031. These figures reflect a mix of stability in heritage applications and momentum for engineered formats that meet hygiene and consistency requirements in new builds and retrofits.
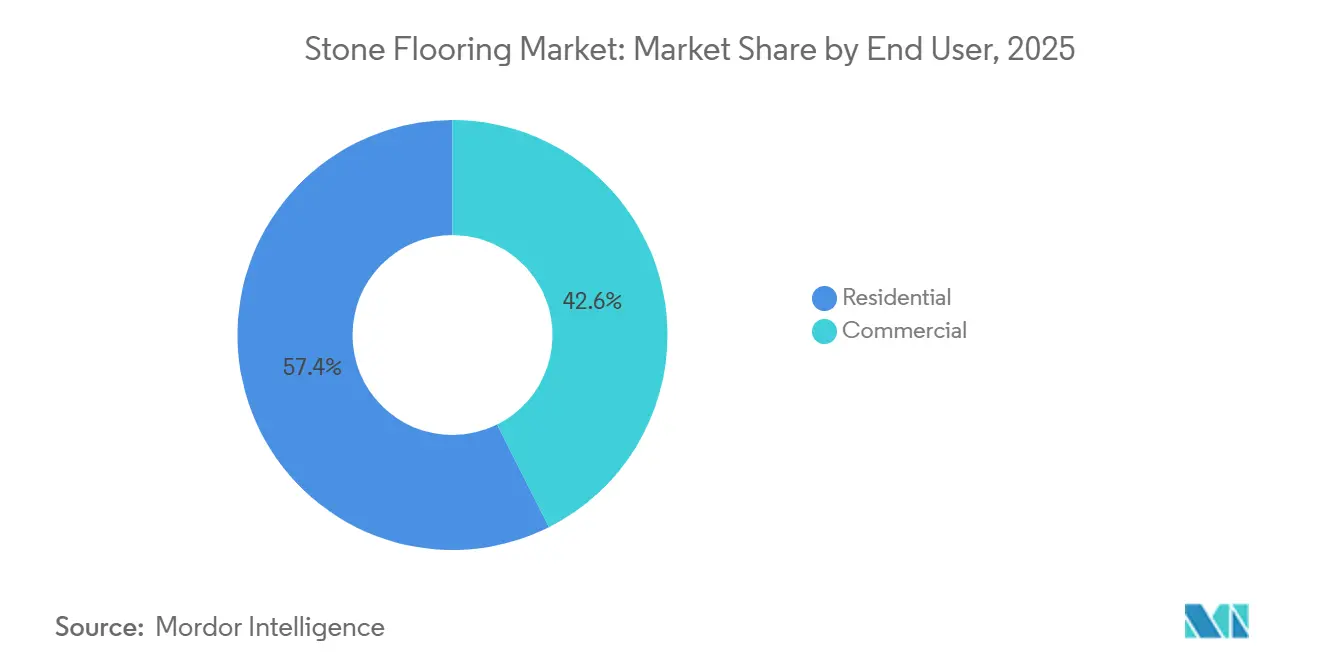
- By end user, residential held a 57.40% of the stone flooring market share in 2025, while commercial construction recorded the highest projected CAGR at 6.03% through 2031. Demand in hospitals, hospitality, and corporate facilities favors durable, low-maintenance stone solutions that meet sustainability reporting needs.
- By construction type, new construction retained a 59.05% of the stone flooring market share in 2025, and remodeling/retrofit is projected to grow at a 5.74% CAGR to 2031. Aging housing stock and brand-standard refresh cycles in commercial spaces sustain retrofit activity across major urban markets.
- By distribution channel, B2C/retail consumers held 66.60% of the stone flooring market share in 2025, while B2B/contractors/builders is projected to expand at a 5.63% CAGR through 2031. Contractor-led workflows increasingly rely on digital tools and direct relationships to secure material continuity on schedule.
- By geography, Asia-Pacific led with 41.05% of the stone flooring market share in 2025, while the Middle East & Africa is projected to be the fastest-growing region at a 4.47% CAGR through 2031. Fabrication capacity, proximity to quarries, and large-format project cycles underpin this distribution of demand.
Note: Market size and forecast figures in this report are generated using Mordor Intelligence’s proprietary estimation framework, updated with the latest available data and insights as of 2026.
Global Stone Flooring Market Trends and Insights
Drivers Impact Analysis*
| Driver | (~) % Impact on CAGR Forecast | Geographic Relevance | Impact Timeline |
|---|---|---|---|
| Renovation upcycle in developed markets: Unlocking deferred replacement flooring | +1.2% | North America and Western Europe are, strongest in single-family retrofit | Medium term (2-4 years) |
| Asia-Pacific construction pipeline and quarry proximity sustaining cost-advantaged supply | +0.9% | Asia-Pacific core, spill-over to the Middle East project sourcing | Long term (≥ 4 years) |
| Shift toward premium, durable, low-VOC floor finishes in high-traffic spaces | +0.7% | Global, led by commercial hospitality and healthcare in North America and the EU | Medium term (2-4 years) |
| Processing innovations (CNC, waterjet, resin treatments) expanding formats & yield | +0.5% | Europe and North America's fabrication hubs, emerging in Turkey and India | Long term (≥ 4 years) |
| Low-embodied-carbon advantage of natural stone in ESG-driven specifications | +0.4% | North America LEED projects, EU green-building mandates, and corporate commitments | Long term (≥ 4 years) |
| Sintered/ultra-compact slabs broadening "stone" budgets for heavy-wear flooring | +0.8% | Global, strongest in Asia-Pacific new-build and North America commercial retrofit | Medium term (2-4 years) |
| Source: Mordor Intelligence | |||
Renovation Upcycle in Developed Markets: Unlocking Deferred Replacement Flooring
Remodeling and retrofit programs in North America and Western Europe continue to unlock deferred replacement flooring in kitchens, bathrooms, corridors, and common areas, which supports a steady pipeline for premium hard surfaces in the stone flooring market. Single-family homeowners and luxury multifamily investors execute upgrades that prioritize durable and hygienic finishes, often with digital design support and curated displays that reduce decision risk. Institutional design standards also shape product selection, as some public housing and multifamily frameworks reference maintenance and lifecycle-cost considerations that influence the suitability of materials in subsidized properties [1]Source: “2025 Multifamily Design & Construction Standards,” Connecticut Housing Finance Authority, chfa.org. Commercial operators continue to refresh lobbies and high-traffic spaces to match branding and guest-experience goals, which typically favor materials with consistent appearance, surface integrity, and documented environmental credentials in the stone flooring market. Suppliers that combine broad local inventories with visualization tools and dependable installer networks improve conversion rates on retrofit schedules, a pattern visible among distributors scaling regional facilities and e-commerce-enabled selections. Over the medium term, the renovation pulse remains synchronized with brand-standard updates and homeowner equity cycles, keeping retrofit a reliable growth lane for the stone flooring market.
Asia-Pacific Construction Pipeline and Quarry Proximity Sustaining Cost-Advantaged Supply
Asia-Pacific’s leadership in quarrying, fabrication, and export logistics underpins a structural cost advantage that sustains its central role in the stone flooring market. Indian producers have expanded quartz and engineered-stone capacity on industrialized platforms that feed both domestic developers and export channels, adding incremental supply that diversifies global sourcing. Global brands are also establishing production closer to North American demand to de-risk freight and regulatory exposure while keeping Asia-Pacific as a core node in raw material and component sourcing, which balances regional availability in the stone flooring market. In parallel, European and Middle Eastern buyers continue to blend local stones with imported marbles, granites, and quartzites that meet aesthetic and performance targets for large-scale hospitality and civic programs, supported by established quarry-to-port corridors. Documentation and certification practices adopted by leading quarries and plants reinforce this cross-border trade by answering LEED and EPD needs at project specification time. The long-term relevance of Asia-Pacific’s supply is further stabilized by ongoing investments in process quality and environmental controls, which align with buyer expectations in the stone flooring market.
Shift Toward Premium, Durable, Low-VOC Floor Finishes in High-Traffic Spaces
Commercial specifiers emphasize indoor-air quality, durability, and verifiable environmental data, which collectively support natural stone and modern engineered formats in the stone flooring market. Third-party Environmental Product Declarations (EPDs)show that natural stone emits zero volatile organic compounds and carries well-documented cradle-to-gate attributes that fit LEED and similar frameworks, making it a strong option for healthcare, hospitality, and public facilities. Performance features like abrasion resistance, point-load tolerance, and easy maintenance underpin lifecycle cost advantages where floors see constant traffic and cleaning, which favors stone and advanced sintered surfaces over less robust alternatives. Materials with low crystalline-silica content and improved processing profiles further ease compliance at fabrication and installation. Together, these specifications drive steady adoption of premium surfaces across lobbies, corridors, transit nodes, and clinical environments where longevity and compliance matter most.
Sintered and Ultra-Compact Slabs Broadening “Stone” Budgets for Heavy-Wear Flooring
Sintered and ultra-compact slabs are capturing share in floor-grade applications where stain resistance, scratch resistance, and dimensional stability are non-negotiable, enlarging the practical field of options within the stone flooring market. European innovators have pushed full-body veining, large formats, and 3D-printed aesthetic effects that reach parity with natural stone while offering zero porosity and consistent performance on demanding substrates. Production localization in North America enables faster delivery and closer technical support for architects and contractors, improving acceptance curves for new product families and easing retrofit schedules. Training programs and installer resources from leading brands reduce execution barriers by standardizing cutting, handling, and adhesive protocols for large-format panels in commercial corridors and public areas. Parallel advances in thin, reinforced natural-stone panels and hybrid assemblies extend options for weight-constrained retrofits where traditional thickness would require structural reinforcement. As more projects accumulate multi-year performance data, sintered and advanced composite slabs become a reliable complement to natural stone in the stone flooring market.
Restraints Impact Analysis*
| Restraint | (~) % Impact on CAGR Forecast | Geographic Relevance | Impact Timeline |
|---|---|---|---|
| Intense competition from porcelain and LVT on cost and speed | -0.8% | Global, strongest in residential value engineering | Long term (≥ 4 years) |
| Permitting, quarry regulation, and transport costs | -0.6% | Europe, North America, Turkey, and India export logistics | Medium term (2-4 years) |
| Shortage of specialized installers | -0.9% | North America and Europe's metropolitan hubs | Medium term (2-4 years) |
| Weight and substrate constraints in retrofits | -0.4% | Urban retrofit markets and older commercial stock | Short term (≤ 2 years) |
| Source: Mordor Intelligence | |||
Intense Competition from Porcelain and LVT on Cost and Install Speed
Porcelain tile and resilient LVT offer installed-cost and installation-speed advantages that are hard to match in value-engineered residential and light-commercial projects, which limit whole-floor specifications for higher-priced stone systems in the stone flooring market. Digital printing and large-format porcelain panels now emulate natural patterns with high fidelity while offering straightforward maintenance in busy areas, a combination that competes effectively in budget-constrained programs. Resilient plank systems also appeal in quick-turn renovations because they minimize subfloor preparation and accelerate turnovers for property owners and managers. As specification teams balance lifecycle, acoustics, moisture, and slip needs, porcelain and LVT give project leads a flexible toolkit for non-signature spaces where lookalikes suffice and schedule certainty is paramount. This long-term restraint keeps stone concentrated in feature areas unless projects place a premium on longevity, embodied carbon, or brand signaling in the stone flooring market.
Shortage of Specialized Installers Raising Installed Costs and Timelines
The available pool of journey-level stone installers remains tight in major North American and European metros, which extends lead times and can raise installed costs on complex stone flooring jobs. Commercial programs are adapted by specifying systems that simplify alignment and handling, such as pre-tabbed granite pavers and lightweight stone panels that streamline site work while preserving the design intent. Distributor and manufacturer training resources are expanding to reduce execution risk for large-format panel installations, improving schedule confidence for hospital and hospitality retrofits. Material choice also reflects workforce realities, as specifiers select formats and finishes that can be installed reliably with available crews while achieving durability and hygiene targets. Until trade pipelines widen, the labor constraint will continue to affect project phasing and material mix decisions in the stone flooring market.
*Our forecasts treat driver/restraint impacts as directional, not additive. The impact forecasts reflect baseline growth, mix effects, and variable interactions.
Segment Analysis
By Product Type: Engineered & Composite Stone Gains as Marble Holds Premium Share
Marble accounted for 32.20% of the 2025 segment revenue, highlighting its sustained role in luxury residential and hospitality specifications, while engineered & composite stone is projected to record a 5.26% CAGR through 2031, which signals steady adoption where hygienic, uniform surfaces are required in the stone flooring market. At the high end, marquee marble varieties continue to anchor brand architecture for lobbies and amenity spaces, supported by quarries and fabricators that maintain consistent appearance and finish across multi-location programs. Momentum for sintered and engineered compositions coincides with a broader health-and-safety lens, where low-silica or re-engineered formulations aim to meet evolving occupational standards during cutting and finishing while delivering performance on the floor. Product portfolios spanning natural, engineered, and sintered solutions enable specifiers to curate looks and performance across different traffic zones while staying on schedule and budget in the stone flooring market. Over the forecast window, engineered and sintered formats are expected to capture more high-wear installations, while marble retains prestige placements that signal heritage and luxury in the stone flooring market.
Performance-driven selections continue to favor granite, durable limestones, and quartzites where abrasion resistance and slip profiles must be maintained with routine cleaning, and the stone flooring industry benefits when suppliers offer calibrated thicknesses that align with substrate constraints. Cross-category sourcing from distributors and vertically integrated quarries allows hospitality chains to balance elegant lobby statements with back-of-house resilience, and thin stone innovations expand options for retrofits where added weight is limited. As training and large-format handling become more familiar on job sites, engineered and sintered products grow into adjacencies formerly dominated by porcelain, while natural stone continues to anchor signature areas for visual continuity in the stone flooring market. This balanced approach helps project leads meet procurement, design, and compliance objectives within predictable schedules, reinforcing diversified product strategies in the stone flooring market.


By Construction Type: Remodeling and Retrofit Gain on Aging Stock and Adaptive Reuse
New construction captured 59.05% of 2025 revenues, but remodeling and retrofit are projected to grow at a 5.74% CAGR through 2031, reflecting strong programs in developed markets and adaptive reuse in urban cores of the stone flooring market size. Retrofit programs in hospitality, healthcare, and public buildings often target lobby and corridor refurbishments that improve first impressions and durability, while thin stone and lightweight panels help avoid major structural work where substrates cannot carry traditional thicknesses. For multifamily, design standards guide material choice, and some public authorities note care, handling, and weight as practical considerations, which can steer stone into higher-end or owner-financed projects [2]Source: “2025 Multifamily Design & Construction Standards,” Connecticut Housing Finance Authority, chfa.org. As installers gain experience with large-format systems and sintered panels, commercial retrofits integrate high-performance stone more widely without extending schedules in the stone flooring market.
In new builds, developers balance premium common areas that demand visual consistency with back-of-house zones that emphasize ease of maintenance, which leads to multi-material solutions sourced from integrated distributors in the stone flooring industry. Construction teams also value predictable lead times and large-lot availability, which favor suppliers with regional distribution centers and plant footprints that can feed high-rise or campus-scale projects without delivery risk. Over the forecast period, retrofit remains a resilient demand driver where replacement cycles and ESG reporting converge, while new construction continues to deliver key projects in growth regions, keeping both channels central to the stone flooring market.
By End-User: Commercial Construction Outpaces Residential on ESG and Hygiene Mandates
Residential applications held 57.40% of the 2025 segment demand, underpinned by kitchen-and-bath renovations and whole-floor upgrades that emphasize aesthetics, durability, and property value, while commercial construction is projected to expand at a 6.03% CAGR through 2031 as institutional buyers prioritize lifecycle and compliance factors in the stone flooring market size. In healthcare, non-porous advanced surfaces and antimicrobial innovations support rigorous cleaning routines, while lobby and corridor programs in hospitality emphasize abrasion resistance and design identity that endures high traffic. Public-sector and education projects require clear documentation of material impacts and maintenance schemes, which suit stone systems backed by EPD data and standardized finishes [3]Source: “Embodied Carbon and Natural Stone,” Natural Stone Institute, naturalstoneinstitute.org. Retail and mixed-use spaces often combine stone feature areas with other hard surfaces to balance budget disciplines and traffic patterns while maintaining brand cohesion in the stone flooring market.
Residential growth remains important in absolute volume as single-family and multifamily owners address deferred replacement cycles with premium looks and trusted brand curation in the stone flooring industry. The availability of thin, lighter-weight natural-stone solutions and sintered options supports more households where substrate conditions or schedule constraints used to favor alternative materials. Home-focused distributors continue to expand design support and digital tools for remote selection, expanding comfort levels with natural stone and lookalike surfaces that complement overall remodeling goals in the stone flooring market. For commercial owners, documented performance and sustainability credentials frequently outweigh initial material cost, favoring specifications that lower the long-run total cost of ownership and carbon reporting complexity in the stone flooring market.
By Distribution Channel: B2B and Contractors Grow Faster as Digital Tools Disintermediate Retail
B2C / retail consumers held 66.60% of the 2025 channel share, which reflects showroom-led selection and in-home consultations for homeowners, while B2B / contractors are projected to grow at a 5.63% CAGR through 2031 on the strength of direct relationships, enterprise pricing, and digital reservation workflows in the stone flooring market. Trade-focused distributors are expanding regional hubs to guarantee next-day availability for core stones and engineered slabs, which sustains contractor loyalty and keeps complex projects on schedule. Visualization tools and curated product assortments remain important for consumers, but professional buyers prioritize reliability, batch consistency, and technical support that lowers on-site risk in the stone flooring market.
As national and regional program managers consolidate procurement across portfolios, distributors with installer networks and specialized training can capture larger shares of standardized refresh cycles in hospitality, healthcare, and retail in the stone flooring industry. Product announcements that span natural stone, quartz, and advanced sintered lines also simplify material management for contractors who want a single partner across varied zones and performance needs. Over the forecasted period, the B2B channel’s mix of speed, technical support, and price discipline is likely to keep expanding its proportional role while retail sustains homeowner-led projects that rely on in-person design guidance in the stone flooring market.
Geography Analysis
Asia-Pacific accounts for 41.05% of global 2025 revenue, reflecting both large-scale consumption and a deep base of quarrying and fabrication that supports regional projects and exports. Cost competitiveness in the region is reinforced by proximity between quarries, slab plants, and major ports that together compress delivered costs for large construction programs. India’s engineered-stone capacity expansion illustrates this dynamic, with Pokarna operating two Telangana quartz facilities on Bretonstone technology at an annual capacity of 15 million square feet and exporting the majority of production to North America while growing domestic placements as urban incomes rise. Documentation and transparency are increasingly part of bid requirements, and industry associations provide Environmental Product Declarations and sustainability standards that help exporters meet LEED and similar program needs in North America and Europe. These capabilities position Asia-Pacific as the largest demand center and a reliable low-cost fabrication platform that feeds cross-border projects into 2026 and beyond.
The Middle East and Africa are projected to be the fastest-growing region through 2031 at a 4.47% CAGR, supported by a sustained pipeline of hospitality, civic, and mixed-use developments that specify premium natural stones and advanced slabs at scale. Flagship programs in the Gulf Cooperation Council countries continue to shape demand for high-visibility flooring and cladding in airports, hotels, cultural venues, and retail districts, which requires coordinated sourcing and strong logistics execution. Regional and international suppliers are reinforcing capacity and distribution to serve these programs, as seen in quarry and processing consolidations that improve throughput and supply reliability for large tenders. Sustainability documentation is also beginning to influence procurement frameworks, and industry associations provide EPDs and material health documentation that can be integrated into client specifications when required. Together, these factors create a clear runway for projects that favor durable, low-maintenance surfaces with verified performance and traceability across the value chain.
North America and Europe hold smaller shares than Asia-Pacific but exhibit steady demand built on renovation cycles, heritage restoration, and selective new construction across institutional and commercial buildings. Public tenders and corporate interiors frequently request EPD-backed materials and clear sustainability documentation, which favors suppliers that can demonstrate low-emission processing and provide verified cradle-to-gate data for stone and engineered surfaces. Capacity localization is also evident in North America, with investments like Cosentino’s Jacksonville site improving lead times, supporting low-silica product adoption, and aligning with evolving occupational safety expectations in fabrication and installation. In Europe, supplier networks emphasize traceable supply and certified operations that support both heritage-grade restorations and modern performance requirements in hospitality and public buildings. These elements together maintain balanced trajectories in both regions as project owners prioritize long-term durability, documented material impacts, and predictable delivery for refurbishment and new-build schedules.

Competitive Landscape
The stone flooring market is structurally fragmented, which keeps pricing influenced by local competition and project-level negotiations rather than by centralized control. Scale advantages accrue to suppliers that combine quarrying, fabrication, logistics, and installer engagement, creating reliable pipelines for hospitality and institutional buyers that demand batch consistency and delivery assurance. Multi-category distributors also benefit by pairing natural stone with engineered and sintered offerings, which simplifies procurement for portfolio owners and general contractors in the stone flooring market.
Strategic investments are reshaping service footprints and compliance positioning in North America and Europe, including low-silica production, showroom modernizations, and training resources for large-format installation in the stone flooring market. European innovators have also advanced 3D printing and through-body veining techniques that close the aesthetic gap with natural marble, enabling broader placement of ultra-compact slabs in heavy-wear floors. Natural-stone specialists are answering retrofit and labor challenges with lighter systems and alignment aids to reduce installation time, supporting adoption where substrate constraints or workforce capacity once limited the scope. Public disclosures from large flooring conglomerates confirm a continued focus on tile, stone, and luxury segments that provide resilience across cycles, which anchors broader distribution and dealer ecosystems in the stone flooring market.
Recent M&A and capacity moves underscore a focus on manufacturing proximity, design influence, and brand partnerships in the stone flooring market. A major European brand’s decision to build advanced production in Florida strengthens North American supply and aligns with occupational safety standards, shaping specifications and fabrication practices. Slate producers have consolidated quarry and processing assets across Spain to reinforce leadership and scale, ensuring consistent supply for façades and floor projects with heritage requirements. Distributor expansions that add regional hubs and next-day service reinforce loyalty among contractors who prioritize reliability and breadth of assortment for large and time-sensitive jobs in the stone flooring market.
Stone Flooring Industry Leaders
MSI Surfaces (M S International, Inc.)
Daltile (Mohawk Industries)
Cosentino (Dekton, Silestone)
Levantina Group
Neolith
- *Disclaimer: Major Players sorted in no particular order

Recent Industry Developments
- February 2026: Cosentino previewed Inlayr Design Technology at KBIS 2025, alongside its first zero-silica surface under the Q0 banner, new Dekton designs, and Deklite ultralight 4mm slabs aimed at high-performance cladding and retrofit needs. The suite strengthens low-silica options and reduces installed weight for tight retrofit envelopes.
- January 2026: Arizona Tile released its winter 2026 collection, adding multiple quartzites, a satin-finish granite, and a fresh quartz design, which broadens a one-stop specification for residential and commercial renovations that seek durable, premium looks.
- November 2025: Arizona Tile unveiled new quartz and natural stone collections, extending options across price bands and surface finishes for diverse project profiles in the United States.
- June 2025: Lowe’s completed its acquisition of Artisan Design Group (ADG), expanding its design, distribution, and installation services capabilities for surface finishes across the United States construction and homebuilder market.


Global Stone Flooring Market Report Scope
Stone flooring, also known as natural stone flooring, is a flooring material made from natural stone. Natural stone flooring is made from a variety of natural stone materials, including granite and marble, as well as limestone and travertine.
The stone flooring market is segmented by product, application, end-user, and by region. By product, the market is segmented into slate, granite, marble, limestone, travertine, sandstone, and others (brushed, slate, etc). By application, the market is segmented into flooring, wall cladding, and cut-to-size items. By end-user, the market is segmented into residential and commercial. By region, the market is segmented into North America, Europe, Asia-Pacific, South America, and Middle East, and Africa.
The report offers market size and forecasts for the stone flooring market in value (USD) for all the above segments.
| Marble |
| Granite |
| Limestone & Travertine |
| Slate |
| Sandstone |
| Engineered/Composite Stone |
| New Construction |
| Remodeling / Retrofit |
| Residential | |
| Commercial | Hospitality & Leisure |
| Retail & Shopping Centers | |
| Healthcare Facilities | |
| Education | |
| Corporate Offices | |
| Public & Government Buildings | |
| Other Commercial Users |
| B2C/Retail Consumers | Home Centers |
| Specialty Flooring Stores | |
| Online | |
| Other Distribution Channels | |
| B2B/Contractors/Builders |
| North America | Canada |
| United States | |
| Mexico | |
| South America | Brazil |
| Peru | |
| Chile | |
| Argentina | |
| Rest of South America | |
| Europe | United Kingdom |
| Germany | |
| France | |
| Spain | |
| Italy | |
| BENELUX (Belgium, Netherlands, Luxembourg) | |
| NORDICS (Denmark, Finland, Iceland, Norway, Sweden) | |
| Rest of Europe | |
| Asia-Pacific | India |
| China | |
| Japan | |
| Australia | |
| South Korea | |
| South-East Asia | |
| Rest of Asia-Pacific | |
| Middle East & Africa | United Arab Emirates |
| Saudi Arabia | |
| South Africa | |
| Nigeria | |
| Rest of Middle East & Africa |
| By Product Type | Marble | |
| Granite | ||
| Limestone & Travertine | ||
| Slate | ||
| Sandstone | ||
| Engineered/Composite Stone | ||
| By Construction Type | New Construction | |
| Remodeling / Retrofit | ||
| By End User | Residential | |
| Commercial | Hospitality & Leisure | |
| Retail & Shopping Centers | ||
| Healthcare Facilities | ||
| Education | ||
| Corporate Offices | ||
| Public & Government Buildings | ||
| Other Commercial Users | ||
| By Distribution Channel | B2C/Retail Consumers | Home Centers |
| Specialty Flooring Stores | ||
| Online | ||
| Other Distribution Channels | ||
| B2B/Contractors/Builders | ||
| By Geography | North America | Canada |
| United States | ||
| Mexico | ||
| South America | Brazil | |
| Peru | ||
| Chile | ||
| Argentina | ||
| Rest of South America | ||
| Europe | United Kingdom | |
| Germany | ||
| France | ||
| Spain | ||
| Italy | ||
| BENELUX (Belgium, Netherlands, Luxembourg) | ||
| NORDICS (Denmark, Finland, Iceland, Norway, Sweden) | ||
| Rest of Europe | ||
| Asia-Pacific | India | |
| China | ||
| Japan | ||
| Australia | ||
| South Korea | ||
| South-East Asia | ||
| Rest of Asia-Pacific | ||
| Middle East & Africa | United Arab Emirates | |
| Saudi Arabia | ||
| South Africa | ||
| Nigeria | ||
| Rest of Middle East & Africa | ||


Key Questions Answered in the Report
What is the size and growth outlook of the stone flooring market through 2031?
The stone flooring market size is estimated USD 13.99 billion in 2026 and is projected to reach USD 16.62 billion by 2031 at a 3.52% CAGR, supported by premiumization and compliance-led specifications.
Which product categories are leading and which are growing fastest in stone flooring?
Marble led with 32.20% revenue share in 2025, while engineered & composite stone is the fastest growing with a projected 5.26% CAGR to 2031, reflecting durability and consistency needs in new builds and retrofits.
Which end-use sectors are most attractive for near-term stone flooring deployments?
Residential remains the largest at 57.40% of 2025 demand, but commercial construction shows the fastest growth at 6.03% CAGR through 2031, due to hygiene, durability, and ESG reporting priorities.
What regions are most important for stone flooring demand and growth?
Asia-Pacific holds 41.05% of 2025 revenue, while the Middle East & Africa is projected to grow fastest at 4.47% CAGR through 2031, anchored by large hospitality and civic programs.
How are technology and sustainability changing stone flooring specifications?
EPD-backed natural stone and low-silica sintered or engineered options are gaining popularity with better durability, low VOCs, and verifiable environmental data, which improves acceptance in healthcare, hospitality, and public buildings.
What channel shifts are shaping how stone gets specified and delivered?
B2B and contractor channels are growing faster due to direct procurement, regional hubs, and installer training, while retail remains large for homeowner-led upgrades supported by design tools.
Page last updated on:


