Stainless Steel Market Size and Share
Market Overview
| Study Period | 2021 - 2031 |
|---|---|
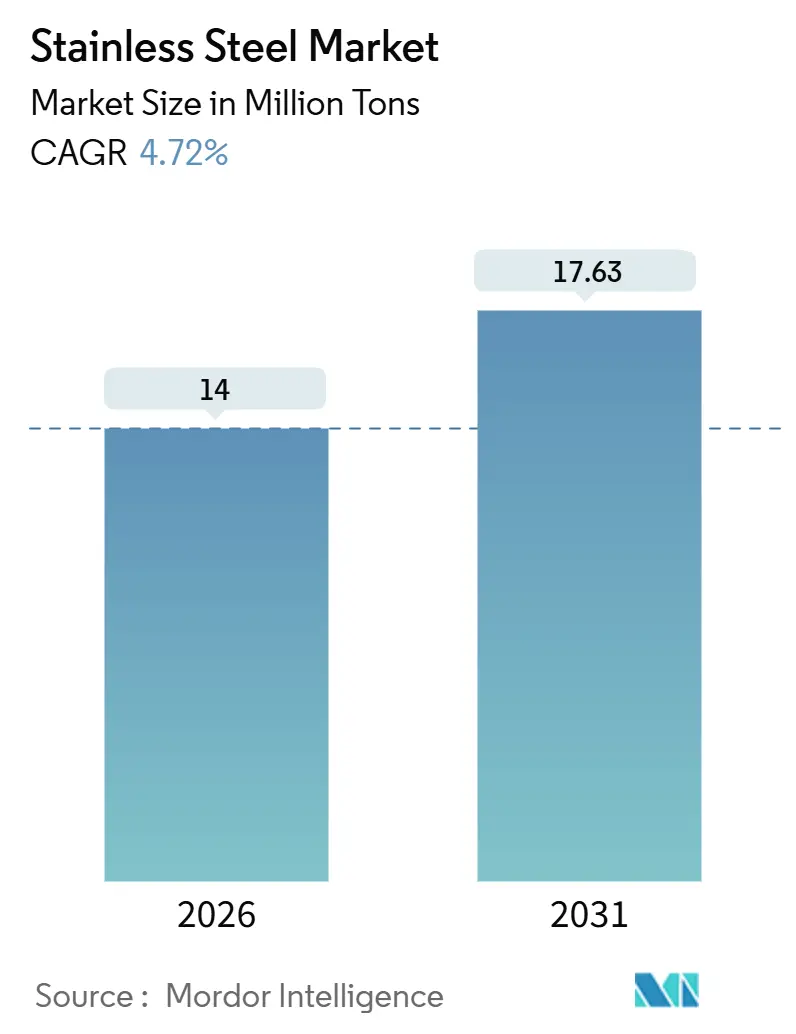
| Market Volume (2026) | 14 Million tons |
| Market Volume (2031) | 17.63 Million tons |
| Growth Rate (2026 - 2031) | 4.72% CAGR |
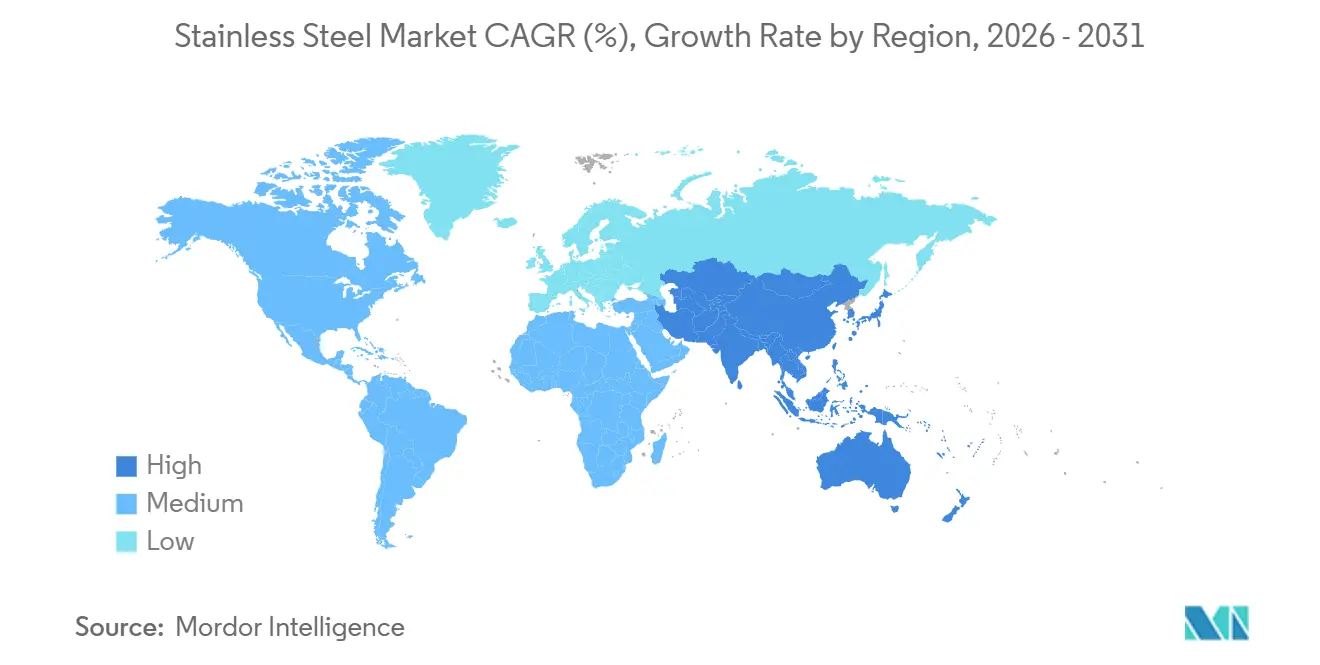
| Fastest Growing Market | Asia-Pacific |
| Largest Market | Asia-Pacific |
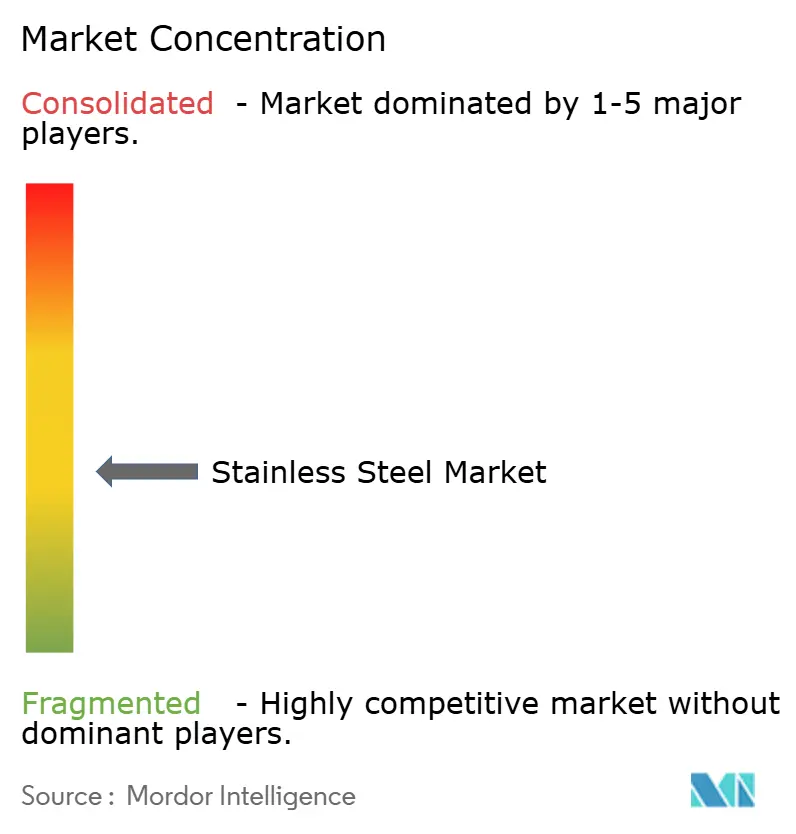
| Market Concentration | Medium |
Major Players *Disclaimer: Major Players sorted in no particular order Image © Mordor Intelligence. Reuse requires attribution under CC BY 4.0. | |
Stainless Steel Market Analysis by Mordor Intelligence
The Stainless Steel Market size is estimated at 14 Million tons in 2026, and is expected to reach 17.63 Million tons by 2031, at a CAGR of 4.72% during the forecast period (2026-2031). Growth rests on regulatory mandates that privilege corrosion-resistant alloys, the durability economics of life-cycle costing, and supply-chain pivots toward nickel-integrated hubs. India’s coastal-zone rebar code, U.S. sanitary-equipment enforcement, and Europe’s green-hydrogen push are anchoring predictable pull even as cyclical construction and appliance spending wavers. At the same time, horizontally integrated Asian producers are reshaping cost curves by coupling low-cost nickel ore with captive smelting, allowing competitive export prices despite lingering anti-dumping duties in Europe and North America. Substitution threats from aluminum and 200-series grades remain acute in price-sensitive appliances, yet infrastructure, energy transition hardware, and hygiene-critical processing keep premium 300-series and duplex alloys in demand.
Key Report Takeaways
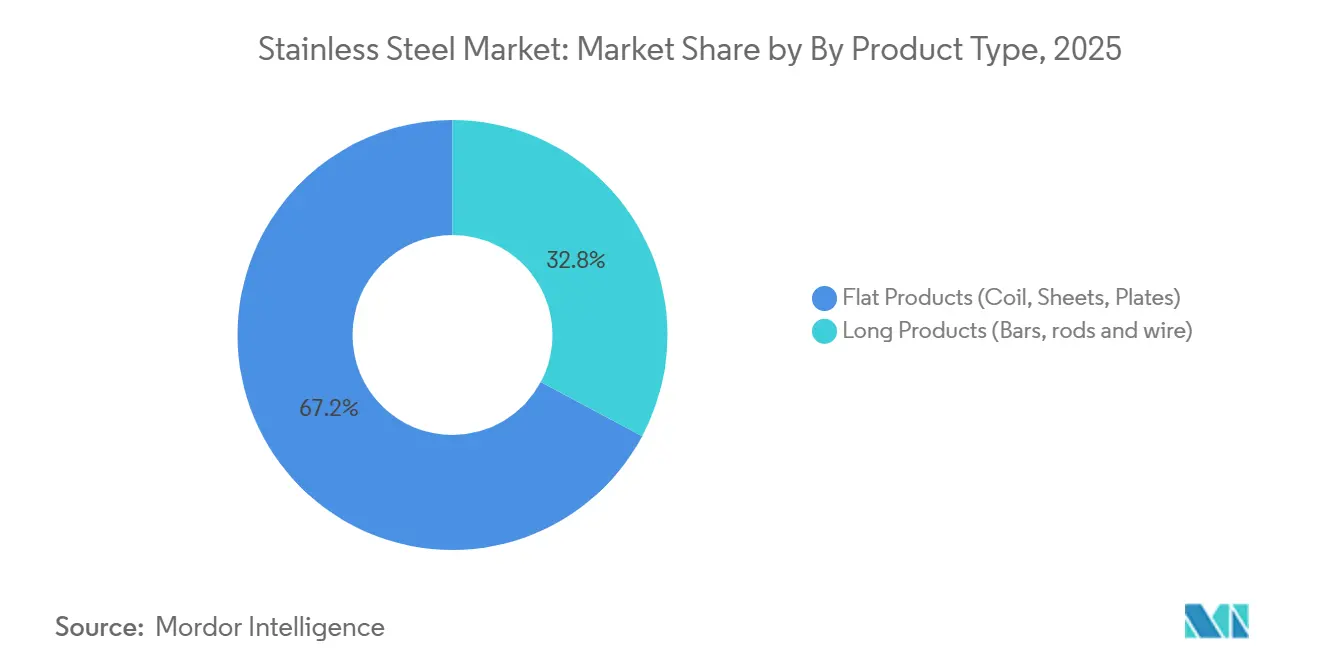
- By product type, flat products held 67.20% of the 2025 stainless steel market share and are advancing at a 5.14% CAGR through 2031, outpacing long products.
- By form, cold-rolled material accounted for 54.11% of the 2025 volume and is growing at 5.11%, reflecting end-user preference for a premium finish in automotive, appliance, and food-processing lines.
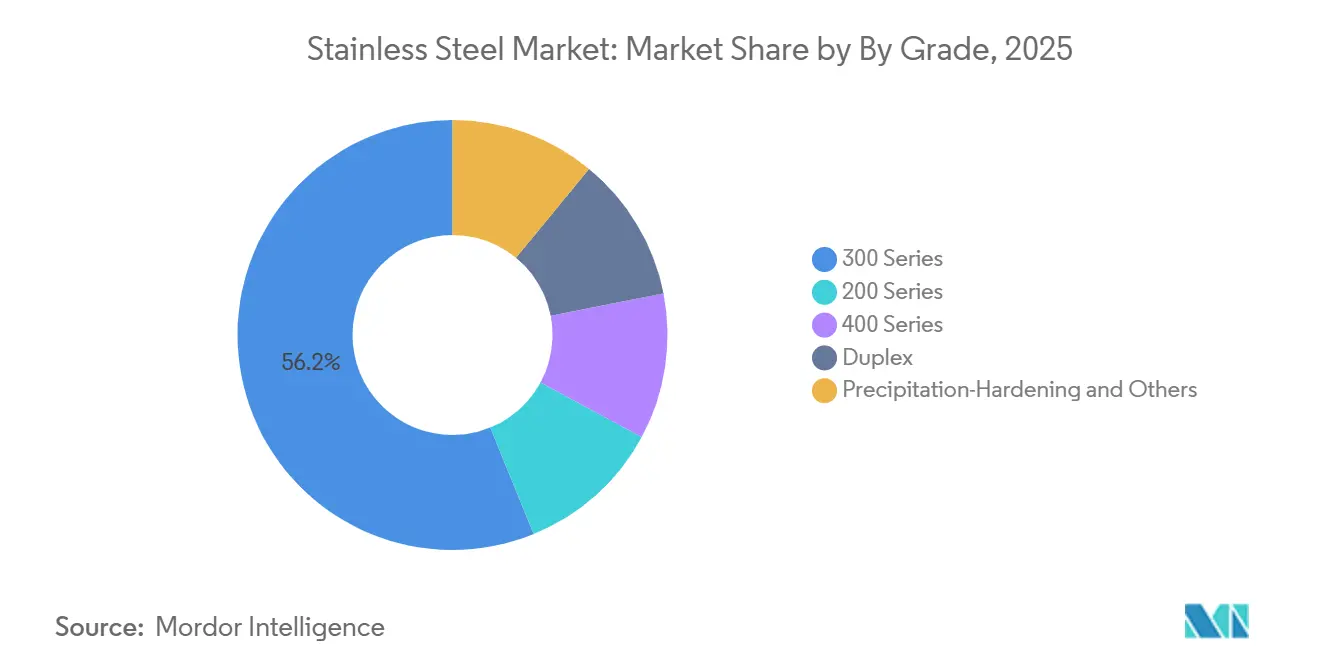
- By grade, the 300 series captured 56.18% of 2025 demand, while duplex grades posted the fastest 5.29% CAGR on rising electrolyzer orders across Europe.
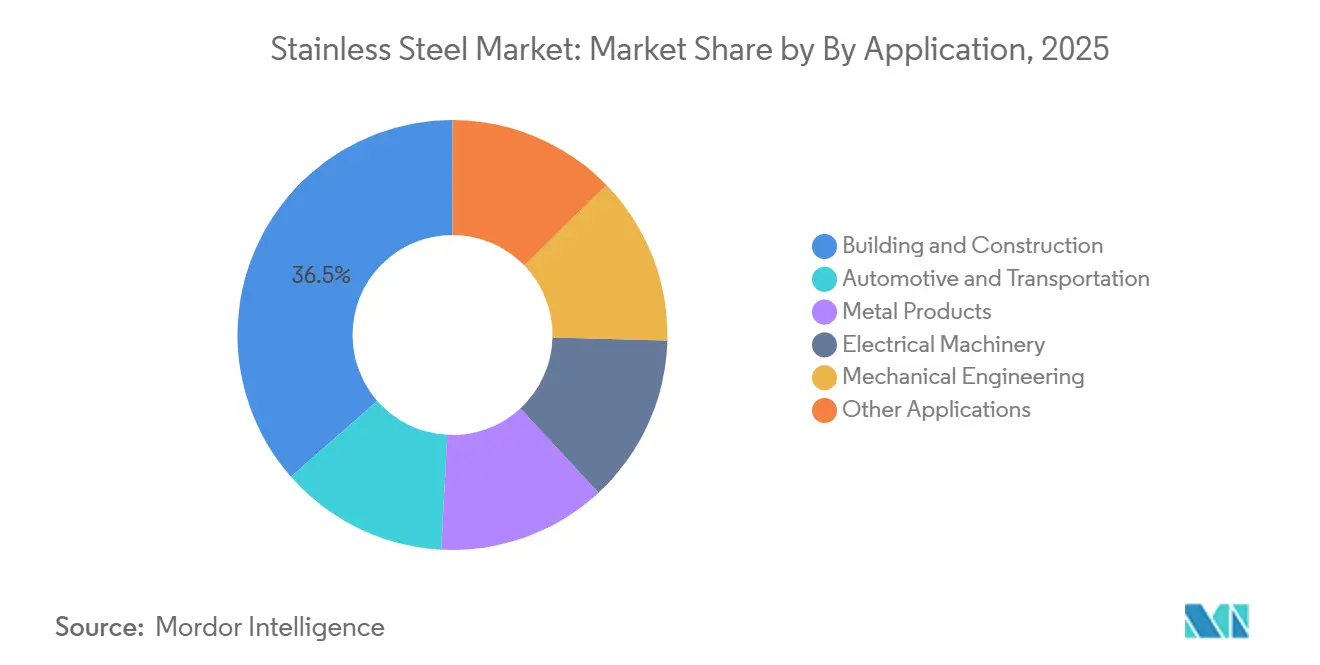
- By application, construction dominated with 36.47% of the 2025 volume; automotive is the quickest riser at a 5.27% CAGR as battery enclosures adopt stainless steel for thermal stability.
- By geography, Asia-Pacific commanded 61.29% of 2025 tonnage and is expanding at 5.34%, benefiting from India’s infrastructure pipeline and Indonesia’s nickel-captured cost advantage.
Note: Market size and forecast figures in this report are generated using Mordor Intelligence’s proprietary estimation framework, updated with the latest available data and insights as of January 2026.
Global Stainless Steel Market Trends and Insights
Driver Impact Analysis
| Drivers | (~) % Impact on CAGR Forecast | Geographic Relevance | Impact Timeline |
|---|---|---|---|
| Mandatory use of stainless-steel rebar in India's coastal codes | +0.8% | India, with spillover to Bangladesh, Sri Lanka coastal zones | Medium term (2-4 years) |
| LNG and cryogenic storage build-out across Asia | +0.6% | Asia-Pacific core (China, India, Southeast Asia), spillover to Middle East | Long term (≥ 4 years) |
| Replacement of food-processing equipment under U.S. FSMA | +0.5% | North America, with EU following similar hygiene standards | Short term (≤ 2 years) |
| Green-hydrogen electrolyzer adoption in EU boosting demand for duplex grade | +0.7% | Europe, with early projects in Sweden, Germany, Netherlands | Medium term (2-4 years) |
| Growing demand from construction industry | +1.2% | Global, with concentration in Asia-Pacific and Middle East | Long term (≥ 4 years) |
| Source: Mordor Intelligence | |||
Mandatory Use of Stainless-Steel Rebar in India's Coastal Codes
India’s 2024 circular mandating stainless rebar within 30 km of coastlines under IS 16651:2017 enforces a 75-year design life, cutting lifecycle costs by 40% versus epoxy-coated carbon steel[1]Ministry of Road Transport and Highways, “Circular on Stainless Steel Rebar,” morth.nic.in. Early adoption in Mumbai, Chennai, and Kochi metro rail projects alone represents a USD 600 million captive pool over five years, while domestic producers Shyam Metalics, AISCO, and Synergy Steels still trail demand. Imports from Indonesia and Vietnam are filling the gap despite a 5% basic customs duty, underscoring supply-side tightness. Insurers are already pricing corrosion risk into coastal property premiums, raising private-sector interest. As regulatory compliance becomes a default project requirement, the stainless steel market gains an anchor demand stream insulated from construction cycles.
LNG and Cryogenic Storage Build-Out Across Asia
Asia’s shift from coal to natural gas is spawning a wave of LNG terminals, each large tank using up to 3,000 tons of 304, 316L, or 321 stainless steel[2]Petroleum and Natural Gas Regulatory Board, “LNG Infrastructure Approvals,” pngrb.gov.in. China’s 14th Five-Year Plan targets 100 million t/y of LNG import capacity, while India approved five new terminals in 2024 that add 10 million t/y of regasification. Membrane-type containment systems, favored for thin-gauge stainless sheets, amplify volume intensity. Indonesia and Malaysia are fielding floating storage and regasification units to serve archipelagic grids, spreading procurement across multiple fabricators. Because LNG infrastructure is classified as strategic, project timelines and offtake contracts cushion demand from macroeconomic swings, securing a medium-term floor for the stainless steel market.
Replacement of Food-Processing Equipment Under U.S. FSMA
The U.S. FDA issued 127 warning letters in 2024 citing equipment surface deficiencies under 21 CFR 110.35, 110.37, and 110.40, compelling processors to retrofit with 304 or 316L stainless assemblies. Dairy, meat, and beverage plants are spending USD 0.5–2 million per site to upgrade conveyors, mixers, and storage vessels. The Sanitary Transportation Rule, finalized in 2024, extends smooth-surface requirements to bulk tankers, injecting 15,000–20,000 tons of annual stainless demand into the logistics chain. Europe is aligning via Regulation (EC) 852/2004, and China’s revised GB 14881 standard takes effect in 2025, signaling parallel upgrade cycles. Because hygiene compliance is mandatory and recurring every 10–15 years, the stainless steel market enjoys an embedded replacement cadence.
Green-Hydrogen Electrolyzer Adoption in EU Boosting Demand for Duplex Grade
Europe’s REPowerEU plan aims for 10 million t/y of domestic hydrogen by 2030, and alkaline electrolyzers typically consume 5–7 tons of duplex stainless per MW. thyssenkrupp nucera will supply 700 MW to H2 Green Steel’s Swedish complex, requiring as much as 4,900 tons of DSS 2304, 2205, and 2507. DSS 2906 extends electrode life to 80,000 hours, cutting total ownership cost 20%. Yet the European Court of Auditors warned in 2025 that production costs range USD 3.40–12.00/kg, far above gray hydrogen. Subsidy pullbacks could temper duplex growth rates, but early-stage projects lock in near-term volume.
Restraint Impact Analysis
| Restraints | (~) % Impact on CAGR Forecast | Geographic Relevance | Impact Timeline |
|---|---|---|---|
| Nickel-price volatility prompting appliance OEM substitution | -0.9% | Global, with acute impact in Asia-Pacific appliance hubs | Short term (≤ 2 years) |
| EU anti-dumping tariffs on Chinese imports | -0.6% | Europe, with secondary effects in North America and Middle East | Medium term (2-4 years) |
| Availability of substitutes (aluminum, engineered plastics) | -0.5% | Global, concentrated in automotive and consumer goods | Long term (≥ 4 years) |
| Source: Mordor Intelligence | |||
Nickel-Price Volatility Prompting Appliance OEM Substitution
London Metal Exchange nickel averaged USD 16,812/ton in 2024, dropped to USD 15,000/t mid-2025, and rebounded to USD 16,247/t in March 2025, a 30% swing that destabilized mill margins. The World Bank projects USD 15,500/t in 2026, yet volatility pushes OEMs toward 200-series or aluminum liners in washing machines and refrigerators. Nornickel data show stainless steel still consumed 65% of primary nickel in 2024, but the International Energy Agency expects cleantech to seize 35% by 2030, constricting supply. Each 10% rise in nickel prices shaves 3–4 points off mill EBITDA, leading to downstream price hikes that curb volume in cost-sensitive segments of the stainless steel market.
EU Anti-Dumping Tariffs on Chinese Imports
Brussels maintained 24.6% duties on Chinese cold-rolled stainless, added 20.5% countervailing duties on Indonesian coil extended to Taiwan and Vietnam, and imposed 48.3–71.9% penalties on Chinese seamless pipe under Regulations 2025/1573 and 2024/1475. Landed costs rose 15–20%, driving European buyers toward Outokumpu, Acerinox, Aperam, and Indian mills such as Jindal Stainless. China’s Ministry of Commerce retaliated with anti-subsidy probes, fragmenting trade flows, elongating lead times, and suppressing stainless steel market efficiency in contested regions.
Segment Analysis
By Product Type: Flat Products Anchor Volume Growth
Flat products commanded a 67.20% stainless steel market share in 2025 and are tracking a 5.14% CAGR through 2031. Construction facades, automotive body panels, and appliance casings favor coil, sheet, and plate for surface uniformity and forming versatility, anchoring the stainless steel market size for flat products at 11 million tons in 2026. Thin-gauge cold-rolled coil carries a 20–30% premium over hot-rolled, making it a high-margin focus for Tata Steel’s 1 million ton/year Odisha line that started in 2024. As architecture pursues lighter curtain-wall systems, demand for 1.2 mm sheets accelerates, pushing mills toward advanced annealing and pickling lines.
Long products accounted for significant market volume in 2025 but hold defensible positions in reinforcing bar, wire rod, and marine fasteners. India’s coastal rebar mandate injects a structural pull expected to reach 0.3 million tons per year by 2027. Although aluminum wire competes in electrical cabling, duplex-grade bar retains offshore drilling and desalination niches. Overall, the stainless steel market finds a demand bifurcation: flat products grow via infrastructure and consumer goods, while long products serve specialty, high-performance applications.
By Form: Cold-Rolled Dominance Reflects Finish Premiums
Cold-rolled material held 54.11% stainless steel market share in 2025 and is expanding at a 5.11% CAGR. Cold rolling produces ±0.05 mm tolerances, and mirror finishes are essential for visible kitchen, elevator, and vehicle panels. The FDA’s sanitary design rules institutionalize cold-rolled 304/316L in food-contact surfaces, making replacements non-discretionary every decade. Mills with inline bright-anneal capacity capture higher price realization, typically USD 150–200/t over standard annealed material.
Hot-rolled stainless steel meets structural requirements in bridges and water pipelines financed under India’s USD 1.4 trillion infrastructure plan. It sacrifices finish for cost and high thickness availability. Cold-drawn wire caters to medical sutures and aerospace bolts where ±0.01 mm diameter accuracy commands a USD 500/ton premium. The tri-layered form landscape allows mills to calibrate product mix in response to margin swings.
By Grade: 300 Series Leads, Duplex Accelerates
The 300 series accounted for the 56.18% share of the stainless steel market size in 2025, positioning it as the backbone of the stainless steel market. Weldability and corrosion resistance secure its dominance in food processing and building exteriors. Nickel volatility, however, drives appliance producers toward 200-series grades, diluting share in low-stress segments. Duplex alloys, though only 6% share, chart the steepest 5.29% CAGR on electrolyzer, offshore, and desalination uses.
Ferritic 400-series grades meet exhaust-system heat resistance in Europe’s Euro-7 standards, while precipitation-hardening alloys like 17-4 PH satisfy aerospace strength requirements at price points exceeding USD 4,000/ton. Each grade cluster thus occupies clear techno-economic territory, letting mills segment pricing strategies.
Note: Segment shares of all individual segments available upon report purchase
By Application: Construction Anchors, Automotive Accelerates
Construction absorbed 36.47% of 2025 demand, anchored in facades, roofing, and rebar within 30 km coastal zones MORTH.NIC.IN. Stainless’s 75-year service life offsets its triple cost versus carbon steel, a calculus embedded in India’s INR 5,000 crore Jajpur expansion and the U.S. Infrastructure Investment and Jobs Act DOT.GOV. Automotive and transportation logged the fastest 5.27% CAGR by adopting stainless for battery enclosures and hydrogen fuel-cell stacks.
Metal products maintain mid-single-digit growth in industrial fasteners, while electrical machinery absorbs thin-gauge sheets for transformer housings. Mechanical engineering—pumps and heat exchangers—remains steady, benefiting from long replacement intervals. Medical, chemical, and pulp sectors, though small, sustain double-digit margins due to stringent material handling codes.
Note: Segment shares of all individual segments available upon report purchase
Geography Analysis
Asia-Pacific controlled 61.29% of the 2025 volume and is accelerating at 5.34%, cementing its role as the stainless steel market epicenter. China, a leading producer in the region, faces moderating domestic uptake as property starts to decline; mills pivot exports toward tariff-light regions such as Southeast Asia and Africa. India’s pipeline, valued at USD 1.4 trillion, channels stainless into metro rail, desalination, and coastal bridges, with Jindal Stainless now able to supply 2.1 million ton/year from its enlarged Jajpur site. Indonesia’s Tsingshan leverages captive nickel, driving costs 15–20% below global averages and flooding ASEAN with competitively priced coil.
North America's stainless steel market demand is lifted by the U.S. Infrastructure Act’s USD 1.2 trillion allocation and FDA-driven sanitary retrofits that add 20,000 tons/year demand. Mexico’s 3.5 million vehicle output benefits from USMCA incentives, sustaining exhaust-system stainless uptake. Europe navigates anti-dumping tariffs that elevate domestic prices but stimulate investments in duplex electrolyzer components under REPowerEU targets.
South America and the Middle East–Africa are witnessing a rising demand driven by oil-and-gas pipelines in Brazil’s pre-salt fields and desalination plants in the Gulf. Regional diversification of supply blunts tariff exposure and creates multi-polar stainless steel market trade routes.
Competitive Landscape
The global stainless-steel market is characterized by moderate fragmentation, with companies increasingly pursuing strategic consolidation to achieve economies of scale and expand their geographic presence. Sustainability has emerged as a critical competitive factor. For example, Outokumpu has introduced Circle Green stainless steel, which leverages 100% recycled content and renewable energy to achieve a carbon footprint as low as 7% of the global average. The competitive landscape is further influenced by trade tensions and anti-dumping measures, which create regional market imbalances. These measures often favor local producers in protected markets while imposing challenges on exporters facing tariff barriers. Technological advancements, including digital twins, laser welding, and additive manufacturing, are redefining the industry. These innovations enhance productivity and enable the development of customized geometries, particularly benefiting the aerospace and medical sectors.
Stainless Steel Industry Leaders
TSINGSHAN HOLDING GROUP
China BaoWu Steel Group Corporation Limited
POSCO
Acerinox
Outokumpu
- *Disclaimer: Major Players sorted in no particular order
Recent Industry Developments
- January 2025: Jindal Stainless completed a Jajpur expansion to 2.1 million t/y, adding cold-rolling and annealing lines targeting automotive and appliance sheet.
- November 2024: Tata Steel finalized the USD 1.27 billion acquisition of Neelachal Ispat Nigam, gaining 1 million t/y crude stainless capacity and captive chromite mines.
- October 2024: POSCO unveiled a KRW 121 trillion (USD 91 billion) cap-ex blueprint through 2026, earmarking funds for green-steel pilots and high-value stainless grades.
Research Methodology Framework and Report Scope
Market Definitions and Key Coverage
Mordor Intelligence defines the stainless-steel market as the aggregate melt-shop production and first-sale shipments of corrosion-resistant iron-based alloys that contain at least 10.5% chromium and, when required, nickel, molybdenum, or other elements to achieve specified mechanical and aesthetic properties. Markets for downstream fabricated products, scrap trading, and specialty alloys such as super-duplex grades are outside the scope.
Scope exclusion: powder metallurgy stainless, clad plate, and castings remain beyond the present study.
Segmentation Overview
- By Product Type
- Flat Products (Coil, Sheets, Plates)
- Long Products (Bars, rods and wire)
- By Form
- Hot Rolled
- Cold Rolled
- Cold Drawn
- By Grade
- 200 Series
- 300 Series
- 400 Series
- Duplex
- Precipitation-Hardening and Others
- By Application
- Building and Construction
- Automotive and Transportation
- Metal Products
- Electrical Machinery
- Mechanical Engineering
- Other Applications
- By Geography
- Asia-Pacific
- China
- India
- Japan
- South Korea
- Malaysia
- Thailand
- Indonesia
- Vietnam
- Rest of Asia-Pacific
- North America
- United States
- Canada
- Mexico
- Europe
- Germany
- United Kingdom
- France
- Italy
- Spain
- Nordics
- Turkey
- Russia
- Rest of Europe
- South America
- Brazil
- Argentina
- Colombia
- Rest of South America
- Middle-East and Africa
- Saudi Arabia
- Qatar
- United Arab Emirates
- Turkey
- South Africa
- Nigeria
- Egypt
- Rest of Middle-East and Africa
- Asia-Pacific
Detailed Research Methodology and Data Validation
Primary Research
Mordor analysts conducted interviews with melt-shop planners in Asia, European service center buyers, construction contractors, and automotive materials engineers across key producing and consuming nations. These discussions confirmed utilization rates, alloy surcharge pass-through, and regional demand pivots, allowing us to tighten assumptions harvested from secondary material.
Desk Research
Our analysts begin with public datasets that track stainless steel flows, such as annual melt-shop output from the International Stainless Steel Forum, UN Comtrade customs codes for 72xx HTS categories, and capacity filings posted by regional associations like Eurofer and the Specialty Steel Industry of North America. Company 10-Ks, investor decks, and export refund registers further refine grade mixes and average selling prices. Subscription resources, D&B Hoovers for plant-level revenues and Dow Jones Factiva for transaction news, anchor corporate splits. Patent libraries on Questel and shipment tallies from Volza help spot emerging uses and trade corridors. The sources listed illustrate, not exhaust, the evidence base that underpins desk research.
Market-Sizing & Forecasting
A blended top-down build starts with ISSF production, net imports, and verified inventory swings to recreate apparent consumption by region. We then cross-check totals with selective bottom-up tests, supplier roll-ups of slab capacity and sampled average selling price times volume, for credibility. Variables such as residential floor space completions, light vehicle output, nickel price premia, recycling intensity, and grade mix shifts feed a multivariate regression and scenario analysis to forecast demand through 2030. Gaps in bottom-up coverage are bridged with channel checks and median ASP ladders derived from primary interviews.
Data Validation & Update Cycle
Outputs run through variance filters against historical elasticity bands; anomalies trigger a second analyst review before sign-off. Models refresh annually, with mid-cycle updates when visible events, trade rulings, smelter outages, or policy shocks, move the baseline.
Why Our Stainless Steel Baseline Earns Uncommon Trust
Published estimates differ because firms choose distinct units, pricing assumptions, and refresh cadences.
Understanding these levers is crucial for users comparing numbers.
Benchmark comparison
| Market Size | Anonymized source | Primary gap driver |
|---|---|---|
| 13.37 million tons (2025) | Mordor Intelligence | - |
| USD 216.16 billion (2024) | Global Consultancy A | Reports revenue only and excludes long product tonnage, leading to larger value yet unaligned volume base. |
| USD 126.36 billion (2024) | Trade Journal B | Uses spot alloy surcharges without regional weighting and omits 200-series volumes, trimming overall size. |
The comparison shows that when scope, unit of account, and update rhythm diverge, headline numbers shift markedly.
By starting with melt-shop tonnage, layering price discovery from tier-1 interviews, and revisiting the model each year, Mordor delivers a balanced, transparent baseline that decision-makers can retrace and audit with confidence.
Key Questions Answered in the Report
How large is the global stainless steel market in volume terms for 2026?
The stainless steel market size is estimated at 14 million tons in 2026 and is forecast to reach 17.63 million tons by 2031.
Which stainless steel product category holds the largest share?
Flat products, including coil, sheets, and plate, commanded 67.20% of 2025 volume thanks to widespread use in construction and appliances.
Why is duplex stainless steel growing faster than other grades?
Duplex alloys combine high strength with superior corrosion resistance, making them ideal for hydrogen electrolyzers and offshore platforms, which are scaling rapidly in Europe.
What region consumes the most stainless steel?
Asia-Pacific accounted for 61.29% of the 2025 global volume, driven by infrastructure spending in China, India, and emerging Southeast Asian economies.
How are nickel price swings affecting stainless demand?
Volatile nickel prices are pushing appliance makers toward 200-series grades or aluminum, trimming near-term growth in cost-sensitive segments of the stainless steel market.
Which companies lead global stainless production?
China BaoWu, Tsingshan Holding Group, POSCO, Nippon Steel, and Outokumpu rank among the top producers, collectively covering a significant share of world capacity.


