
Bitumen Membranes Market Size and Share
Market Overview
| Study Period | 2020 - 2031 |
|---|---|
| Market Volume (2026) | 1.17 Billion cubic meters |
| Market Volume (2031) | 1.3 Billion cubic meters |
| Growth Rate (2026 - 2031) | 2.09 % |
| Fastest Growing Market | Asia Pacific |
| Largest Market | Asia Pacific |
| Market Concentration | Low |
Major Players *Disclaimer: Major Players sorted in no particular order Image © Mordor Intelligence. Reuse requires attribution under CC BY 4.0. | |
Bitumen Membranes Market Analysis by Mordor Intelligence
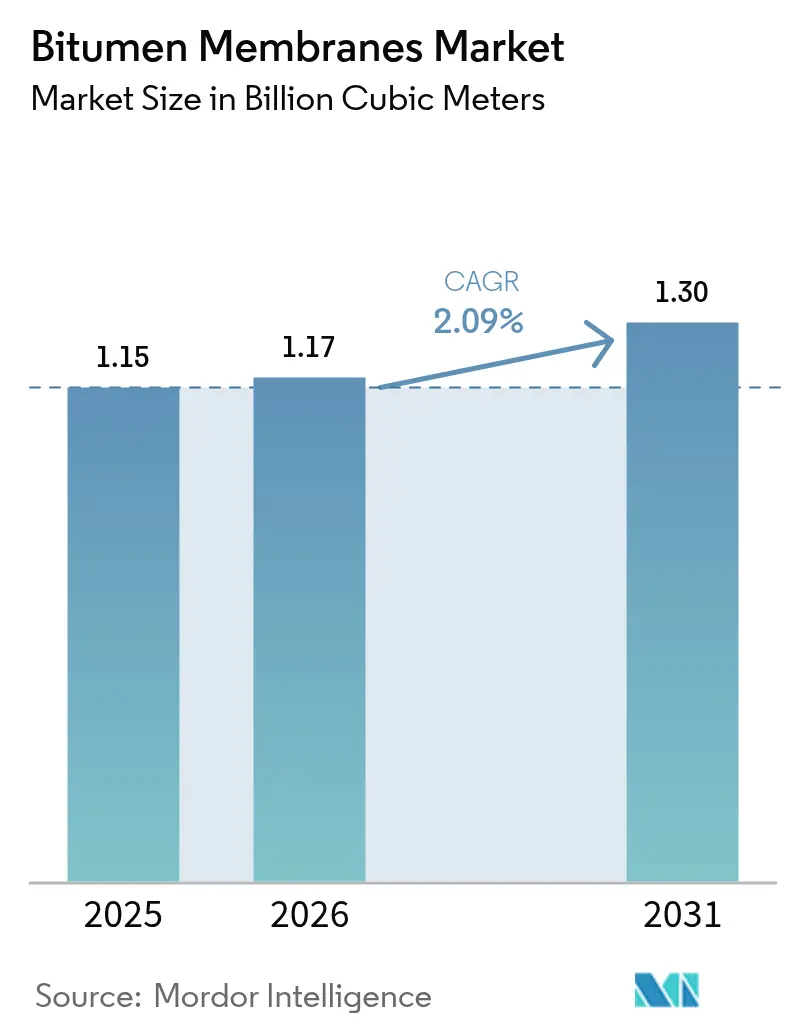
The Bitumen Membranes Market size is expected to grow from 1.15 billion cubic meters in 2025 to 1.17 billion cubic meters in 2026 and is forecast to reach 1.3 billion cubic meters by 2031 at 2.09% CAGR over 2026-2031. Stable public-sector capital spending, stricter waterproofing codes, and a shift toward flame-free installation collectively anchor this measured expansion. Contractors weigh lifetime performance and labor savings more heavily than upfront cost, favoring polymer-modified grades that withstand temperature swings and intense rainfall events. Producers leverage regional plants to minimize freight, hedge feedstock swings, and shorten lead times, while crude-linked bitumen price volatility remains the principal cost variable. As self-adhesive solutions displace torch-on systems in fire-restricted zones, manufacturers with proprietary adhesives and cool-roof coatings gain a competitive edge in energy-code-driven retrofit demand.
Key Report Takeaways
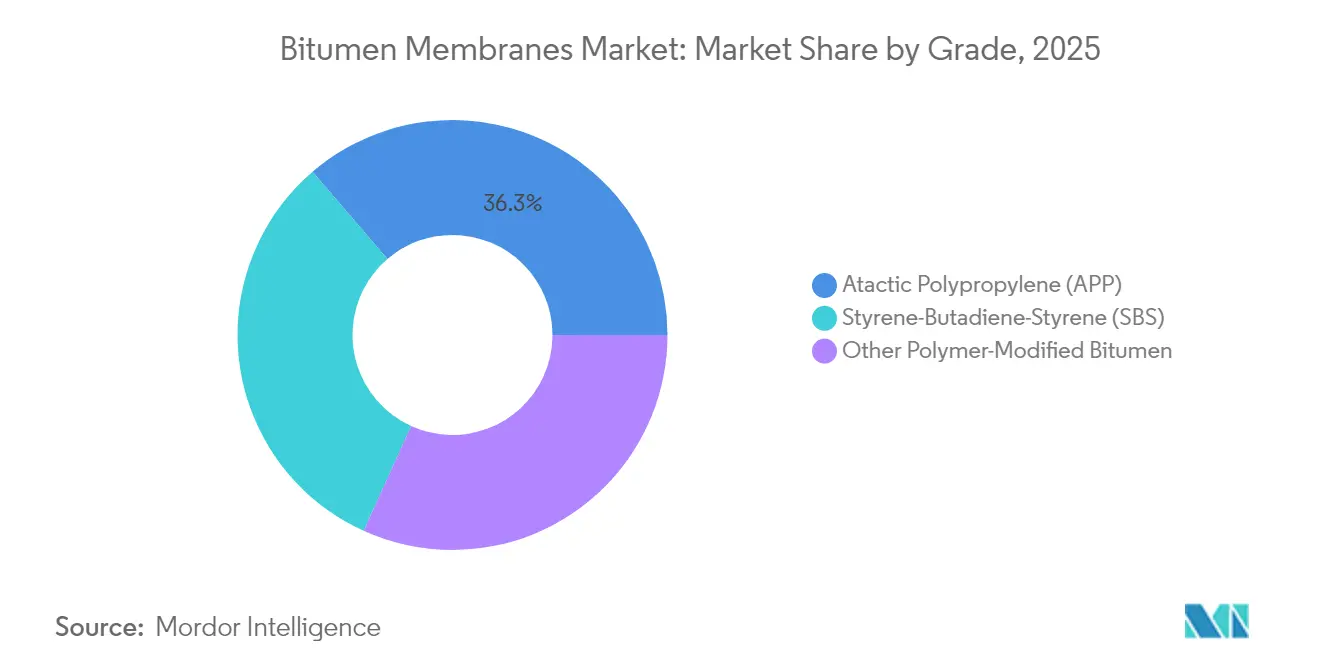
- By grade, APP led with 36.28% volume share in 2025, whereas SBS is advancing at a 2.22% CAGR through 2031.
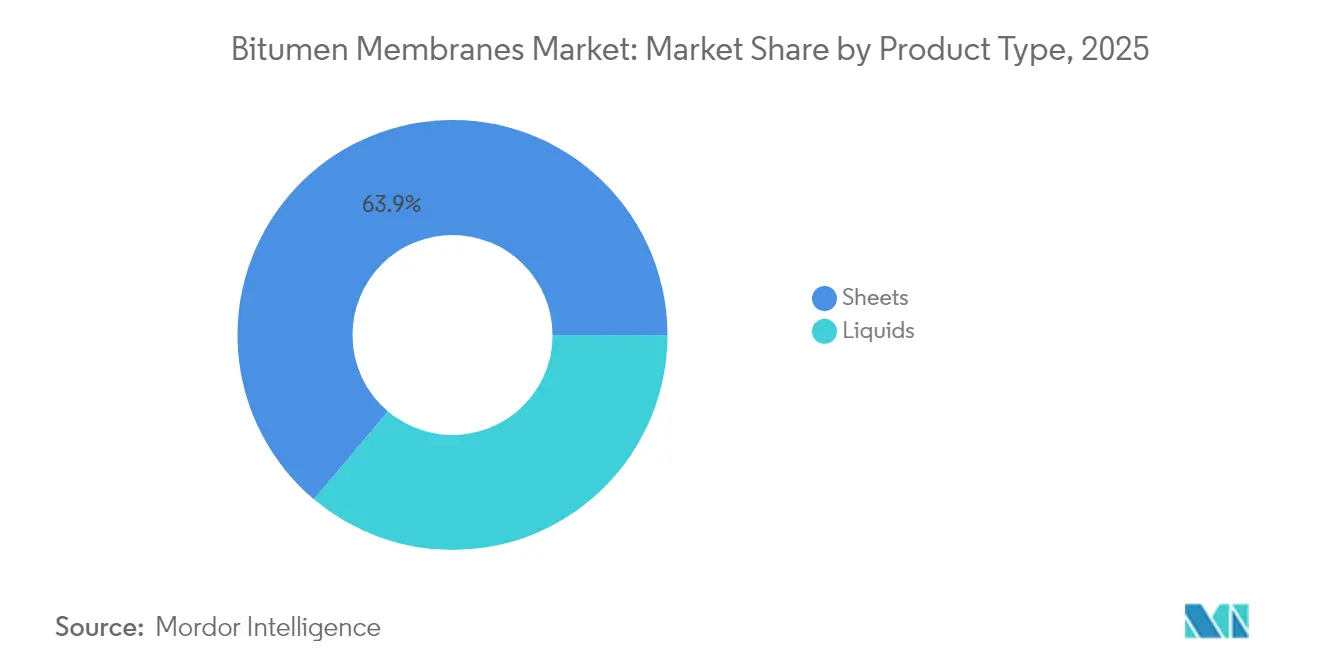
- By product type, sheets accounted for 63.85% of the bitumen membrane market share in 2025, while liquids are projected to log a 2.31% CAGR.
- By application, roofing captured 47.66% of the bitumen membrane market size in 2025; below-grade waterproofing is set to expand at a 2.23% CAGR by 2031.
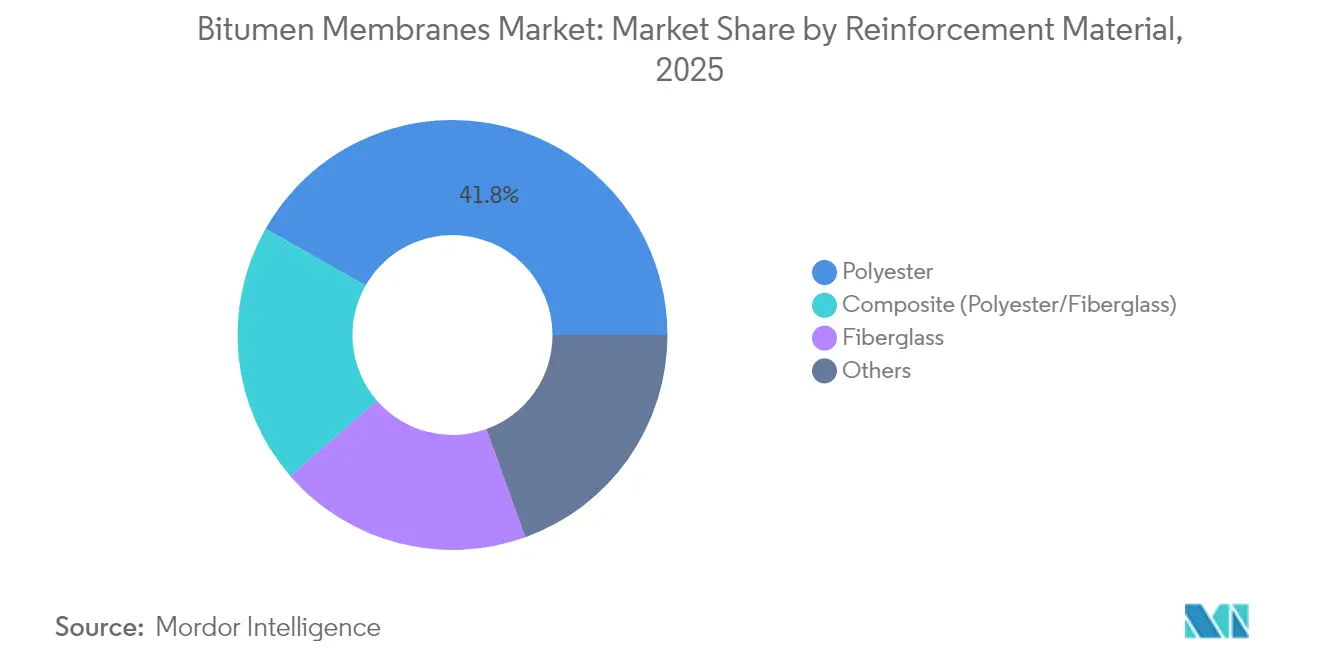
- By reinforcement, polyester dominated with a 41.78% share in 2025, and composite reinforcement is the fastest-growing at a 2.21% CAGR.
- By installation technology, torch-applied held a 35.64% share in 2025, but self-adhesive systems are expected to grow 3.18% CAGR.
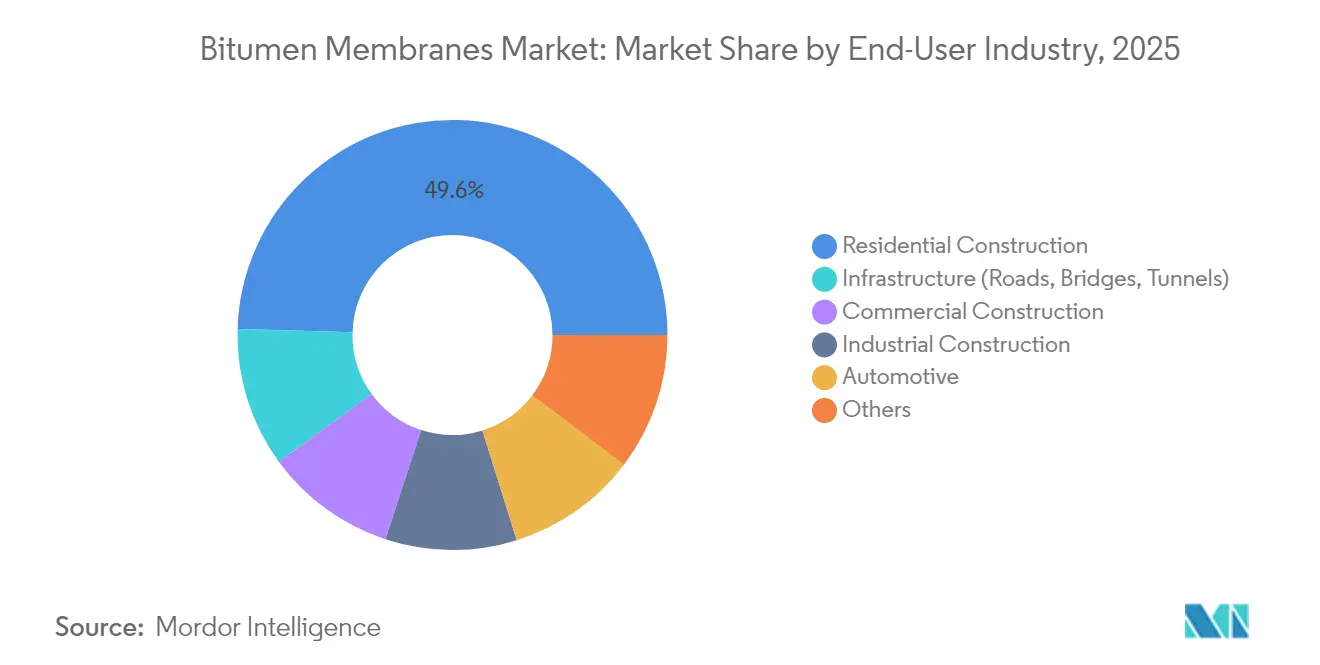
- By end-user, residential construction commanded a 49.55% share in 2025, whereas infrastructure projects posted the highest 2.43% CAGR to 2031.
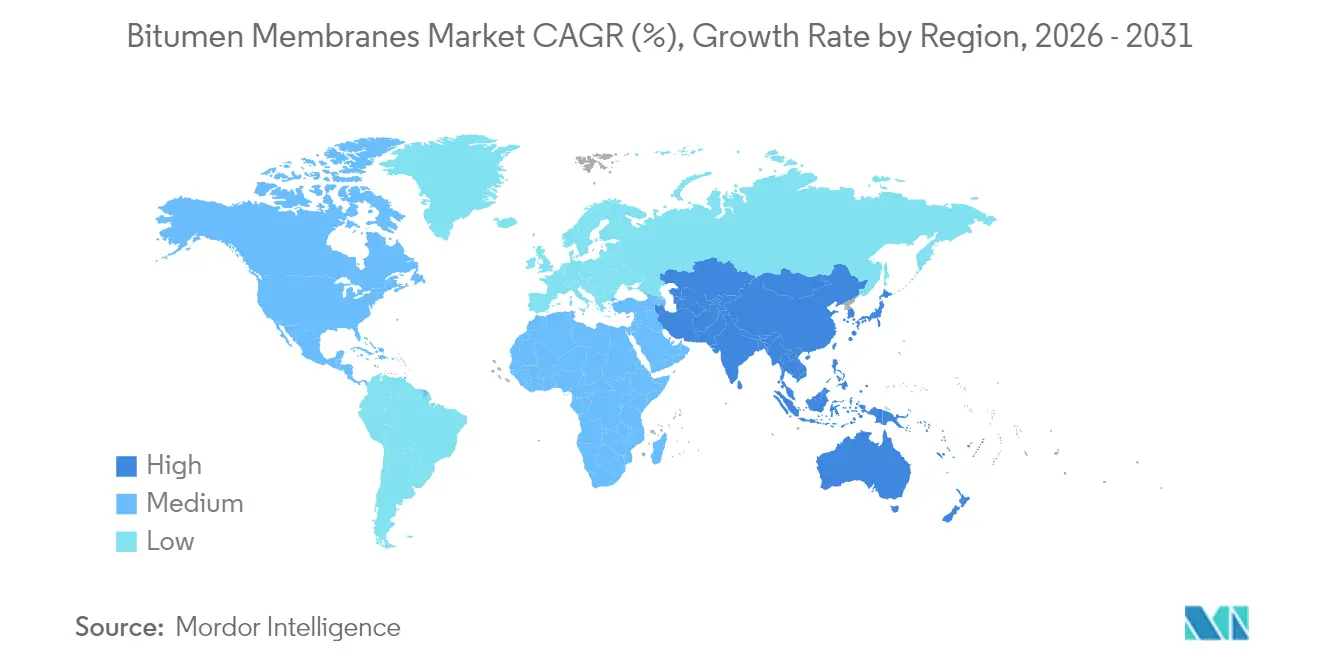
- By geography, Asia-Pacific led with 39.85% share in 2025 and shows the quickest regional pace at 2.21% CAGR.
Note: Market size and forecast figures in this report are generated using Mordor Intelligence’s proprietary estimation framework, updated with the latest available data and insights as of 2026.
Market Trends and Insights
Drivers Impact Analysis of Bitumen Membranes Market*
| Driver | (~) % Impact on CAGR Forecast | Geographic Relevance | Impact Timeline |
|---|---|---|---|
| Surge in APAC megacity infrastructure spending | +0.60% | Asia-Pacific core, spillover to MEA | Medium term (2-4 years) |
| Extreme-rainfall resilience retrofits | +0.50% | North America & Europe | Long term (≥ 4 years) |
| Energy-code compliance via cool-roof membranes | +0.40% | Global, led by California and EU | Medium term (2-4 years) |
| Growth of torch-free self-adhesive systems | +0.30% | Global, fire-restricted zones | Short term (≤ 2 years) |
| Predictive-maintenance contracts using digital leak detection | +0.20% | North America & Europe | Long term (≥ 4 years) |
| Source: Mordor Intelligence | |||
Surge in Infrastructure Spending Across APAC Megacities
Large-scale capital programs exceeding USD 9 trillion keep the bitumen membrane market firmly oriented toward Asia-Pacific growth. India’s FY 2025 budget earmarks Rs 11.11 lakh crore for transport corridors, industrial parks, and metro lines, each requiring extensive waterproofing. China’s USD 741.5 billion road outlays similarly sustain bridge-deck and tunnel membrane demand. Continual urban rail, airport, and logistics hub construction across ASEAN widens the specification base. The pipeline creates steady volume visibility for manufacturers investing in regional capacity, buffering them against cyclical housing dips.
Extreme-Rainfall Resilience Retrofits in Mature Economies
North American and European building codes increasingly reference hydrostatic head performance and seam integrity in response to intensifying rainfall patterns. Retrofit programs targeting roofs, foundations, and podium decks treat high-grade membranes as risk-mitigation assets. Insurers correlate water ingress claims with envelope failures, incentivizing owners to upgrade before loss events. Municipal resilience mandates widen the addressable retrofit pool, while extended warranties become critical differentiators among suppliers.
Energy-Code Compliance via Cool-Roof Bitumen Membranes
California’s Title 24 (2025) and EU Green Deal objectives raise minimum Solar Reflectance Index thresholds, spurring demand for reflective granule or coating technologies. Projects pairing rooftop photovoltaics with low-VOC, fire-rated membranes see specification pull from both energy and safety codes. Manufacturers that embed light-colored ceramic granules directly into SBS or APP blends report higher compliance pass rates and reduced on-site coating labor[1].
Growth of Torch-Free Self-Adhesive Membrane Systems
Regulators, insurers, and general contractors converge on open-flame restrictions, propelling self-adhesive uptake in dense urban and mass-timber projects. Peel-and-stick sheets cut installation time, eliminate propane handling, and reduce skilled-labor dependency. Early adopter data indicate 15% labor-cost savings and lower punch-list rework. Suppliers racing to refine adhesive tack life and cold-weather bond strength gain market share as legacy torch fleets age out.
Restraints Impact Analysis of Bitumen Membranes Market*
| Restraint | (~) % Impact on CAGR Forecast | Geographic Relevance | Impact Timeline |
|---|---|---|---|
| Occupational HSE concerns during torch-on installation | -0.40% | Global, acute in fire-restricted zones | Short term (≤ 2 years) |
| Crude-oil price volatility impacting bitumen costs | -0.30% | Global supply chain impact | Medium term (2-4 years) |
| Substitution threat from bio-based & TPO/EPDM membranes | -0.30% | North America & Europe early adoption | Long term (≥ 4 years) |
| Source: Mordor Intelligence | |||
Occupational HSE Concerns During Torch-On Installation
National fire codes and insurer guidelines now regard torch application as a high-hazard activity. UK HSE advisories underscore flash-over and fume exposure risks that escalate when untrained labor uses open flame on combustible substrates. Contractors absorb higher insurance premiums, fire-watch staffing, and ventilation costs, eroding the historical cost advantage of torch-on membranes. Training gaps intensify as skilled installers retire, leading builders to specify self-adhesive alternatives.
Crude-Oil Price Volatility Impacting Bitumen Costs
Bitumen feedstock tracks Brent crude, which cycled between USD 178 and USD 620 per ton from 2020-2024. Refinery utilization bottlenecks and logistical chokepoints add regional price spreads that squeeze non-integrated producers. Fixed-bid construction contracts expose contractors to cost overruns when the asphalt index surges outpace escalation clauses. Some manufacturers hedge with recycled shingle asphalt or bio-modified binders, though current supply volumes cannot offset mainstream demand.
*Our forecasts treat driver/restraint impacts as directional, not additive. The impact forecasts reflect baseline growth, mix effects, and variable interactions.
Bitumen Membranes Market Segment Analysis
By Grade:
SBS Flexibility Gains on APP DominanceAPP held 36.28% of the 2025 volume, underpinned by established sourcing and installer familiarity. The bitumen membrane market size for SBS grades is forecast to advance at a 2.22% CAGR, reflecting superior elasticity in freeze-thaw climates and better flow resistance in hot zones. Manufacturers incorporating bio-circular styrenic block copolymers address sustainability goals without diluting performance. Specification engineers increasingly trade modest upfront premiums for reduced crack-propagation risk over 20-year life cycles, reinforcing SBS momentum.
APP retains primacy in cost-sensitive public bids and regions with milder thermal cycling. Blends integrating recycled polymers help mitigate asphalt cost swings and respond to circular-economy procurement clauses. Specialty polymer variants serve bridge decks and chemical-exposure sites where mechanical and chemical endurance outweigh price. The grade split illustrates how performance-driven segments carve incremental gains while commodity volumes anchor plant utilization.

By Product Type:
Sheet Reliability Versus Liquid VersatilityFactory-produced sheets delivered a 63.85% share in 2025, thanks to tight thickness tolerances that underpin long warranty terms. Liquids, expanding at a 2.31% CAGR, suit irregular geometries, podium landscaping, and roof refurbishments requiring seamless detailing. Cold-applied liquids avoid kettle heating and carry lower smell footprints, a growing advantage in urban retrofits.
Hybrid assemblies pairing sheet field coverage with liquid flashings achieve both speed and detail robustness. Sheets remain preferred for high-traffic roofs due to puncture-resistant reinforcements, whereas liquids dominate planter boxes and vertical wall transitions. Producers marketing integrated primer-membrane-topcoat systems lock in chemical compatibility and widen aftermarket revenue streams.
By Application:
Roofing Core While Sub-Surface AcceleratesRoofing accounted for 47.66% of 2025 demand, a foundational driver for the bitumen membrane market. Below-grade waterproofing edges ahead at 2.23% CAGR as city basements, podium slabs, and utility tunnels expand. Bridge and parking decks add cyclical boosts tied to public-works outlays; specifications here emphasize tensile recovery under vehicular load.
Cool-roof mandates push roofing formulations toward high-albedo granules, drawing premium margins. Sub-surface membranes adopt double-bond or sandwich assemblies to counter hydrostatic pressure. Structural engineers scrutinize compatibility with crystalline waterproofing admixtures, leading to dual-system designs that combine positive-side bitumen sheets with negative-side integral treatments.
By Reinforcement Material:
Polyester Stability Meets Composite StrengthPolyester retained 41.78% share in 2025, balancing elongation, stiffness, and cost. Composites that stitch polyester and fiberglass are pacing at a 2.21% CAGR by spreading load paths across multiple fiber orientations. These hybrids resist puncture and shrinkage, enabling longer expansion-joint spans.
Fiberglass remains indispensable for fire-classified assemblies and chemically aggressive sites like wastewater tanks. Research into recycled PET-based polyester knits aligns reinforcement selection with corporate ESG targets. Advances in binder chemistry improve fiber-bitumen adhesion, boosting fatigue life under cyclical wind uplift on exposed roofs.
By Installation Technology:
Self-Adhesive Surges Past Torch LegacyTorch-applied maintained a 35.64% share in 2025 on entrenched contractor skill sets. Self-adhesive sheets, growing 3.18% CAGR, leverage peel-and-stick simplicity to curtail labor and insurance overhead. SeamShield-style protective films protect adhesive lanes, cutting weld failures by 10% during hoisting. Cold liquids serve niche refurbishments where roof access limits sheet maneuvering.
Heat-welded hot-mop methods persist in petrochemical sites demanding thick bitumen flood coats. Regulatory heat now centers on open flame, accelerating fleet retirement of torches and cylinders. Equipment makers counter with induction-welded lap tools, but adhesive chemistries progress faster, tilting adoption curves toward flame-free lines.
By End-User Industry:
Housing Base Underpinned by Infrastructure UpsideResidential construction composed 49.55% of 2025 consumption, anchored in code-mandated foundation and roof waterproofing. Infrastructure spending drives the leading 2.43% CAGR segment through bridges, metros, and water treatment plants specifying high-durability membranes. Commercial skylines add steady growth via energy-efficient roof retrofits in aging office stock.
Industrial and automotive niches prioritize chemical resistance and static-cut protection. Data centers—lifetime cost-conscious owners—deploy monitored membranes, integrating sensors specified at the design stage. Public-private-partnership projects often bundle preventive maintenance, advantaging brands offering full-life services.
Geography Analysis
APAC Bitumen Membranes Market
Asia-Pacific captured 39.85% 2025 volume and leads with a 2.21% CAGR as India and China push megaproject pipelines. India’s Rs 11.11 lakh crore allocation spans highways, dedicated freight corridors, and 14 metro systems, each funneling roofing and sub-surface membrane orders. China’s USD 741.5 billion road modernization sustains bridge-deck volumes, while ASEAN manufacturing zones lift warehouse roofing needs.
North America Bitumen Membranes Market
North America’s cyclical replacement cycles and stringent cool-roof codes deliver predictable volume and margin. Plant investments—IKO’s USD 390 million dual builds, Atlas Roofing’s USD 200 million Iowa line, and Owens Corning’s southeastern plant—shorten lead times and localize asphalt sourcing. California’s Title 24 shapes formulations nationwide as other states mirror its reflectance and VOC thresholds.
EMEA and South America Bitumen Membranes Market
Europe maintains balanced demand through renovation incentives and the pending 2026 Circular Economy Act. High-performance SBS sheets dominate flat-roof refurbishments in Germany and the Nordics, while Mediterranean rebuilds weigh cool-roof liquids to combat urban heat islands. Middle East and Africa gain traction via airport and desalination projects, yet political risk caps mega-project momentum. South America’s commodity-driven booms lift demand sporadically, with exchange-rate swings challenging import economics.
Regulatory Landscape
Regulation is focused on construction-product conformity, fire safety, and low-emission installation practices, with compliance increasingly tied to sustainability documentation. In China, the State Administration for Market Regulation issued GB 45320-2025 (March 28, 2025, effective October 1, 2025) for safety and general technical specifications for building waterproofing membranes, and issued GB/T 18242-2025 for elastomer/plastomer modified bitumen waterproofing membranes, replacing earlier 2008-era standards with implementation effective May 1, 2026.
In Europe, the recast Construction Products Regulation, Regulation (EU) 2024/3110, entered into force in 2025 and establishes a framework that includes digital product passports and sustainability labeling. The European Commission 2025 working plan (COM(2025) 772) sets milestones for harmonized technical specifications for membranes (Product Family #3), targeted through 2028. In the United States, product testing and specification alignment continue through ASTM standards, including the May 2026 update of ASTM D7694/D7694M for self-adhesive modified bituminous sheet materials, supporting the shift toward flame-free systems in fire-restricted and insurer-sensitive projects.
Value Chain Analysis
The value chain runs from petroleum-derived bitumen supply and polymer modifiers (APP/SBS) through reinforcement inputs (polyester, fiberglass, composites), manufacturing, distribution, and installation by roofing and waterproofing contractors. Typical formulations are dominated by bitumen (about 45-52%), followed by mineral fillers and surface treatments such as granules or films (about 18-41%), polymer modifiers (about 6-15%), and reinforcement mats (about 2-6%). Production involves high-temperature blending, coating or impregnating reinforcement on continuous lines, calendering, cooling, and finishing (granulated or film-faced rolls, or compatible primers and adhesives for self-adhesive systems).
Logistics and jobsite constraints affect economics, since rolls are bulky and heavy, making regional plants and distributor networks important for lead times and freight costs. Application conditions also create downstream bottlenecks: cold and wet substrates can drive blistering or adhesion failures, while torching requires controlled heating to avoid reinforcement damage and inconsistent bonding, which raises HSE and insurance burdens. As flame restrictions tighten, manufacturers, distributors, and contractor training ecosystems increasingly emphasize peel-and-stick sheets and cold-applied detailing liquids, alongside documentation such as EPDs to meet institutional procurement requirements.
Competitive Landscape
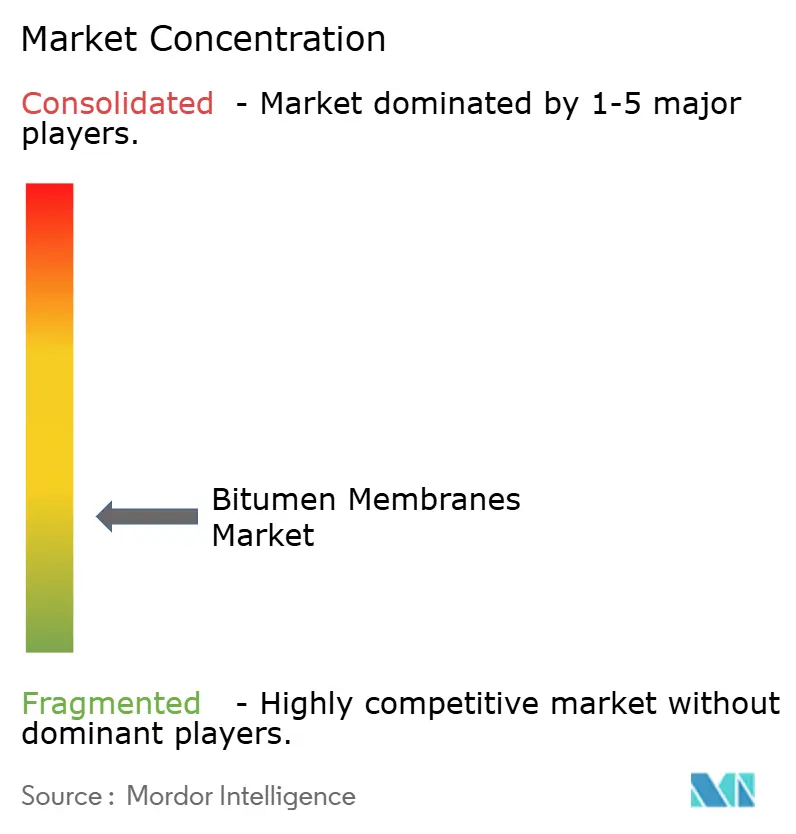
The bitumen membrane market remains highly fragmented; the top five players control roughly 30% combined share, creating room for regional specialists. Vertical integration into asphalt processing insulates leaders from crude swings. IKO’s USD 120 million Missouri plant and USD 270 million Florida complex enhance U.S. Gulf Coast logistics, while Atlas Roofing’s Iowa build targets Midwest supply gaps. GAF expands capacity in Kansas and Georgia to anchor its national distribution grid.
Product innovation centers on self-adhesive adhesives, reflective granulate chemistry, and recycled asphalt integration. Owens Corning’s pilot shingles using reclaimed asphalt hit commercial scale in 2025, signaling circular economy traction. TAMKO’s investment in Northstar Clean Technologies positions it for recycled-content feedstock, diversifying bitumen sources. Digital add-ons, such as cloud-linked leak-detection platforms, differentiate premium lines and underpin service contracts.
Partnerships with membrane-compatible PV mounting firms and cool-roof coating specialists broaden application ecosystems. Firms emphasize training academies to accelerate contractor conversion from torch to peel-and-stick, shrinking warranty claims. Regional challengers leverage government incentives to set up new lines closer to growth corridors, but capital barriers and warranty bankability limit their leap to global scale.
Bitumen Membranes Industry Leaders
-
BMI Group
-
GAF Materials LLC
-
IKO PLC
-
SOPREMA Group
-
Sika AG
- *Disclaimer: Major Players sorted in no particular order
Bitumen Membranes Market Companies Covered in this Report
- ARDEX Group
- BASF SE
- BMI Group
- Bondall
- Carlisle SynTec Systems
- Derbigum
- Firestone Building Products Company, LLC
- GAF Materials LLC
- IKO PLC
- Isoltema SpA
- Johns Manville
- Oriental Yuhong
- Polyglass S.p.A.
- RENOLIT SE
- Sika AG
- SOPREMA Group
- TECHNONICOL
- Tiki Tar Industries India Ltd
- TotalEnergies
Market Opportunities and Future Outlook
Flame-free installation and compliance-led specification are opening whitespace for self-adhesive modified bitumen sheets, low-VOC accessory systems, and integrated cool-roof or reflective surfacing that simplify code compliance in retrofit-heavy markets. A concrete signal of supplier positioning around North American roofing demand is Saint-Gobain's completion of a USD 100 million expansion at its CertainTeed Roofing facility in Peachtree City, Georgia in February 2026, which doubled production capacity for roofing products and supports shorter regional lead times for contractors and distributors.
Sustainability documentation is increasingly treated as a procurement gate, particularly in Europe where EPD cycles are forcing renewals. Eight EPDs for bituminous roofing products in Europe are noted as expiring in 2026, pushing suppliers to refresh EN 15804-aligned disclosures to remain eligible for public and institutional bid lists. At the same time, capacity additions in India reflect demand for polymer-modified waterproofing tied to infrastructure and urban development: Bitumag Industries commissioned a second production line for polymer-modified bitumen waterproofing membranes, taking annual capacity to over 10 million square meters and reinforcing a shift toward local manufacturing scale close to major project pipelines.
Recent Industry Developments in Bitumen Membranes Market
- July 2026: Robust Construction Chemicals released Robust Bitumen Membrane Foil Aluminium for industrial and residential waterproofing projects in Pakistan. The foil-faced format targets durability and barrier performance in demanding environments, broadening the local product mix beyond standard roll goods. The launch highlights the role of regional players in widening availability in emerging markets where distribution reach and on-site practicality influence material choice.
- May 2026: Forspec Protective Coatings introduced the FORZAFLEX torch-applied waterproofing system, a multi-layer APP modified bitumen membrane range for the Australian market. The expanded system offering increases contractor choice for projects that continue to specify torch-on assemblies, while packaging a defined multi-layer build-up for consistent installation outcomes. It also adds competitive pressure on incumbent suppliers to differentiate via safety-led alternatives and documented performance.
- April 2025: Sika Corporation announced the US market launch of its SikaShield branded modified bitumen roofing products, including the HB79 hybrid membrane. Bringing a branded modified-bitumen platform into the United States strengthens Sika's positioning across roofing and waterproofing specifications and expands cross-selling with its broader building-envelope portfolio. The move also supports contractor adoption through a single supplier ecosystem spanning membranes, accessories, and system warranties.
Bitumen Membranes Market Report Scope and Research Methodology
Market Definition and Coverage
This market covers factory-made bitumen-based waterproofing membranes sold as rolls or liquid-applied systems for buildings and civil structures, where the purpose is to prevent water ingress in roofing and below-grade areas.
Scope exclusions: It does not count non-membrane bitumen products such as paving-grade asphalt, road binders, and general sealants that are not sold as a membrane system.
Segments Covered in This Report
- By Grade
- Atactic Polypropylene (APP)
- Styrene-Butadiene-Styrene (SBS)
- Other Polymer-Modified Bitumen
- By Product Type
- Sheets
- Liquids
- By Application
- Roofing
- Below-Grade Waterproofing
- Bridge and Parking Decks
- Other Structural Waterproofing
- By Reinforcement Material
- Polyester
- Fiberglass
- Composite (Polyester/Fiberglass)
- Others
- By Installation Technology
- Torch-Applied
- Self-Adhesive (Peel and Stick)
- Cold-Applied (Liquid)
- Heat-Welded / Hot-Mop
- By End-User Industry
- Residential Construction
- Commercial Construction
- Industrial Construction
- Infrastructure (Roads, Bridges, Tunnels)
- Automotive
- Others
- By Geography
- Asia-Pacific
- China
- India
- Japan
- South Korea
- Malaysia
- Thailand
- Indonesia
- Vietnam
- Rest of Asia-Pacific
- North America
- United States
- Canada
- Mexico
- Europe
- Germany
- United Kingdom
- France
- Italy
- Spain
- Nordic Countries
- Turkey
- Russia
- Rest of Europe
- South America
- Brazil
- Argentina
- Colombia
- Rest of South America
- Middle-East and Africa
- Saudi Arabia
- Qatar
- United Arab Emirates
- South Africa
- Nigeria
- Egypt
- Rest of Middle-East and Africa
- Asia-Pacific
Data Sources, Market Sizing, and Validation
Desk Research
Desk work starts with a demand map for waterproofing activity tied to construction output, then translates that into membrane needs by use case. We lean on public construction and macro indicators such as US Census Bureau construction spending, Eurostat construction production indices, and national statistics offices in major countries.
To tighten the story, we also review sources such as UN Comtrade trade data for relevant membrane and waterproofing-related codes, building code and standards body publications, and peer-reviewed papers on roofing and waterproofing durability that help explain replacement cycles. Company annual reports, investor presentations, and reputable press coverage are used to understand product mix shifts and pricing direction. Select paid subscriptions are used for company financials and patent lookups, and an import and export shipment-level database is used in a limited way for sense checks. These examples are illustrative, and we also used other public sources for data collection, validation, and research clarification.
Primary Interviews and Surveys
Primary work is used to pressure-test our desk assumptions on where membranes are specified, how often they are replaced, and how pricing moves across grades and installation methods. Interviews included manufacturers, distributors, applicators, and project-side stakeholders across major construction markets. Expert inputs were also used to confirm region-level demand shifts and typical mix between roofing and below-grade waterproofing.
Distribution of primary research fieldwork respondents
| Company type | Respondent position | Region |
|---|---|---|
| Top tier: 33% | CXOs: 17% | APAC: 42% |
| Mid tier: 45% | Functional/Unit leaders: 28% | EMEA: 33% |
| Smaller Players: 22% | Managers: 55% | Americas: 25% |
Market-Sizing & Forecasting
Our sizing logic uses top-down and bottom-up together, but it is built first from a top-down demand pool that is reconstructed from construction activity and waterproofed area needs. Country-level construction output, new-build versus renovation split, roofing and foundation waterproofing adoption rates, typical membrane thickness and coverage, and installation method mix are treated as core inputs because they link directly to volume demand.
Once the volume view is shaped, we translate it into value using region-level average selling price bands that are checked through channel discussions and tender observations where available. Selective bottom-up approximations are then used to corroborate totals, such as roll-ups from a sample of suppliers and distributor channel checks, followed by sampled price per square meter times estimated installed area. When a data point is missing for a smaller country, we bridge the gap with proxy indicators like construction permits, cement consumption trends, or import intensity, then adjust it using interview feedback.
For forecasting, scenario analysis is used so slower construction cycles, faster renovation activity, and raw material price swings can be reflected without over-fitting the model. The final forward view is set only after variable trends are reviewed with industry respondents, and the assumptions are kept easy to trace back to the underlying input series.
Data Validation & Update Cycle
Before numbers are finalized, estimates are triangulated against independent signals such as construction output growth, import and export direction, and observable pricing movement, and then variances are investigated. If a country shows a jump that does not match project activity or trade flows, we revisit penetration and replacement assumptions and re-contact sources when needed. A second analyst review is completed for logic, units, and conversion factors before sign-off.
Reports are refreshed annually, and interim updates are made when a material event is likely to change demand or pricing. Right before delivery, we do a fresh review pass so clients receive an updated view that is consistent with the latest data available.
Mordor Intelligence's Bitumen Membranes Market Size Compared With Other Published Estimates
Published market sizes for bitumen membranes can look far apart because the underlying counting rules are not always the same, even when the titles sound similar. Differences usually come from what gets included as a membrane, which year is treated as the base, and whether the number is built from installed area logic or from revenue assumptions.
Some published figures bundle the full waterproofing membrane universe or add adjacent roofing materials that are not bitumen-based. In Mordor Intelligence sizing, value is derived only after the demand pool is built from bitumen membrane usage in roofing and below-grade waterproofing, and the estimate is presented as volume-based market size rather than a single USD revenue number. This narrower scope changes the final totals compared with broader definitions.
Benchmark comparison
| Source | Market Size | Gaps in Research Methodology |
|---|---|---|
| Mordor Intelligence | USD 0.00 B (2026) | |
| Global Consultancy A | USD 11.50 B (2024) | This estimate is revenue-led and broader in practice, since it typically converts multiple membrane types and applications into a single USD total, and the scope notes do not clearly separate bitumen-only membranes from adjacent waterproofing systems. |
| Industry Publisher B | USD 5.14 B (2024) | The growth rate and end-year projection suggest a more aggressive scenario set, and the definitions appear to mix in wider waterproofing uses beyond the core roofing and below-grade membrane demand pool. This can shift both volumes and pricing assumptions. |
The spread is mainly explained by scope width and the choice of sizing unit. Volume-first models behave differently than revenue-first models when grades, thickness, and installation methods vary by region. By keeping the inputs tied to installed demand drivers and then stress-checking price bands through interviews, the results stay easier to repeat and audit over time.
Key Questions Answered in the Report
How large is the bitumen membrane market in 2026?
It stood at 1.17 billion cubic meters in 2026 and is forecast to reach 1.3 billion cubic meters by 2031, representing a 2.09% CAGR.
Which region leads demand for bitumen membranes through 2031?
Asia-Pacific holds 39.85% 2025 share and posts the fastest 2.21% CAGR as India, China, and ASEAN maintain heavy infrastructure pipelines.
Why are self-adhesive membranes growing faster than torch-on systems?
Fire-code restrictions, labor-savings, and insurance incentives make flame-free peel-and-stick sheets attractive, resulting in a 3.18% CAGR for self-adhesive installations.
Which grade of bitumen membrane is gaining traction?
SBS-modified membranes are rising at 2.22% CAGR thanks to superior flexibility and temperature resistance, even though APP still owns the largest share.
How does crude-oil volatility affect membrane manufacturers?
Asphalt feedstock price swings squeeze margins for non-integrated producers; some mitigate risk through recycled asphalt and long-term supply contracts.
What role do cool-roof regulations play in product demand?
Energy codes such as California’s Title 24 accelerate adoption of reflective bitumen membranes, boosting premium product volumes, especially in roof retrofits.