
Spinal Cord Stimulation Devices Market Size and Share
Market Overview
| Study Period | 2020 - 2031 |
|---|---|
| Market Size (2026) | USD 3.38 Billion |
| Market Size (2031) | USD 4.94 Billion |
| Growth Rate (2026 - 2031) | 7.92 % |
| Fastest Growing Market | Asia-Pacific |
| Largest Market | North America |
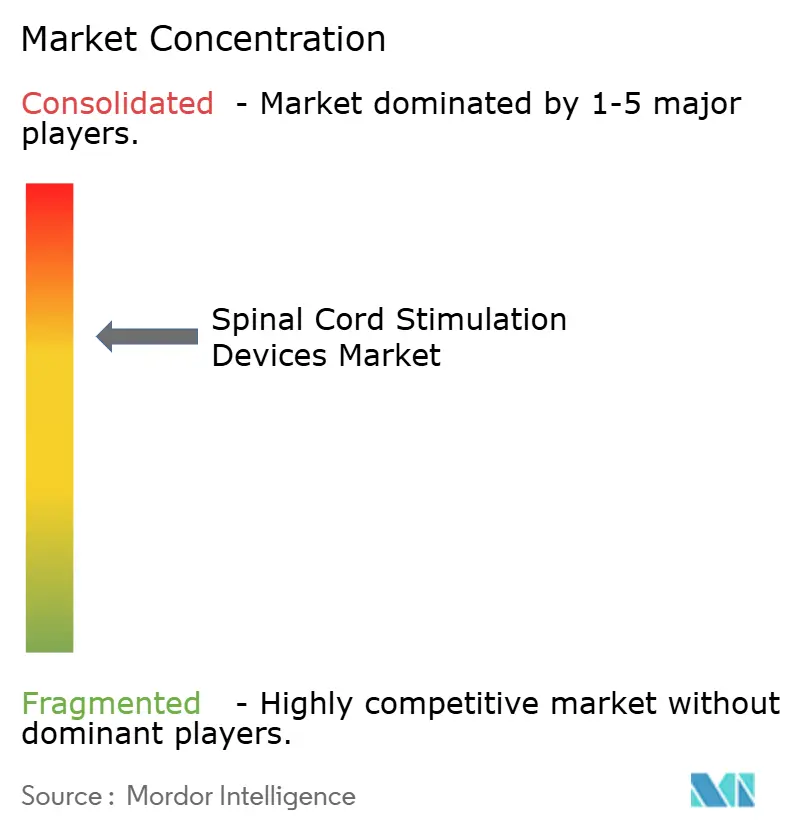
| Market Concentration | Medium |
Major Players *Disclaimer: Major Players sorted in no particular order Image © Mordor Intelligence. Reuse requires attribution under CC BY 4.0. | |
Spinal Cord Stimulation Devices Market Analysis by Mordor Intelligence
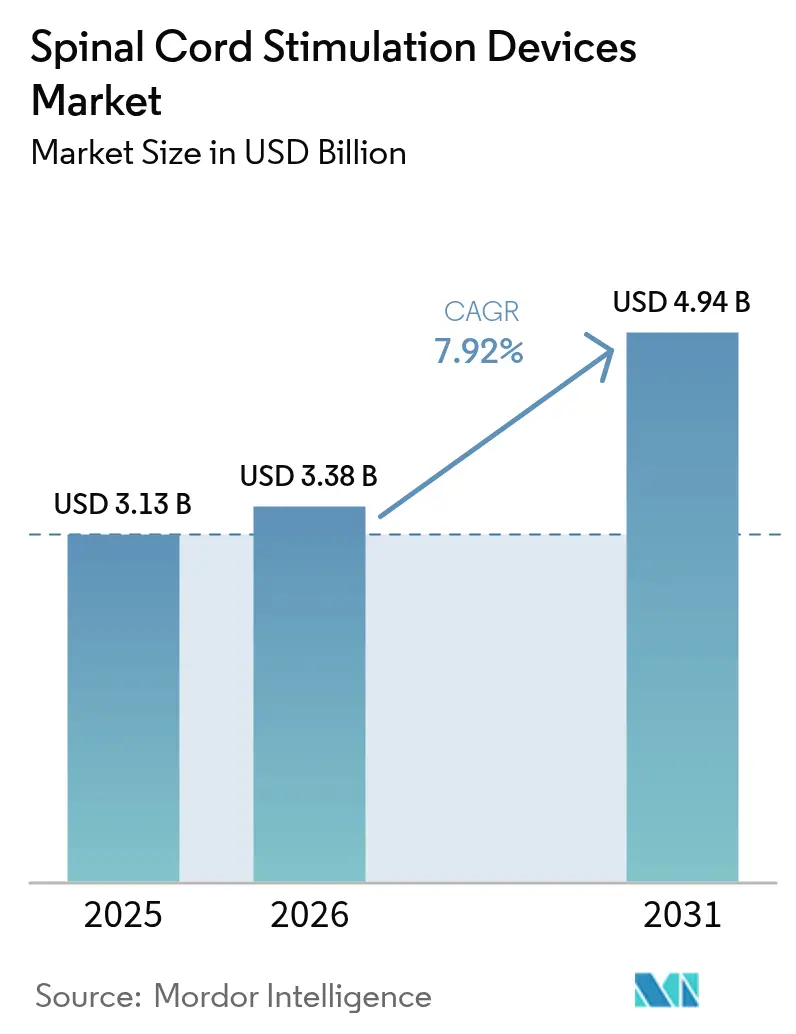
Spinal cord stimulation devices market size in 2026 is estimated at USD 3.38 billion, growing from 2025 value of USD 3.13 billion with 2031 projections showing USD 4.94 billion, growing at 7.92% CAGR over 2026-2031. Adoption accelerates as physicians transition from fixed-output implants to AI-enabled closed-loop systems that tailor therapy in real time, cutting overstimulation and reducing revision risk. Growing evidence for 10 kHz high-frequency and burst waveforms, coupled with favorable reimbursement for diabetic neuropathy and non-surgical back pain, sustains long-term demand.[1]Center for Devices and Radiological Health Staff, “Spectra WaveWriter, WaveWriter Alpha, WaveWriter Alpha Prime Spinal Cord Stimulation Systems,” U.S. Food and Drug Administration, fda.gov Hospitals remain the dominant implant setting, yet outpatient centers capture share as minimally invasive techniques shorten recovery times. Regionally, North America leads on the back of early technology uptake, while Asia-Pacific records double-digit growth as healthcare infrastructure expands and chronic pain prevalence rises.
Key Report Takeaways
- By device type, rechargeable systems held 66.20% of spinal cord stimulation devices market share in 2025, while closed-loop ECAP-controlled platforms are forecast to grow at a 12.08% CAGR through 2031.
- By waveform technology, conventional tonic stimulation retained 41.90% revenue in 2025; high-frequency 10 kHz therapy is expected to advance at a 10.52% CAGR over 2026-2031.
- By application, failed back surgery syndrome contributed 30.70% of spinal cord stimulation devices market size in 2025, whereas peripheral neuropathies are projected to expand at 11.05% CAGR to 2031.
- By end user, hospitals accounted for 55.00% of procedures in 2025, while ambulatory surgical centers are growing fastest at 10.28% CAGR to 2031.
- By implant lead type, percutaneous leads captured 62.90% share in 2025; paddle leads are set to post an 10.93% CAGR through 2031.
- By geography, North America led with 41.60% revenue share in 2025, while Asia-Pacific is on track for a 10.26% CAGR to 2031.
Note: Market size and forecast figures in this report are generated using Mordor Intelligence’s proprietary estimation framework, updated with the latest available data and insights as of 2026.
Market Trends and Insights
Drivers Impact Analysis of Spinal Cord Stimulation Devices Market*
| Driver | (~) % Impact on CAGR Forecast | Geographic Relevance | Impact Timeline |
|---|---|---|---|
| Chronic neuropathic pain prevalence | +1.8% | Global, highest in North America & Europe | Long term (≥ 4 years) |
| Rapid uptake of minimally invasive implants | +1.5% | North America & Europe, expanding to Asia-Pacific | Medium term (2-4 years) |
| Reimbursement expansions | +1.2% | North America primary, Europe secondary | Medium term (2-4 years) |
| Rising outpatient ASC implant volumes | +1.0% | North America & Europe | Short term (≤ 2 years) |
| AI-driven closed-loop algorithms | +1.3% | Global, led by developed markets | Medium term (2-4 years) |
| MRI-conditional, miniaturized long-life IPGs | +0.9% | Global | Long term (≥ 4 years) |
| Source: Mordor Intelligence | |||
Growing Prevalence of Chronic Neuropathic Pain
Chronic neuropathic pain affects a growing diabetic population and fuels sustained demand for neuromodulation that pharmaceuticals fail to control. Ten kilohertz high-frequency therapy delivered 90% pain-relief responders at 24 months versus 2% for medical management, prompting guideline shifts away from opioid reliance.[2]Erika Petersen, “Spinal Cord Stimulation Provides Pain Relief in Diabetic Neuropathy,” Cleveland Clinic Journal of Medicine, ccjm.orgRegulators now authorize spinal cord stimulation for diabetic neuropathy and non-surgical back pain, enlarging the eligible pool. As aging, obesity, and sedentary lifestyles converge, clinicians increasingly consider neuromodulation early in the care pathway. This fundamental change anchors stable unit growth and underpins the long-run expansion of the spinal cord stimulation devices market.
Rapid Adoption of Minimally-Invasive Neuromodulation
Percutaneous leads inserted through a single needle now rival paddle systems in efficacy while cutting operating-room time and infection risk. The shift supports same-day discharge, aligns with value-based purchasing, and broadens access for high-comorbidity patients. Remote programming and imaging guidance further streamline workflows, enabling ambulatory centers to capture rising case volumes. As payers reward cost-efficient care, minimally invasive protocols accelerate overall procedure growth and widen the installed base that drives future replacement demand across the spinal cord stimulation devices market.
Favorable Reimbursement Expansions
Medicare’s 2025 code revisions carved out separate payment for adaptive closed-loop stimulators, acknowledging their distinctive clinical value. Private insurers mirror these moves, embedding opioid-reduction metrics into coverage decisions. Europe follows suit as health-technology assessments show long-term cost savings versus repeat surgeries. Clearer economic signals reassure hospitals and ASCs that investments in advanced generators will be recouped, reinforcing order pipelines for leading vendors.
AI-Driven Closed-Loop Stimulation Algorithms
Evoked compound action potential sensing adjusts output up to 50 times per second, keeping patients within an optimal therapeutic window regardless of posture. In a 12-month study, 93% reported less overstimulation and 88% preferred automatic regulation. Machine-learning engines refine settings over time, delivering personalized pain control and reducing unplanned clinic visits. As early adopters publicize results, competitive pressure mounts on legacy-only portfolios, catalyzing a fresh upgrade cycle in the spinal cord stimulation devices market.
Restraints Impact Analysis of Spinal Cord Stimulation Devices Market*
| Restraint | (~) % Impact on CAGR Forecast | Geographic Relevance | Impact Timeline |
|---|---|---|---|
| Surgical revision & explant rates | -1.4% | Global, higher in developing markets | Medium term (2-4 years) |
| Capital intensity for small ASC entrants | -0.8% | North America & Europe | Short term (≤ 2 years) |
| Cyber-security and data-privacy concerns | -0.6% | Global, highest in regulated markets | Long term (≥ 4 years) |
| Lithium-ion battery supply volatility | -0.7% | Global | Medium term (2-4 years) |
| Source: Mordor Intelligence | |||
Surgical Revision & Explant Rates
Device removals reach 38% in certain cohorts, with efficacy loss driving 79% of explants and infection 12.4%. Cumulative risk climbs over the device life, inflating total cost of care by USD 35,000–70,000 per revision. High revision rates prompt cautious payer review and can delay first-line adoption. Manufacturers answer with improved anchoring, contact redundancy, and better infection-control coatings, yet durability remains a top clinician concern restraining the spinal cord stimulation devices market.
Cyber-Security & Data-Privacy Concerns
Wi-Fi- and Bluetooth-enabled stimulators expose new attack surfaces as therapy settings can be adjusted remotely. Regulators now require vulnerability assessments and over-the-air patch capabilities, lengthening development cycles. Hospitals, wary of ransomware, sometimes restrict networked implants, slowing connected device rollouts. Vendors invest in zero-trust architectures and encrypted communication, but persistent perception risks temper growth, especially for cloud-dependent closed-loop platforms.
*Our forecasts treat driver/restraint impacts as directional, not additive. The impact forecasts reflect baseline growth, mix effects, and variable interactions.
Spinal Cord Stimulation Devices Market Segment Analysis
By Device Type:
Rechargeable Systems Drive Market EvolutionRechargeable generators dominated with 66.20% share in 2025, reflecting patient demand for fewer replacement operations and the longer functional life of modern lithium-ion cells. This translated into 66.20% of the spinal cord stimulation devices market size in the same year. Vendor roadmaps now promise 15-year battery life and five annual recharges, cutting clinic visits and saving up to USD 168,833 over a lifetime relative to non-rechargeable units. Rising experience with at-home inductive charging eases concerns about usability among elderly cohorts. Non-rechargeable devices persist where cognitive or dexterity limits hamper charging compliance, yet their share is expected to erode as training tools improve.
Unit growth stays robust because each new rechargeable implant expands the future replacement market—an annuity well understood by manufacturers. Meanwhile, declining per-unit ASPs and miniaturization enable broader emerging-market access, sustaining double-digit volume growth even as price pressure intensifies. As value-based contracts spread, battery longevity becomes a critical differentiator influencing procurement decisions across health systems.




By Waveform Technology:
Closed-Loop Systems Reshape Therapeutic ParadigmsConventional tonic output still represents the single largest revenue block at 41.90% in 2025, but closed-loop ECAP-guided platforms are rising fastest at a 12.08% CAGR. High-frequency 10 kHz implants demonstrate 76.5% responder rates compared with 49.3% for low-frequency peers, widening the performance gap. Burst stimulation mimics natural firing patterns and offers paresthesia-free relief, appealing to patients sensitive to tingling.
The multi-waveform capability packaged in new generators allows physicians to shift between modes without surgical revisions, extending therapy life and boosting patient satisfaction. Vendors exploit proprietary algorithms to lock physicians into ecosystems, while payers scrutinize clinical evidence before covering premium upgrades. As machine learning personalizes waveform selection, therapy shifts from population-based protocols to individualized pain signatures—a transformation expected to redraw competitive boundaries inside the spinal cord stimulation devices market.
By Application:
Peripheral Neuropathies Emerge as Growth DriverFailed back surgery syndrome delivered 30.70% of spinal cord stimulation devices market share in 2025. Peripheral neuropathies, chiefly diabetic, are forecast to grow the fastest at 11.05% CAGR as landmark data show 72.6% pain relief in non-surgical back pain compared with 7.1% under medical management. Robust outcomes spur earlier intervention, moving neuromodulation from salvage therapy to midpoint of care algorithms.
Complex regional pain syndrome benefits from dorsal root ganglion variants that achieve 81.2% success rates, while cancer-related and fibromyalgia indications remain investigational. As disease-specific algorithms mature, clinics increasingly triage patients by electrodiagnostic profiles to match them with optimal waveforms, lifting overall responder rates and reinforcing payer confidence.
By End User:
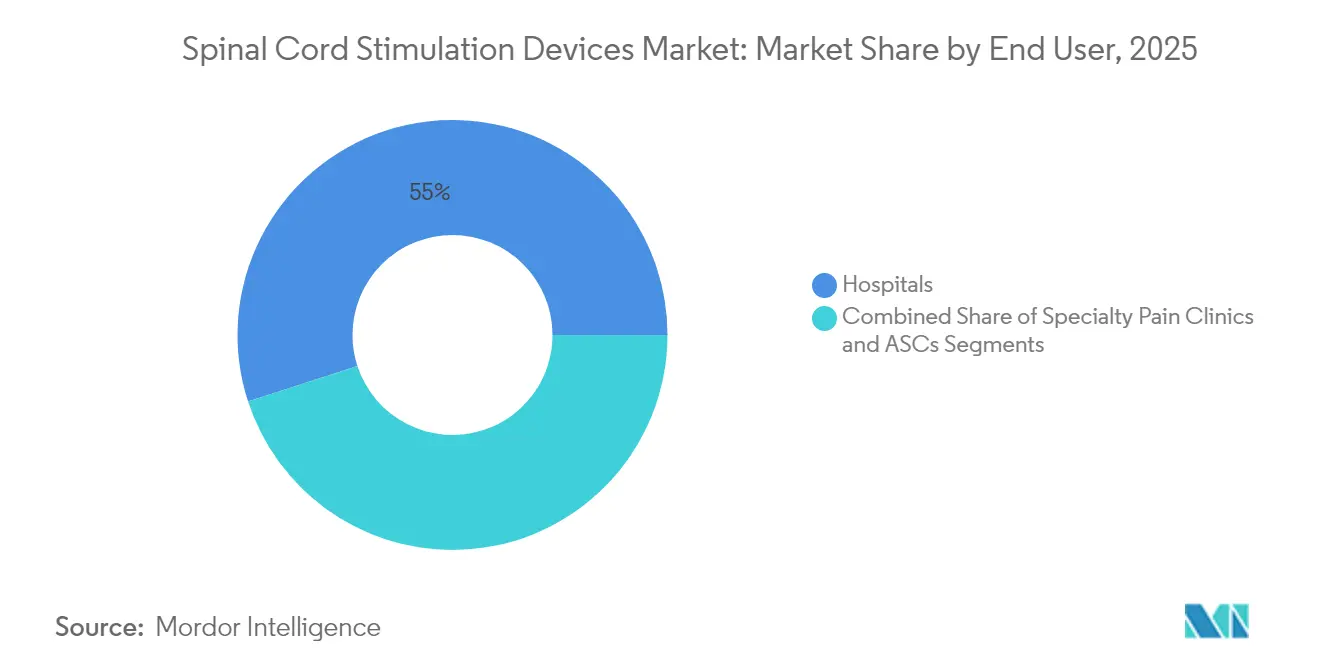
Ambulatory Centers Accelerate Outpatient AdoptionHospitals retained 55.00% of volumes in 2025, equivalent to 55.00% of the spinal cord stimulation devices market share, yet ASCs are scaling fastest at 10.28% CAGR. Payers incentivize outpatient migration due to 30% lower episode costs. Enhanced imaging and shorter anesthesia protocols make same-day discharge routine. To compete, hospitals form joint ventures with pain specialists and create hybrid OR-ASC suites that preserve inpatient referrals for complex paddle placements.
ASC expansion broadens geographic access, trimming wait times and fueling incremental demand. However, capital outlays for fluoroscopy, neuromonitoring, and inventory deter smaller centers, slowing penetration in rural corridors. Vendor-financed equipment leases and bundled pricing aim to overcome these hurdles.
By Implant Lead Type:
Paddle Leads Gain Surgical PreferencePercutaneous leads, with 62.90% share in 2025, remain default for straightforward anatomies. Paddle leads, projected to grow at 10.93% CAGR, now feature up to 32 contacts that offer wider coverage and lower migration risk, cutting long-term revision costs. Yet paddle placement demands laminotomy and advanced surgical skill, limiting uptake to high-volume centers.
Technological crossover is emerging: hybrid systems combine percutaneous trials followed by paddle permanent implants for durable benefit. Innovations such as en-bloc laminoplasty shorten operative time, while softer polymers decrease postoperative discomfort. These advances are expected to accelerate paddle adoption in complex multi-dermatomal pain states.
Geography Analysis
North America Spinal Cord Stimulation Devices Market
North America held 41.60% of global revenue in 2025, anchored by comprehensive Medicare coverage and streamlined FDA breakthrough pathways that bring closed-loop generators to market quickly. High per-capita healthcare spend supports routine use of advanced imaging and remote programming platforms, raising therapy success rates. U.S. academic centers lead pivotal trials, reinforcing local clinician confidence. Canadian uptake lags slightly due to lengthier device assessments but benefits from nationwide reimbursement uniformity once approval is granted.
Europe Spinal Cord Stimulation Devices Market
Europe presents sizable upside, though market entry is gated by heterogenous payer assessments. Germany and the United Kingdom deploy mature pain programs and now reimburse AI-enabled stimulators, while France and Italy move cautiously under tighter budget caps. The new European Medical Device Regulation demands richer clinical data, favoring incumbents with deep trial portfolios. Recent CE mark clearance of Nevro’s HFX iQ underscores regulatory openness to AI, positioning the region for accelerated closed-loop adoption.
APAC Spinal Cord Stimulation Devices Market
Asia-Pacific is the fastest-growing cluster at a 10.26% CAGR. Japan’s reimbursement for high-frequency therapy and its aging demographic propel sustained demand. China’s tier-1 hospitals invest in neuromodulation centers as diabetes prevalence climbs, though provincial tendering creates price compression. Australia’s temporary withdrawal of certain models on safety grounds opens share for firms with stronger post-market surveillance. India’s private hospital chains explore value-engineered generators to balance affordability with performance, while South Korea quickly integrates cloud monitoring in line with national digital-health policies. Collectively, these factors drive an expanding procedural footprint and steady technology diffusion across the region.

Regulatory Landscape
Spinal cord stimulation (SCS) systems are regulated as active implantable neuromodulation devices, and market access is shaped by distinct pathways in the United States and Europe. In the United States, SCS products generally proceed through FDA CDRH via either 510(k) for specific configurations (commonly associated with Product Code GZB) or the PMA pathway for higher-risk systems and claims. Recent activity includes FDA 510(k) clearance for the Nalu Neurostimulation System (K233801) in August 2024 and an FDA PMA supplement approval for Abbott's Proclaim SCS implantable pulse generator (P010032/S227) in January 2025. FDA expectations also emphasize documented performance and safety evidence for spinal system submissions, and connected-device cybersecurity requirements for remote programming and updates can extend development and review cycles.
In Europe, the Medical Device Regulation (MDR) transition continues to act as a gating factor for implantable neurostimulators. The transition raises clinical evidence and post-market surveillance demands and increases reliance on Notified Body capacity. The rollout is staggered, with a May 2026 cutoff highlighted for Class III custom-made implantable devices under extended timelines, while other implantable Class III and Class IIb devices move to later deadlines. Across regions, manufacturers commonly align design verification and risk management to recognized standards for active implantable neurostimulators, including ISO 14708-3, to support approvals and change-control submissions.
Value Chain Analysis
The spinal cord stimulation device value chain begins with specialized components such as implantable pulse generators (electronics, batteries, hermetic feedthroughs), leads (percutaneous and paddle), programmers, chargers, and software used for programming and remote monitoring. Upstream dependencies center on medical-grade lithium-ion cells and select electronic components (for example, capacitors and microelectronics), while final device manufacturing and micro-assembly require high-precision cleanroom processes. Production is concentrated in established medical-device hubs including the United States, Ireland, and Puerto Rico. Because lithium-ion batteries are treated as hazardous materials in transport, and implants and accessories require strict sterility management, logistics and quality systems become central cost and timing drivers, particularly for global shipments and field inventory replenishment.
Downstream, distribution and commercialization rely heavily on direct sales models that support physician training, operating-room and ASC case coverage, and consignment inventory approaches at hospitals and ambulatory surgical centers. Reimbursement and utilization controls also shape demand planning. In the United States, Medicare coverage is frequently operationalized through Local Coverage Determinations that define patient selection, trial requirements, and documentation prior to permanent implant, which can influence procedural throughput for device vendors. Post-market surveillance, software maintenance for connected platforms, and revision and explant management add service layers that extend manufacturer involvement across longer lifecycle windows than implant-only categories.
Competitive Landscape
Four multinationals—Medtronic, Abbott, Boston Scientific, and Nevro—control roughly 75% of worldwide sales, reflecting moderate concentration. Medtronic leads in closed-loop sensing, Abbott excels in burst and DRG platforms, Boston Scientific leverages multi-waveform versatility, and Nevro commands high-frequency expertise. Globus Medical’s USD 250 million purchase of Nevro in February 2025 illustrates strategic consolidation aimed at combining surgical spine portfolios with neuromodulation franchises.
R&D race centers on artificial intelligence, energy density, and MR-conditional labeling. Patent walls form around waveform algorithms and miniaturized pulse generators. Emerging entrants pursue pediatrics, cancer pain, and peripheral nerve interfaces, pushing incumbents to defend share through outcome-based contracts and physician education. Supply-chain resilience has become a differentiator as lithium-ion disruptions and semiconductor shortages persist. In response, leading vendors dual-source key components and onshore assembly to safeguard deliveries.
Pricing pressure intensifies as payers benchmark reimbursement to documented opioid reduction and functional-status gains. Vendors therefore pair implants with digital analytics portals that quantify activity levels and pain scores, enabling real-world-evidence dossiers. Those able to link device performance with measurable cost offsets gain preferential formulary status, reinforcing first-mover advantage while raising the bar for followers in the spinal cord stimulation devices market.
Spinal Cord Stimulation Devices Industry Leaders
Boston Scientific Corporation
Medtronic
NEVRO CORP.
Saluda Medical Pty Ltd.
Abbott
- *Disclaimer: Major Players sorted in no particular order
Spinal Cord Stimulation Devices Market Companies Covered in this Report
- Abbott Laboratories
- Medtronic
- Boston Scientific
- Nevro
- Saluda Medical Pty Ltd
- Beijing PINS Medical Co., Ltd
- Nalu Medical
- Stimwave Technologies
- Synapse Biomedical
- Gimer Medical
- Cirtec Medical
- Micro-Transponder Inc.
- Mainstay Medical
- Integer Holdings Corp.
- BlueWind Medical
- Syntach AB
- Aleva Neurotherapeutics
- Osaka Medical Devices (Miracle)

Market Opportunities and Future Outlook
Technology-led differentiation is creating whitespace around adaptive therapy delivery, imaging access, and procedural expansion into new patient pools. FDA approval of Medtronic's Inceptiv closed-loop rechargeable SCS system (April 2024) provides a concrete reference point for ECAP-based automatic adjustments, and payer and provider attention is also shifting toward platforms that reduce follow-up burden and document outcomes more consistently. MRI access is a practical demand driver as well. In January 2026, Abbott reported FDA approval for prone MRI scans across its chronic pain portfolio, including Proclaim SCS, Eterna SCS, and Proclaim DRG, expanding imaging flexibility for implanted patients and strengthening MRI-conditional labeling as a procurement differentiator for hospitals and ASCs.
Indication and modality expansion is also opening adjacent opportunity areas beyond traditional chronic back and leg pain populations. Non-invasive and transcutaneous stimulation systems are progressing through regulatory milestones, illustrated by ANEUVO receiving U.S. FDA clearance for ExaStim in April 2026 for patients with incomplete spinal cord injury, which points to ongoing investment in neuromodulation approaches that do not require implant surgery. On the implant side, procedural workflow compatibility is favoring products that align with surgeon preferences and OR and ASC throughput. In June 2026, Saluda Medical received U.S. FDA approval for its CAP24 surgical paddle lead designed for closed-loop neuromodulation, supporting strategies to deepen penetration with neurosurgeons and orthopedic surgeons and to broaden lead portfolios that can be standardized across higher-acuity implant centers.
Recent Industry Developments in Spinal Cord Stimulation Devices Market
- January 2026: Medtronic highlighted two-year closed-loop SCS study results and independent real-world evidence for Inceptiv at the North American Neuromodulation Society (NANS) 2026 meeting. The update reinforced the shift toward sensing-enabled therapy that automatically adjusts stimulation and supports provider confidence in long-term performance. This also strengthened competitive positioning in hospital and ASC accounts that prioritize reduced overstimulation and fewer programming visits.
- April 2025: Globus Medical completed its acquisition of Nevro Corp., bringing the HFX high-frequency (10 kHz) platform into a larger musculoskeletal and spine-surgery portfolio. The combination tightened alignment between spine procedure channels and neuromodulation offerings, influencing cross-selling and contracting dynamics. Integration also signaled continued consolidation among leading SCS suppliers.
- November 2024: Nevro received CE mark for HFX iQ, combining 10 kHz therapy with cloud-based AI insights to personalize pain algorithms. The clearance supported commercialization of data-enabled therapy management within Europe under MDR requirements. It also raised the bar for software, connectivity, and real-world evidence capabilities among competing SCS ecosystems.


Spinal Cord Stimulation Devices Market Report Scope and Research Methodology
Market Definition and Coverage
For this study, the spinal cord stimulation devices market covers revenue earned from implantable SCS systems used to manage chronic pain by sending electrical signals to the spinal cord, including the implanted pulse generator and leads used in therapy delivery.
Scope exclusions: External pain therapy products that are not spinal cord stimulation implants (such as general analgesic devices and non-SCS neuromodulation products) are not counted in this market.
Segments Covered in This Report
- By Device Type
- Rechargeable
- Non-Rechargeable
- By Waveform Technology
- Conventional (Tonic)
- Burst
- High-Frequency (10 kHz & above)
- Closed-Loop / ECAP-Controlled
- Other Novel Waveforms
- By Application
- Failed Back Surgery Syndrome
- Complex Regional Pain Syndrome
- Degenerative Disk Disease
- Peripheral Neuropathies
- Others
- By End User
- Hospitals
- Ambulatory Surgical Centers
- Specialty Pain Clinics
- By Implant Lead Type
- Percutaneous Leads
- Paddle Leads
- By Geography
- North America
- United States
- Canada
- Mexico
- Europe
- Germany
- United Kingdom
- France
- Italy
- Spain
- Rest of Europe
- Asia-Pacific
- China
- Japan
- India
- Australia
- South Korea
- Rest of Asia-Pacific
- Middle East and Africa
- GCC
- South Africa
- Rest of Middle East and Africa
- South America
- Brazil
- Argentina
- Rest of South America
- North America
Data Sources, Market Sizing, and Validation
Desk Research
Desk research was used to set the market boundaries, define the demand pool, and build an initial set of assumptions for volumes and pricing. We referred to non-paywalled sources such as the US FDA device approvals and safety databases, the US Centers for Medicare and Medicaid Services (CMS) reimbursement rules, the OECD health statistics series, the World Bank health spending indicators, and peer-reviewed clinical journals that publish SCS utilization and outcomes trends.
On the supply side, we also reviewed public company filings, investor decks, and reputable press coverage to understand product launches, geographic focus, and therapy adoption patterns. Where needed, paid database subscriptions were used for company financials and intelligence, and for patent database checks to track innovation intensity and likely product refresh cycles. The desk sources named here are illustrative only, and additional public and paid sources were used for data collection, validation, and clarification.
Primary Interviews and Surveys
Primary work focused on validating sizing drivers that are hard to read directly from public data, such as typical selling price bands by system type, the split between rechargeable and non-rechargeable implants, and the pace of adoption across hospital and outpatient settings. We spoke with a mix of device-side and care-side experts, including commercial leaders, product and clinical specialists, pain physicians, and procurement or program managers. Coverage was balanced across major regions, so the assumptions were stress-tested against local reimbursement and care pathways.
Distribution of primary research fieldwork respondents
| Company type | Respondent position | Region |
|---|---|---|
| Top tier: 26% | CXOs: 15% | APAC: 48% |
| Mid tier: 58% | Functional/Unit leaders: 42% | EMEA: 32% |
| Smaller Players: 16% | Managers: 43% | Americas: 20% |
Market-Sizing & Forecasting
The core model is built using a top-down approach where procedure and treated-patient signals are translated into device demand, and then converted into revenue using region-appropriate pricing. Once this demand pool is established, we corroborate it with selective bottom-up checks, including rolling up a sample of supplier revenues by region and using channel checks to validate average selling price (ASP) movement and mix shifts.
Key inputs used in the model include the size of the chronic pain population eligible for SCS, implant and trial procedure volumes, payer coverage and reimbursement stability, the mix between rechargeable and non-rechargeable systems, and replacement or revision rates that influence ongoing demand. Because pricing varies by care setting and country, ASPs were modeled with a mix-led view, and gaps in reported pricing were handled using bounded ranges that were confirmed during interviews.
For forecasting, we used scenario analysis supported by time series smoothing to reflect how changes in reimbursement, outpatient shift, and technology adoption (for example, newer waveform preferences) can move volumes and ASPs. Assumptions were reviewed with experts so the forecast remains practical and anchored to what providers and device teams expect over the next few years.
Data Validation & Update Cycle
Model outputs were checked against independent signals such as implied procedure counts, reported company growth commentary, and regional healthcare spending direction, and then the largest variances were investigated. When a result appeared inconsistent with clinical adoption realities, we revisited driver inputs and, where required, re-contacted sources to confirm whether the difference came from mix, pricing, or timing.
Before sign-off, the work goes through multi-step analyst review so assumptions, math, and scope boundaries are applied consistently across regions and years. Reports are refreshed annually, and interim updates are made when material events occur, such as major reimbursement changes or meaningful product approvals. Right before delivery, we run a final market pass so clients receive the latest updated view.
Mordor Intelligence's Spinal Cord Stimulation Devices Market Size Compared With Other Published Estimates
Published market values for spinal cord stimulation devices can differ because the scope line is drawn in different places, and because procedure assumptions and ASP build-ups are not always handled the same way. Timing also matters since some estimates use older base years, and others apply currency conversion and inflation in ways that can push values up or down.
The gaps are usually driven by whether adjacent neuromodulation categories are blended into SCS, how trial-to-implant conversion is treated, and whether reimbursement constraints are modeled as a near-term limiter or ignored in the base case. Differences also come from how quickly ASPs are assumed to decline (or hold) as rechargeable systems gain share, and from how often assumptions are refreshed as new indications and approvals expand the addressable pool.
Benchmark comparison
| Source | Market Size | Gaps in Research Methodology |
|---|---|---|
| Mordor Intelligence | USD 3.38 B (2026) | |
| Industry Publisher A | USD 2.40 B (2024) | Uses an earlier base year and appears to apply a narrower revenue capture, which can happen when only core implant systems are counted and upgrades, replacements, or setting mix effects are not fully reflected. |
| Trade-led Estimate B | USD 2.50 B (2024) | Looks aligned to product sales commentary and may understate the market when trial-to-implant conversion, revision demand, and ASP differences between rechargeable and non-rechargeable systems are simplified. |
The table highlights a timing and scope spread, and in Mordor Intelligence's model the market is expressed for 2026 with revenue aligned to implantable SCS systems and validated using procedure-linked demand signals plus ASP and mix checks. When other estimates lean on older-year snapshots or simplify conversion and mix, their totals can sit lower even if the long-term growth direction is similar.


Key Questions Answered in the Report
What is the current size of the spinal cord stimulation devices market?
The spinal cord stimulation devices market is valued at USD 3.38 billion in 2026 and is forecast to reach USD 4.94 billion by 2031.
Which device type leads global revenue?
Rechargeable implants led with 66.20% market share in 2025, reflecting patient preference for long battery life and fewer replacement surgeries.
How fast is the Asia-Pacific region growing?
Asia-Pacific is projected to expand at a 10.26% CAGR between 2026 and 2031, the fastest among all regions.
What technology trend is reshaping therapy delivery?
AI-driven closed-loop stimulation that adjusts output using real-time ECAP feedback is redefining pain management and driving a 12.08% CAGR in that segment.
Why are ambulatory surgical centers gaining share?
Minimally invasive percutaneous lead placement and payer incentives for lower-cost outpatient care are propelling ASC procedure volumes at a 10.28% CAGR.
Which clinical indication is expected to grow the fastest?
Peripheral neuropathies, particularly diabetic neuropathy, are forecast to grow at 11.05% CAGR due to expanding clinical evidence and newly approved reimbursements.
Page last updated on:


 Your data is secure and never sold or shared.


