Spark Plasma Sintering Market Size and Share
Market Overview
| Study Period | 2020 - 2031 |
|---|---|
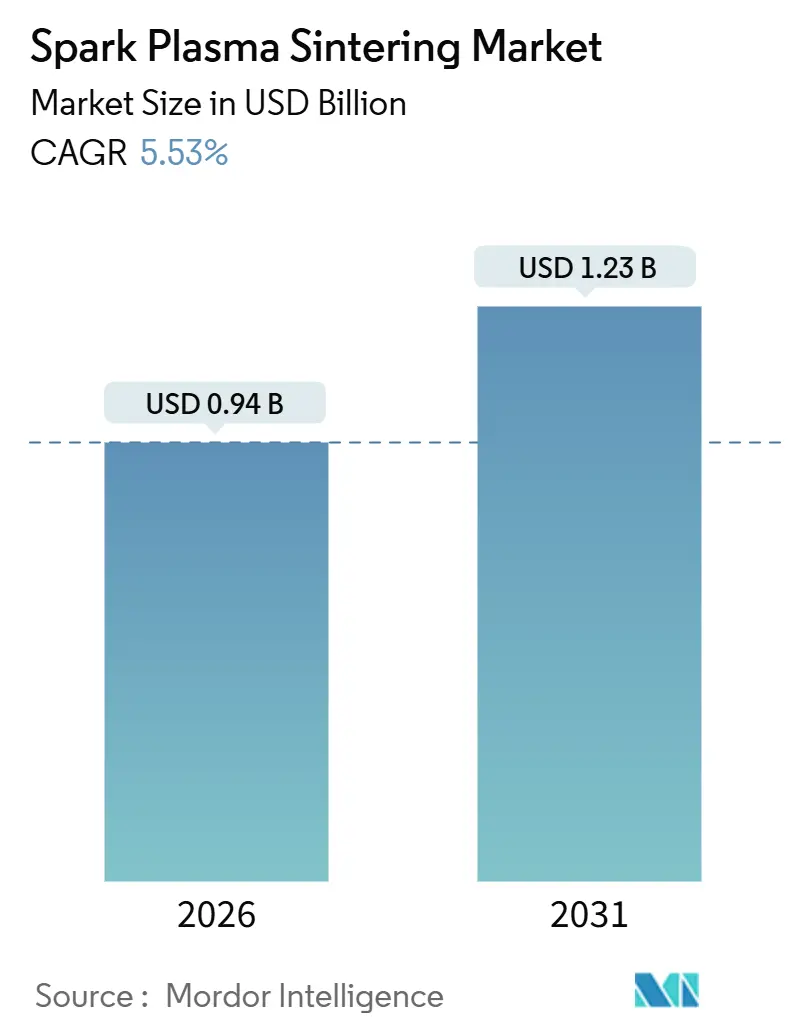
| Market Size (2026) | USD 0.94 Billion |
| Market Size (2031) | USD 1.23 Billion |
| Growth Rate (2026 - 2031) | 5.53% CAGR |
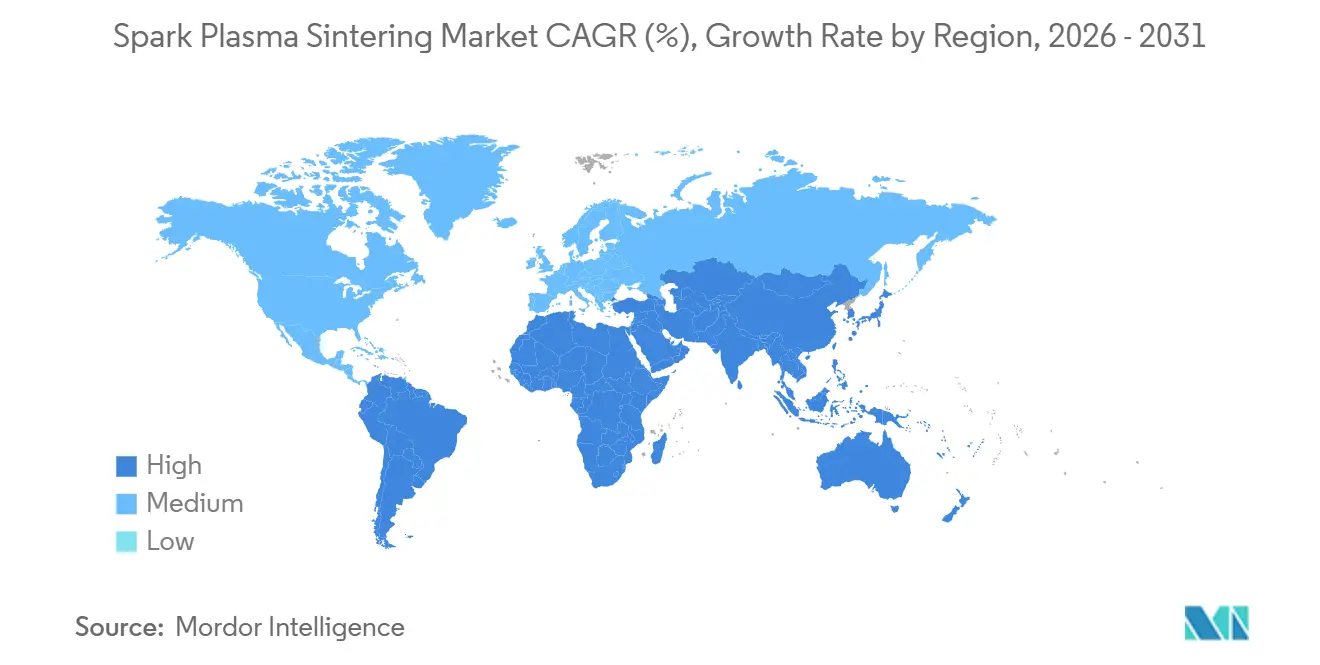
| Fastest Growing Market | Asia Pacific |
| Largest Market | Asia Pacific |
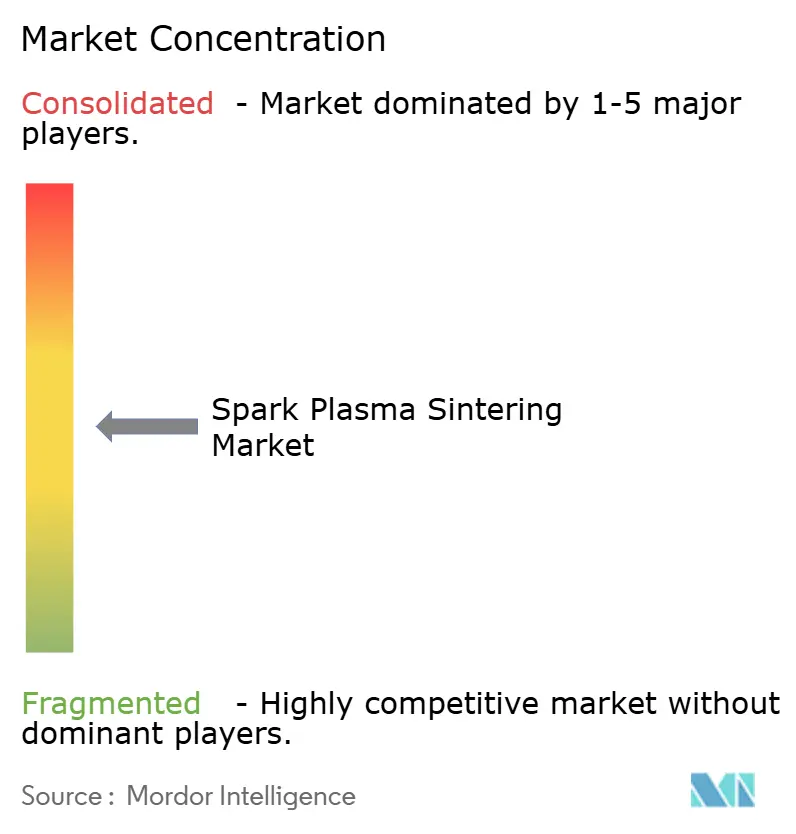
| Market Concentration | Medium |
Major Players *Disclaimer: Major Players sorted in no particular order Image © Mordor Intelligence. Reuse requires attribution under CC BY 4.0. | |
Spark Plasma Sintering Market Analysis by Mordor Intelligence
The spark plasma sintering market stands at USD 0.94 billion in 2026 and is forecast to reach USD 1.23 billion by 2031, reflecting a 5.53% CAGR. This trajectory signals growing acceptance of field-assisted densification across solid-state batteries, hypersonic vehicle components, and rapid-turnaround prototyping. Automotive and electronics OEMs are consolidating ceramic electrode layers to meet 800-volt power demands, while aerospace primes specify ultra-high-temperature ceramic parts that withstand re-entry conditions above 2,000 °C. Equipment buyers favor presses in the 100-500 ton bracket for balanced throughput versus capital outlay, yet recurring service contracts and die refurbishment are expanding faster than hardware sales. Functionally-graded materials, produced in a single run without post-processing, unlock added value in aerospace heat shields and orthopedic implants.
Key Report Takeaways
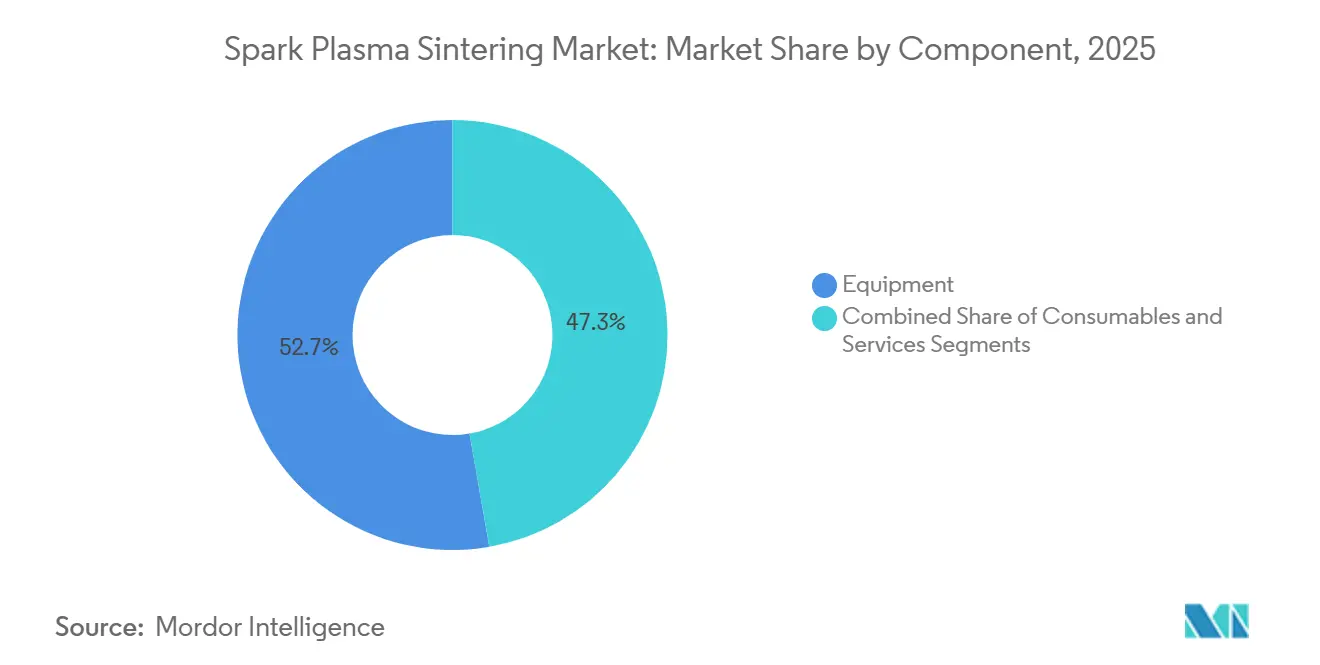
- By component, equipment accounted for 52.73% revenue in 2025, but services are expanding at a 6.67% CAGR through 2031.
- By press capacity, the 100-500 ton bracket held 54.32% of the spark plasma sintering market share in 2025, whereas presses above 500 tons are projected to advance at 6.84% CAGR to 2031.
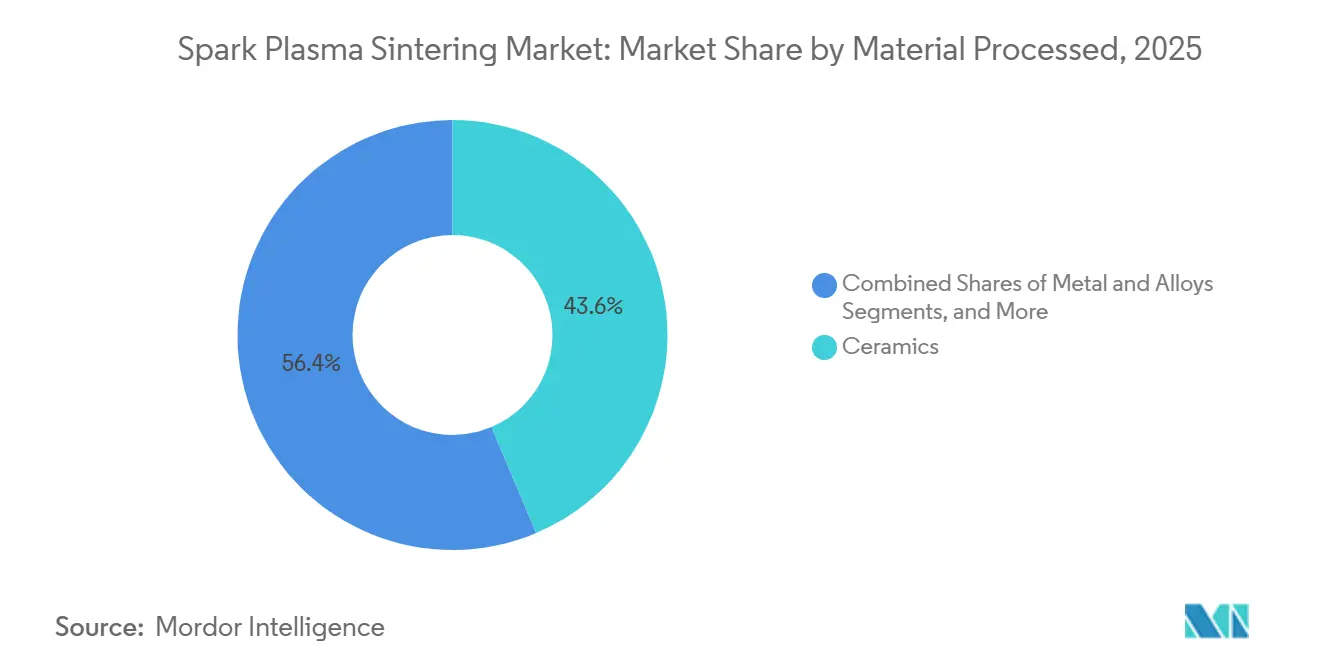
- By material processed, ceramics captured 43.63% of the spark plasma sintering market size in 2025 and face margin pressure from commoditized sintering parameters.
- By end-use industry, automotive recorded the fastest growth at 5.90% CAGR through 2031, outpacing the 29.73% revenue share that aerospace and defense held in 2025.
- By geography, Asia-Pacific led with 38.94% revenue share in 2025 and is forecast to grow at 6.48% CAGR to 2031.
Note: Market size and forecast figures in this report are generated using Mordor Intelligence’s proprietary estimation framework, updated with the latest available data and insights as of January 2026.
Global Spark Plasma Sintering Market Trends and Insights
Drivers Impact Analysis*
| Driver | (~) % Impact on CAGR Forecast | Geographic Relevance | Impact Timeline |
|---|---|---|---|
| Accelerating Demand for Advanced Ceramics in EVs and Battery Applications | +1.2% | Asia-Pacific, Europe, North America | Medium term (2-4 years) |
| Consolidation of Solid-State Battery Electrodes | +1.0% | Asia-Pacific, North America | Medium term (2-4 years) |
| Mainstream Adoption in University and National Research Labs | +0.9% | North America, Europe, Asia-Pacific | Medium term (2-4 years) |
| Rapid Turnaround Prototype Production for Metals and Alloys | +0.8% | Global | Short term (≤ 2 years) |
| Energy-Efficient Processing Compared with Conventional Hot-Pressing | +0.6% | Global | Long term (≥ 4 years) |
| Use in Hypersonic-Grade Ultra-High-Temperature Ceramics | +0.7% | North America, Europe, Asia-Pacific | Long term (≥ 4 years) |
| Source: Mordor Intelligence | |||
Accelerating Demand for Advanced Ceramics in EVs and Battery Applications
Electric-vehicle platforms now operate at 800 volts, raising thermal loads on silicon-carbide power modules and ceramic substrates. Spark plasma sintering achieves near-theoretical density in silicon carbide at temperatures 200-300 °C below conventional routes, preserving grain boundaries that improve thermal conductivity.[1]MDPI, “Spark Plasma Sintering of LCO/LLZ Composites,” mdpi.com Automakers prototype carbon-fiber-reinforced silicon-carbide brake discs that slash particulate emissions by 78% during dynamometer testing.[2]Curtiss-Wright Surface Technologies, “PEO-Coated Aluminum Brake Discs Reduce Harmful Brake Dust Emissions by Up to 78%,” curtisswright.com Gigafactories across China and South Korea co-densify cathode and electrolyte layers in single cycles, cutting process steps and improving adhesion. Lower sintering temperatures also safeguard lithium stoichiometry in solid-state batteries, directly boosting ionic conductivity. Consequently, automotive suppliers view spark plasma sintering as a cornerstone for next-generation electrified powertrains.
Consolidation of Solid-State Battery Electrodes
Solid-state lithium cells demand intimate contact between cathode particles and ceramic electrolytes to reduce interfacial resistance. Spark plasma sintering forms bilayer structures with resistances below 10 Ω·cm² at 700 °C, outperforming samples processed at 900 °C in conventional furnaces. Corning’s 2024 patent on continuous roll-to-roll field-assisted sintering indicates a route from batch to high-throughput manufacturing. Japanese and Korean battery developers are now piloting these lines for moisture-sensitive sulfide electrolytes, as rapid cycling limits exposure time. With solid-state packs expected to enter premium EVs before 2028, electrode consolidation is poised to reinforce demand for high-capacity presses.
Mainstream Adoption in University and National Research Labs
National Science Foundation programs explicitly fund spark plasma sintering equipment, directing federal dollars to institutions such as the University of Alabama at Birmingham and the University of Arizona. Shared-user hubs like PARADIM at Cornell University provide open access, broadening hands-on training for graduate students. As researchers publish sintering maps for emerging compositions, industrial risk falls, and commercial uptake accelerates. Service life extensions, real-time process monitoring, and die-coating innovations developed in academic settings migrate quickly to industry, shortening the path from laboratory curiosity to production tool.
Rapid Turn-Around Prototype Production for Metals and Alloys
Achieving full density in refractory alloys usually requires hours of dwell time, yet spark plasma sintering can densify tungsten or titanium aluminides in under 10 minutes. Aerospace firms iterate turbine-blade designs within days, rather than weeks, streamlining design-build-test loops. Desktop Metal demonstrated 99.2% dense 316L stainless parts using a hybrid binder-jet and field-assisted workflow, confirming that rapid cycles need not sacrifice mechanical integrity. Contract manufacturers extend similar 48-hour services to medical-device and tooling clients, highlighting the technology’s role in compressed development timelines.
Restraints Impact Analysis*
| Restraint | (~) % Impact on CAGR Forecast | Geographic Relevance | Impact Timeline |
|---|---|---|---|
| High Capital Cost and Limited Installed Base | -0.9% | Global | Short term (≤ 2 years) |
| Lack of International Process Standards | -0.6% | Global | Long term (≥ 4 years) |
| Restricted Part Size due to Die and Press Limitations | -0.5% | Global | Medium term (2-4 years) |
| Graphite Die Contamination Concerns | -0.4% | Global | Medium term (2-4 years) |
| Source: Mordor Intelligence | |||
High Capital Cost and Limited Installed Base
Benchtop 100-ton systems start near USD 200,000, while fully automated 500-ton lines exceed USD 2 million. Such figures deter small and medium enterprises, especially in emerging markets where duties and exchange-rate volatility raise effective prices by 20-30%. Leasing models common in additive manufacturing have not yet penetrated this segment, leaving buyers to shoulder full ownership risk. Limited contractor availability forces many firms to purchase equipment rather than outsource early pilot runs. Consequently, capital intensity remains the single largest brake on market acceleration despite clear technical advantages.
Lack of International Process Standards
ISO and ASTM have yet to codify field-assisted sintering parameters for ceramics and metals. Each aerospace or medical supplier must therefore generate proprietary heat-pressure-cool profiles, duplicating costs and extending qualification timelines. AS9100 audits require traceability for every batch, and without harmonized norms, interoperability across supply chains stalls. ASTM Committee F42 has multiple work items in progress but publication is unlikely before 2027. Until consensus standards emerge, certification overhead will continue to slow broader industrial adoption.
*Our forecasts treat driver/restraint impacts as directional, not additive. The impact forecasts reflect baseline growth, mix effects, and variable interactions.
Segment Analysis
By Component: Services Gain Traction as Installed Base Matures
Equipment accounted for 52.73% of 2025 revenue, yet the services segment is growing at 6.67% annually as owners focus on uptime, calibration, and software upgrades. Multi-year maintenance contracts bundled with new presses ensure die-refurbishment schedules and power-supply diagnostics are met, reducing unplanned downtime. University labs commonly secure such agreements through NSF grants, demonstrating predictable lifetime costs. As presses age, retrofit packages that add closed-loop pressure control and data logging lengthen asset life, driving secondary sales. Consumables such as graphite dies and foils remain recurring needs, although average die life now reaches 150 cycles due to improved coatings. The spark plasma sintering market therefore shows a steady pivot from capital purchases toward annuity-style service revenue.
A second dynamic is the rise of service bureaus. Cal Nano and similar contractors run high-utilization presses and offer pay-per-part pricing. This model lowers the entry threshold for specialty alloy producers and medical-device startups, fueling a virtuous cycle of demand. Over the forecast period, recurring services are expected to overtake new hardware as the primary contributor to profit pools, underscoring the evolution of the spark plasma sintering market into a lifecycle-oriented ecosystem.


By Press Capacity: Large Presses Address Aerospace and Battery Scale-Up
Systems rated 100-500 tons generated 54.32% of 2025 sales because they balance component size, cycle time, and floor-space requirements. Institutions such as the Henry Royce Institute operate 250-ton presses that handle 200-mm ceramic discs, meeting most research and pilot needs. Sub-100-ton units cater to universities and tooling shops but rarely support production volumes. Demand momentum is shifting toward presses above 500 tons, which are projected to post a 6.84% CAGR through 2031. These machines form battery electrode stacks measuring 300 mm on a side and aerospace nose-cone blanks 500 mm in diameter. Capital spending scales non-linearly; ownership costs can triple when moving from 250-ton to 500-ton capacity, so adoption concentrates among firms with high-value-added parts.
Higher capacity also mitigates post-machining, as thicker green compacts reach full density without warping. However, power supplies must deliver hundreds of kiloamps, increasing infrastructure complexity. Manufacturers that supply integrated tooling, transformers, and cooling loops hold an advantage. Overall, capacity choice reflects trade-offs among part geometry, capital budget, and future scalability, with the spark plasma sintering market showing clear segmentation along these lines.
By Material Processed: Functionally Graded Materials Unlock Niche Applications
Ceramics accounted for 43.63% of the throughput in 2025, driven by alumina cutting tools and zirconia implants. Yet margins compress as process recipes spread and customers negotiate lower prices. Metals and alloys occupy a smaller slice but attract aerospace and defense users who value rapid densification of tungsten heavy alloys and titanium aluminides. Composites, including carbon-fiber-reinforced ceramics, are emerging as thermal-shock-resistant materials for turbine shrouds. The fastest growth lies in functionally graded materials, which are expanding at a 6.43% CAGR through 2031 as designers tailor porosity or composition within a single run. The spark plasma sintering market size for graded parts remains modest today, yet it offers engineers latitude unavailable with hot pressing.
Gradient scaffolds for orthopedic implants exemplify commercial appeal, dense cores deliver load-bearing, while porous surfaces foster bone ingrowth. Aerospace developers craft nose-cone tiles that dissipate heat via internal thermal-conductivity gradients. Successful demonstrations by university consortia have prompted joint ventures between press OEMs and ceramic houses to commercialize graded architectures. Over the forecast horizon, uptake in this niche is expected to outpace bulk ceramics, adding diversity to the spark plasma sintering market.
By End-Use Industry: Automotive Electrification Drives Fastest Growth
Aerospace and defense retained the largest slice at 29.73% of 2025 sales, buoyed by investments in hypersonic flight and turbine prototyping. NASA and Oak Ridge research demonstrated flexural strengths exceeding 600 MPa in zirconium-boride composites, reinforcing demand for ultra-high-temperature parts. Automotive registers the quickest climb, advancing at 5.90% CAGR. Premium EVs substitute iron brake rotors with ceramic discs that cut dust emissions and curb unsprung mass. Inverters move to silicon-carbide substrates fabricated by spark plasma sintering, aligning with 800-volt architectures.
Electronics and semiconductor producers adopt the process for high-density molybdenum sputter targets, improving film uniformity in display gloss layers. Energy storage firms consolidate thermoelectric or battery electrodes, while medical and dental suppliers pursue zirconia implants once carbon contamination hurdles are cleared. Research institutes remain a stable revenue source as funding bodies prioritize shared fabrication assets. Taken together, these segments underline how the spark plasma sintering market draws strength from a diversified end-user mix, with automotive electrification providing the sharpest upside.
Geography Analysis
Asia-Pacific commanded 38.94% revenue in 2025 and is forecast to grow at 6.48% CAGR through 2031. China deploys spark plasma sintering lines inside solid-state battery gigafactories and sources homegrown presses that cost 20-30% less than European models. Japan leverages decades-old ceramics expertise to prototype brake discs, cutting tools, and silicon-carbide substrates, while South Korea densifies sputter targets for OLED panels. Regional growth also benefits from government incentives that subsidize advanced manufacturing and from dense electronics supply chains that require high-performance ceramics.
North America held roughly 30% of 2025 revenue. U.S. aerospace primes and defense agencies fund ultra-high-temperature ceramic work for hypersonic programs, and NSF grants channel equipment to universities.[3]National Science Foundation, “Materials Innovation Platforms,” nsf.gov Medical-device makers seek FDA clearance for ceramic implants, using local contract manufacturers for pilot runs. Canada and Mexico trail but offer growth pockets tied to aerospace clusters and automotive suppliers. Adoption intensity in the United States is reinforced by service bureaus that mitigate capital barriers for startups.
Europe accounted for about 25% of revenue in 2025. The continent’s Clean Sky and Horizon programs co-finance equipment at institutes like the Henry Royce Institute and the University of Sheffield. Germany’s Fraunhofer network optimizes sputter-target pathways, while France and Italy pursue turbine shrouds and thermal-barrier coatings under carbon-pricing pressure. Smaller economies, Sweden and Belgium, publish foundational studies that steer process optimization. Although the Middle East and Africa and South America together represent less than 10% of sales, defense procurement in Israel and aerospace ambitions in Brazil signal incremental opportunities. Collectively, regional patterns mirror industrial priorities, with Asia-Pacific’s battery supply chain and North America’s defense programs anchoring global demand for the spark plasma sintering market.

Regulatory Landscape
Spark plasma sintering (SPS/FAST) equipment deployments are shaped more by safety, conformity assessment, and permitting frameworks for high-power electrical and vacuum or pressurized-gas systems than by SPS-specific statutes. In the European Union, the March 2026 European Council documentation on the proposed Industrial Accelerator Act (COM(2026) 100) points to an industrial-policy push to speed permits for strategic manufacturing projects via designated acceleration areas, which is relevant to new SPS and advanced-ceramics lines that require facility modifications, electrical upgrades, and controlled-atmosphere infrastructure.
In the United States, SPS purchases and installations for federally funded programs sit inside procurement and site-compliance regimes. Examples visible in public records include SPS-related work referenced in federal contracting channels, including Idaho National Laboratory activities using electric-current-enhanced joining approaches, and DOE Idaho site documentation tied to installing commercial SPS equipment, which raises attention on documented interlocks, atmosphere controls, and facility approvals. Cross-border movement of SPS systems is also influenced by customs classification and research-use import provisions, with U.S. Customs and Border Protection tariff rulings and Federal Register notices on duty-free entry for scientific instruments serving as practical compliance anchors for universities and national labs importing systems.
Value Chain Analysis
The value chain begins with upstream materials and sub-systems: high-purity graphite for dies, punches, and foils; high-current power electronics for pulsed-DC generation; vacuum hardware and controlled-atmosphere gas handling; sensors and pyrometry software for data logging; and, in many cases, customer-supplied powders (ceramics, metal alloys, composites). SPS/FAST OEMs integrate presses, power supplies, vacuum chambers, cooling loops, and controls, then deliver installation, training, qualification support, and multi-year maintenance, which supports downstream demand for service, calibration, and tooling refurbishment as installed bases mature.
Downstream, end users include aerospace and defense, automotive electrification supply chains, electronics and semiconductor materials producers, energy-storage developers, and research institutes. Service bureaus and shared-user hubs sit between OEMs and industrial adopters by converting capex into per-part access, while also becoming repeat buyers of consumables and retrofits. Bottlenecks remain concentrated around batch processing, thermal uniformity, and tooling cost at larger part sizes, alongside contamination management tied to graphite tooling. Alongside this, R&D advances such as flash spark plasma sintering work reported by researchers at San Diego State University, including densification in seconds using conventional SPS equipment concepts, point to a technical pathway that, if industrialized, shifts value toward automation, process-control software, and robust tooling designs rather than only larger press frames.
Competitive Landscape
Competition is moderately fragmented. Japanese and European stalwarts Sumitomo Heavy Industries, Fuji Electric, FCT Systeme, and Dr. Sinter defend installed bases through proprietary die coatings, closed-loop controls, and global service teams. Their advantage lies in 500-ton-class machines tailored for aerospace qualification, complete with multi-zone temperature mapping for AS9100 traceability. Mid-tier challengers such as GeniCore and ELENIX compete on benchtop systems under USD 300,000, targeting academia and small tooling shops. Chinese manufacturers, Shanghai Sande and Shanghai Chenxin, undercut European prices by up to 30%, making rapid inroads among domestic research institutes.
Strategic differentiation is shifting toward software. Real-time monitoring of current density and shrinkage kinetics allows closed-loop adjustments that cut scrap rates. Equipment makers bundle predictive-maintenance analytics, locking clients into subscription models. Service bureaus add another layer of competition, operating shared presses at high utilization and offering per-part pricing. Cal Nano exemplifies this approach, freeing SMEs from capital commitments and broadening market reach.
Standards activity influences rivalry. ASTM Committee F42 drafts will institutionalize process parameters, and equipment vendors supplying underlying data can shape resulting specifications. Intellectual-property positioning is intensifying as well; Corning’s roll-to-roll patent signals potential paradigm shifts from batch to continuous sintering. Overall, the spark plasma sintering market shows moderate concentration, with incumbents maintaining share through performance leadership while new entrants exploit cost and service niches.
Spark Plasma Sintering Industry Leaders
Fuji Electric Co., Ltd.
FCT Systeme GmbH
Dr. Sinter SPS (Sinter Land Inc.)
Materials Research Furnaces, LLC
Thermal Technology LLC
- *Disclaimer: Major Players sorted in no particular order

Market Opportunities and Future Outlook
A primary whitespace is moving SPS/FAST from batch-centric R&D and pilot use into automated, higher-throughput production cells for batteries, power electronics ceramics, and advanced structural ceramics. Industrial platforms increasingly emphasize PLC-based control and automated handling, and product-positioning around multi-station or continuous concepts has become more visible, including commercialization claims around continuous SPS configurations (multi-station, automated operation, and high-temperature capability). Buyers value repeatability, traceability, and shorter cycle times for electrode consolidation and high-value ceramic components, which also increases attach rates for software upgrades, monitoring packages, and lifecycle services.
A second opportunity is process innovation that reduces cycle time and expands the addressable materials set, particularly for hard-to-densify ceramics such as silicon carbide. In May 2026, American Ceramic Society coverage highlighted San Diego State University research demonstrating flash hot pressing concepts that manage thermal runaway with pressure to densify silicon carbide in seconds, pointing to a route that leverages conventional SPS equipment architectures while redefining takt time. Separately, qualification-driven applications such as oxide-dispersion-strengthened (ODS) steels for advanced nuclear systems represent a high-barrier segment where SPS-derived microstructures and rapid densification are under active investigation, creating room for suppliers to pair equipment capability with application engineering, documentation, and repeatable tooling workflows.
Recent Industry Developments
- May 2026: Researchers highlighted by The American Ceramic Society reported a flash hot pressing approach using spark plasma sintering equipment concepts to densify silicon carbide in seconds by controlling thermal runaway with applied pressure. The result increases attention on cycle-time reduction and tighter process control, shifting competitive emphasis toward power delivery, sensing, and automation packages that can support repeatable ultra-rapid runs.
- December 2025: Sumitomo Heavy Industries won a JAXA order for five 300 mm presses with tight pyrometry control for aerospace-grade processing. The award reinforces demand for larger-format systems and qualification-oriented instrumentation, strengthening the role of high-spec equipment configurations and long-term service support in aerospace and defense supply chains.
- November 2024: Corning filed a patent covering continuous roll-to-roll field-assisted sintering for battery electrodes and substrates. The filing indicated an industrialization path beyond single-shot batch compacts, encouraging equipment makers and materials developers to assess continuous or semi-continuous architectures for electrode consolidation and high-volume ceramic processing.


Research Methodology Framework and Report Scope
Market Definition and Coverage
For this methodology, the spark plasma sintering (SPS, also called FAST) market is treated as the revenue generated from SPS press systems and closely linked hardware that is purchased and used to densify powders into solid parts across metals, ceramics, and composites.
Scope exclusions: We exclude toll or contract sintering service revenue and small-lot bench consumables that are not tied to installed press systems.
Segmentation Overview
- By Component
- Equipment
- Consumables (Graphite Dies, Punches, Foils)
- Services (Installation, Maintenance, Retrofits)
- By Press Capacity
- <100 Ton
- 100–500 Ton
- >500 Ton
- By Material Processed
- Ceramics
- Metals and Alloys
- Composites
- Functionally-Graded Materials
- By End-Use Industry
- Aerospace and Defense
- Automotive
- Electronics and Semiconductor
- Energy (Fuel Cells, Batteries)
- Medical and Dental
- Research Institutes
- By Geography
- North America
- United States
- Canada
- Mexico
- South America
- Brazil
- Argentina
- Rest of South America
- Europe
- Germany
- United Kingdom
- France
- Italy
- Spain
- Rest of Europe
- Asia-Pacific
- China
- India
- Japan
- South Korea
- Australia and New Zealand
- Rest of Asia-Pacific
- Middle East
- Saudi Arabia
- United Arab Emirates
- Turkey
- Rest of Middle East
- Africa
- South Africa
- Nigeria
- Egypt
- Rest of Africa
- North America
Data Sources, Market Sizing, and Validation
Desk Research
Desk research was used to build the basic demand map and to anchor the model inputs that can be checked independently. We mainly relied on public sources such as the US Geological Survey for powder and mineral context, UN Comtrade for trade direction signals on relevant industrial machinery and graphite items, the World Bank for industrial output indicators, and the International Energy Agency for electricity price and reliability context, since electricity costs and uptime can influence high-power equipment adoption.
On the industry side, we also reviewed patent databases to track SPS and FAST related filings and identify where activity is clustering. Company annual reports, investor presentations, and press releases were used to understand product positioning and typical shipment timing. A paid subscription for company financials and news helped verify ownership changes and revenue disclosures when available, and an import-export shipment-level database was used selectively to sanity-check cross-border movement patterns for specialized equipment. These sources are illustrative only, and many other references were also consulted for data collection, validation, and clarification.
Primary Interviews and Surveys
Primary work focused on interviews and structured surveys with SPS equipment makers, graphite tooling and consumables suppliers, distributors, lab and pilot-line users, and manufacturing engineers in key end markets. Since this is a global market, we balanced viewpoints across APAC, EMEA, and the Americas, so assumptions around installations, retrofit cycles, and average selling prices could be challenged and corrected where needed.
Distribution of primary research fieldwork respondents
| Company type | Respondent position | Region |
|---|---|---|
| Top tier: 32% | CXOs: 14% | APAC: 46% |
| Mid tier: 52% | Functional/Unit leaders: 31% | EMEA: 35% |
| Smaller Players: 16% | Managers: 55% | Americas: 19% |
Market-Sizing & Forecasting
Sizing starts with a top-down build that reconstructs the installed-base and new-install demand pool using manufacturing output signals and equipment adoption rates for powder metallurgy, advanced ceramics, and functional materials. We then convert the demand pool into revenue using realistic price bands.
The output is corroborated with selective bottom-up approximations, such as sampled average selling price times estimated annual unit shipments based on supplier discussions, and channel checks on lead times and backlog direction. Key inputs that shaped the model include annual SPS press installations and replacement cycles, typical press tonnage and power-supply ranges used by end users, graphite tooling consumption patterns tied to run hours, the split between lab-scale and production-scale systems, and regional import intensity for specialized machinery. Where bottom-up inputs were missing for smaller markets, we filled gaps using proxy ratios, for example, SPS adoption per relevant R&D spending and industrial ceramics output, before re-checking the implied results through interviews.
For forecasting, we used scenario analysis supported by a light multivariate regression layer, where dependent growth was tested against industrial production, advanced materials R&D intensity, and capital equipment spending trends. The final forecast path was kept practical by applying interview-led constraints on ASP progression, commissioning timelines, and capacity utilization behavior.
Data Validation & Update Cycle
Outputs were validated through multiple cross-checks so that one single assumption could not drive the final number. We compared implied unit volumes, revenue per installed system, and aftermarket shares against independent signals such as trade movement, patent momentum, and end-user investment cycles, and then flagged outliers for review.
Before sign-off, a second analyst reviews the logic, calculations, and year-to-year variances, and we re-contact sources when a variance cannot be explained by a visible demand driver. Reports are refreshed annually, and interim updates are made when material events occur, including major capacity expansions, policy shifts affecting advanced manufacturing, or sharp currency moves. Right before delivery, a fresh pass is completed so clients receive the most current view.
Mordor Intelligence's Spark Plasma Sintering Market Sizing Compared With Other Published Estimates
Published market sizes for spark plasma sintering often vary because the study scope is not always the same, and because researchers choose different base years, price assumptions, and what they treat as core revenue. Differences can also come from estimates that lean on long-range growth expectations without enough checks against actual installation activity.
In this market, the biggest gaps typically come from whether the number counts only SPS presses and attached power-supply hardware, or whether it also includes service revenue, broader powder-to-part value, or unrelated consumables. Another driver is how currency timing and inflation treatment are handled, since capital equipment pricing can move quickly and can distort a single-year snapshot if not normalized. For that reason, constant-dollar sizing and installed-base checks were applied here before finalizing the total, consistent with Mordor Intelligence.
Benchmark comparison
| Source | Market Size | Gaps in Research Methodology |
|---|---|---|
| Mordor Intelligence | USD 0.89 B (2025) | |
| Trade Journal B | USD 0.50 B (2024) | Uses an earlier base year and appears to emphasize equipment-only revenue with limited normalization for ASP differences between lab systems and production-scale presses, which compresses the total. |
| Regional Consultancy A | USD 0.17 B (2023) | Seems to focus mainly on press shipments and excludes linked power-supply cabinets and scheduled aftermarket parts, and the older year further reduces the stated market value. |
The spread across the table is mainly explained by what is counted as SPS revenue and the year chosen for the snapshot. When press systems, attached hardware, and scheduled aftermarket parts are treated consistently and then checked against installation and pricing signals, the result is easier to trace back to clear variables and repeatable steps.


Key Questions Answered in the Report
How large is the spark plasma sintering market in 2026?
It is valued at USD 0.94 billion in 2026 and is projected to reach USD 1.23 billion by 2031, reflecting a 5.53% CAGR.
Which segment shows the fastest revenue growth?
Automotive applications post the highest growth at 5.90% CAGR, driven by ceramic brake discs and silicon-carbide power modules.
Why are services gaining share in the spark plasma sintering market?
As the installed base matures, users prioritize uptime and data-driven upgrades, pushing service revenue above 6% annual growth.
Which region leads global demand?
Asia-Pacific held 38.94% of 2025 revenue, propelled by electric-vehicle batteries and semiconductor substrates.
Page last updated on:


