Space-Based Solar Power Market Size and Share
Market Overview
| Study Period | 2020 - 2041 |
|---|---|
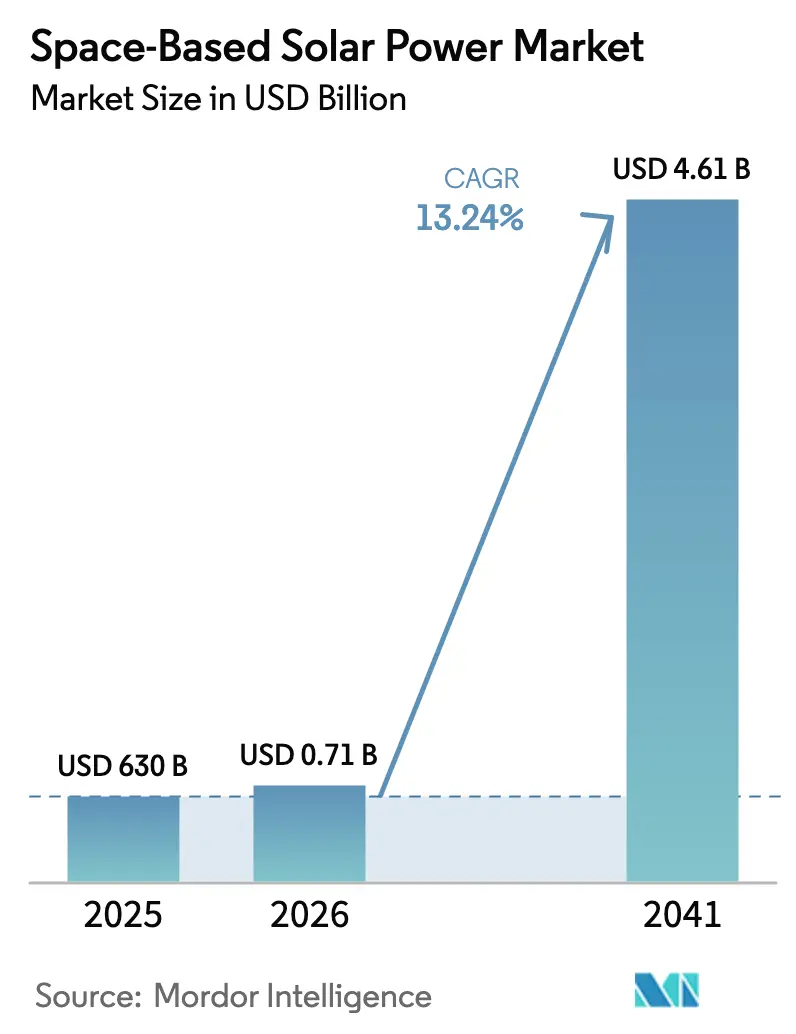
| Market Size (2026) | USD 0.71 Billion |
| Market Size (2041) | USD 4.61 Billion |
| Growth Rate (2026 - 2041) | 13.24% CAGR |
| Fastest Growing Market | Europe |
| Largest Market | North America |
| Market Concentration | Medium |
Major Players *Disclaimer: Major Players sorted in no particular order Image © Mordor Intelligence. Reuse requires attribution under CC BY 4.0. | |
Space-Based Solar Power Market Analysis by Mordor Intelligence
The space-based solar power market size is expected to grow from USD 630 million in 2025 to USD 713.4 million in 2026 and is forecast to reach USD 4.61 billion by 2041 at 13.24% CAGR over 2026-2041. This performance is grounded in widening public-sector commitments, steadily declining launch prices, and component breakthroughs that collectively reposition the technology from laboratory concept to a plausible utility-scale option. Continuous solar illumination in geostationary orbit removes the intermittency limits that hamper terrestrial renewables. At the same time, metamaterial rectennas have surpassed 90% conversion efficiency thresholds, shrinking the land footprint of ground receivers and trimming delivered-energy costs. Reusable heavy-lift vehicles such as SpaceX’s Starship and Blue Origin’s New Glenn are compressing payload-to-orbit expenses to one-hundredth of shuttle-era levels, unlocking business models that would have been infeasible even five years ago. Government demonstrator missions in the United States, Japan, China, and Europe validate technical readiness, de-risk private capital, and create an innovation race pulling forward timelines for commercial roll-out.[1]Source: U.S. Air Force Research Laboratory, “Space Power Beaming,” afresearchlab.com
Key Report Takeaways
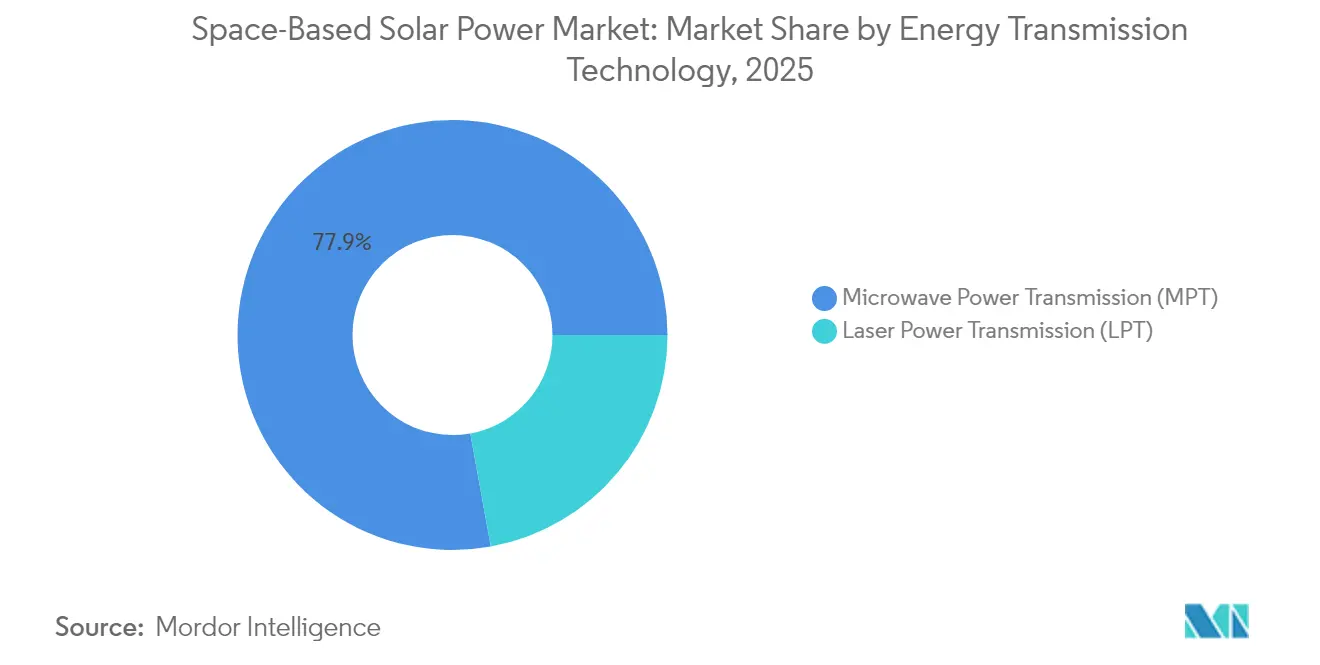
- By energy transmission technology, microwave power transmission (MPT) led with 77.85% revenue share in 2025, while laser power transmission (LPT) is projected to expand at an 18.18% CAGR through 2041. These trends highlight early technological leadership within the space-based solar power market.
- By application, terrestrial installations accounted for 59.10% share in 2025, yet space applications are expected to grow at a 15.58% CAGR through 2041. This expansion underscores diversified adoption across the space-based solar power market.
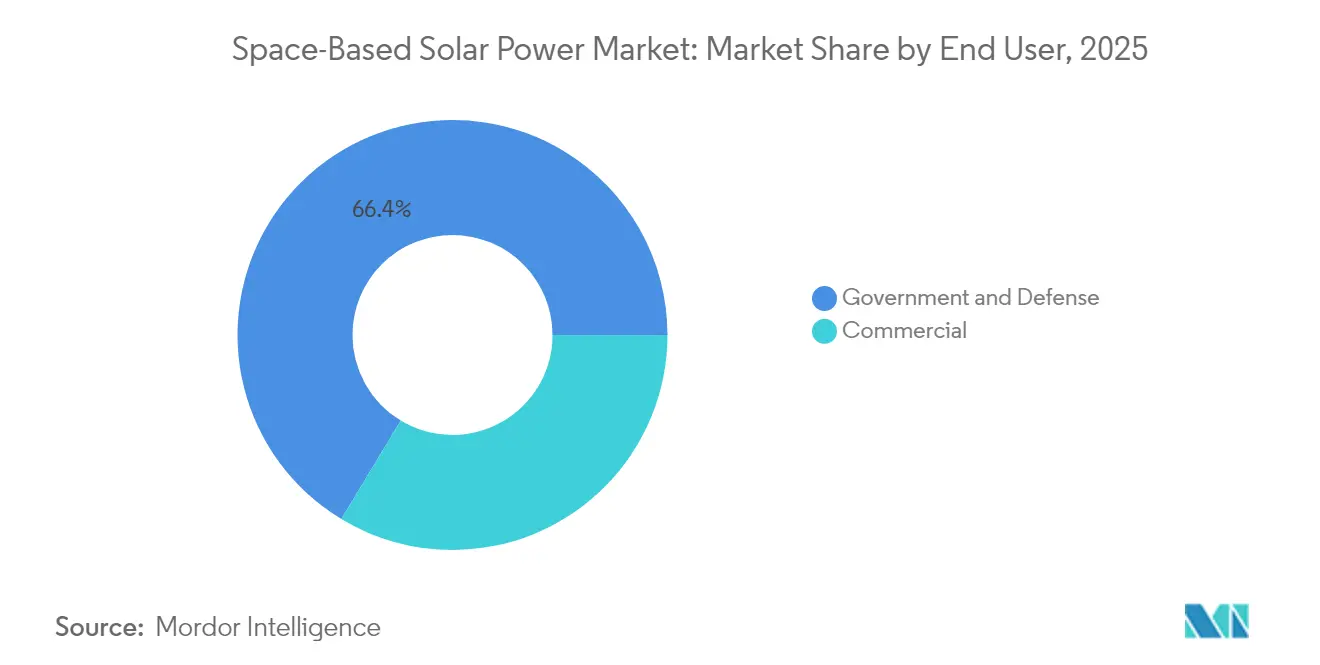
- By end user, government and defense controlled a 66.35% share in 2025, whereas commercial applications are forecasted to register the fastest CAGR at 16.12% to 2041.
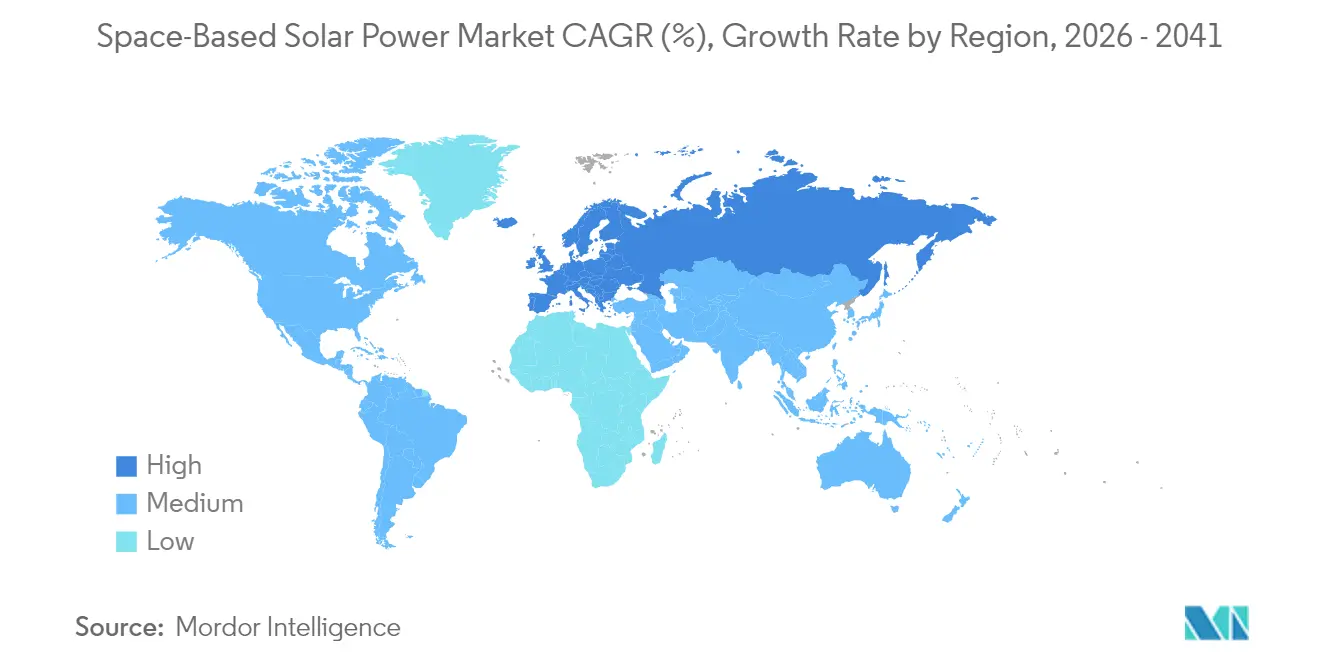
- By geography, North America commanded 49.10% of 2025 revenue, while Europe is anticipated to post the highest regional CAGR of 14.88% to 2041.
Note: Market size and forecast figures in this report are generated using Mordor Intelligence’s proprietary estimation framework, updated with the latest available data and insights as of 2026.
Global Space-Based Solar Power Market Trends and Insights
Drivers Impact Analysis*
| Driver | (~) % Impact on CAGR Forecast | Geographic Relevance | Impact Timeline |
|---|---|---|---|
| Declining launch costs driven by reusable rockets | +3.2% | Global with early gains in North America and Europe | Medium term (2-4 years) |
| Continuous solar illumination enables baseload renewable power | +2.8% | Global | Long term (≥ 4 years) |
| National-security push for energy independence | +2.1% | North America, Europe, Asia-Pacific | Short term (≤ 2 years) |
| Government-funded SBSP demonstrator missions | +1.9% | North America, Asia-Pacific, Europe | Medium term (2-4 years) |
| Synergy with lunar ISRU and cislunar infrastructure | +1.7% | Global | Long term (≥ 4 years) |
| High-efficiency metamaterial rectennas reduce ground footprint | +1.5% | Global | Medium term (2-4 years) |
| Source: Mordor Intelligence | |||
Declining Launch Costs Driven by Reusable Rockets
Reusable heavy-lift architectures are redefining satellite economics by driving payload-to-orbit prices toward the USD 10 per kilogram mark, a step-change from the USD 1,000 baseline that prevailed during the final shuttle flights. Starship’s 100-tonne capacity—validated through multiple sub-orbital tests—allows a single launch to carry enough modular panels to generate upward of 25 megawatts in space, compressing the deployment schedule for a 2-gigawatt constellation from decades to a few years. Parallel demonstrations by Blue Origin, the European CALLISTO program, and Japan’s next-generation H3 derivative create a multi-vendor environment that accelerates learning curves, amplifies volume, and pushes costs down further. Monte-Carlo cost models published by ESA show that every 20% reduction in launch price cuts delivered-energy costs by roughly 7%, bringing levelized costs near USD 25 per megawatt-hour—competitive with large-scale terrestrial solar under sunny conditions.[2]Source: European Space Agency, “ESA Developing Space-Based Solar Power Plant Plans,” esa.int
Continuous Solar Illumination Enables Baseload Renewable Power
Panels in geostationary orbit receive sunlight for more than 99% of the year, surpassing the 15-25% capacity factors seen by land-based photovoltaics. This orbital advantage neutralizes the intermittency dilemma that forces grid operators to maintain fossil-backup generation or bulk storage for wind and ground solar. Studies funded by the European Commission estimate that a 2-gigawatt space power satellite could feed roughly 95% of its nameplate rating into continental grids, delivering time-of-day-agnostic electricity and shaving the need for seasonal storage. Similar modeling at China’s Chongqing test site compares the concept of relocating the Three Gorges Dam to space, underlining scale and continuity. Military planners value the baseload feature because it removes fuel convoy vulnerabilities at forward operating bases, cutting logistical casualties and costs. This advantage is becoming a defining growth driver for the space-based solar power market.
National-Security Push for Energy Independence
Defense ministries increasingly frame orbital power platforms as strategic infrastructure capable of sustaining expeditionary forces and critical homeland sites amid cyber or kinetic disruption of surface grids. The US Department of Defense's SSPIDR program funds Northrop Grumman's hardware that converts DC photovoltaic output into agile microwave beams steerable to mobile receiving tents, giving commanders a field-deployable five-megawatt plant with no diesel pipeline exposure. China's kilometer-scale array program, scheduled for its first functional power downlink by 2028, intensifies geopolitical urgency among Western allies. Japan's OHISAMA project blends civilian and security objectives by stress-testing transmission safety over populated areas. Together, these defense programs continue to underpin early investments in the space-based solar power market.
Government-Funded SBSP Demonstrator Missions
Government grants cap early-stage risk by underwriting orbital testbeds that address deployment, thermal management, and beam-control challenges. ESA’s SOLARIS roadmap budgets several hundred million dollars through 2027 for architecture trade-offs and ground receiver validation. The UK Space Energy Initiative allocates GBP 4.3 million (USD 5.71 million) to domestic firms developing lightweight truss structures and adaptive rectennas. In Asia, METI backs Japan Aerospace Exploration Agency experiments that move beyond lab rigs to full-scale panel assemblies launched by 2026. China’s Bishan facility has already begun high-power beam steering rehearsals, generating a knowledge base that private spin-offs can license, shortening venture-capital payback periods. Such initiatives create a supportive policy foundation that anchors the space-based solar power market.
Restraints Impact Analysis*
| Restraint | (~) % Impact on CAGR Forecast | Geographic Relevance | Impact Timeline |
|---|---|---|---|
| High R&D and certification costs | -2.4% | Global | Medium term (2-4 years) |
| Supply-chain constraints for heat-exchangers and compressors | -1.8% | Global, concentrated in Asia-Pacific manufacturing | Short term (≤ 2 years) |
| Thermal-load challenges in eVTOL platforms | -1.2% | North America, Europe | Medium term (2-4 years) |
| Uncertain reliability of next-gen low-GWP refrigerants | -0.9% | Global | Long term (≥ 4 years) |
| Source: Mordor Intelligence | |||
High R&D and Certification Costs
NASA's comparative cost study shows that even today's most optimistic space power concepts run between USD 0.61 and USD 1.59 per kilowatt-hour, placing them 4-10× above utility-scale terrestrial renewable averages. The gap stems from the intricate combination of space-rated solar cells, modular truss structures, and high-frequency beam-control electronics, each subject to mission-critical qualification protocols. For instance, Caltech's 50-kilogram testbed consumed over USD 100 million before delivering its first 200 watts, illustrating steep early marginal costs. Certification adds a separate layer: the US Federal Communications Commission, National Telecommunications and Information Administration, and International Telecommunication Union each impose power-density and frequency coordination reviews that can extend timelines by 18-24 months. ESA's SOLARIS budget alone earmarks several hundred million dollars through 2025 for just three platform concepts—an order of magnitude above a typical CubeSat constellation business case, which complicates venture-capital exit horizons.
Supply-Chain Constraints for Heat-Exchangers and Compressors
Space power satellites dissipate multi-gigawatt thermal loads through loop heat pipes and advanced radiator panels, requiring super-alloys with thermal conductivities above 700 W/m-K. Only a handful of foundries produce these materials; most are clustered in East Asia. Recent germanium export restrictions from China threaten supply for multi-junction photovoltaic wafers, while rare-earth processing concentration jeopardizes permanent-magnet production for phased-array transmitters. Western policy responses such as the CHIPS and Critical Raw Materials Acts target reshoring, yet facility lead times mean tight raw-material conditions will linger through 2028. Component shortages in compressors and phase-change heat exchangers have already delayed prototype schedules by six to nine months, translating into millions in carrying costs for privately funded programs.[3]Source: Americom, “Strain on Our Germanium Supply Chain,” americom.org
*Our forecasts treat driver/restraint impacts as directional, not additive. The impact forecasts reflect baseline growth, mix effects, and variable interactions.
Segment Analysis
By Energy Transmission Technology: Microwave Dominance with Laser Acceleration
Microwave Power Transmission (MPT) commanded 77.85% of 2025 revenue thanks to decades of military and academic validation, a mature regulatory landscape, and new metamaterial rectennas that break the 90% efficiency barrier. That share anchors the space-based solar power market size at an early-commercial scale. However, laser power transmission is advancing at an 18.18% CAGR, which will gradually chip away at microwave primacy. Laser systems can steer narrower beams, slash ground-array acreage, and sidestep the RF congestion that inhibits deployment near populated corridors. While small in absolute power, DARPA’s recent eight-kilometer laser downlink demonstration showcased 20% wall-plug efficiency and centimetric beam stability under variable atmospheric conditions. Hybrid concepts route optical beams to high-altitude aerostats before switching to microwave for final delivery, combining laser collimation with microwave weather resilience. This pathway adds optionality to system architects. Market entrants that field modular transmitters capable of quick-swap frequency operation could arbitrage regulatory windows between RF and optical bands, improving asset utilization and shortening payback periods.
Commercial competitiveness hinges on mass-manufacturing rectenna tiles and gigawatt-class steering arrays. Microwave systems benefit from economies of scale because the same X-band monolithic microwave integrated circuit (MMIC) fabs that serve 5G can be repurposed. Lasers lack that crossover, but silicon carbide laser-diode foundries in Europe are scaling, aided by Horizon Europe grants. Regulatory convergence remains an open issue; microwave licenses must dovetail with existing satellite services, whereas lasers fall under optical communication rules that are less mature for power applications. Companies that navigate both frameworks will gain first-mover advantage, reinforcing the current 77.85% microwave share yet opening room for differentiated laser solutions that carve new revenue pools within the space-based solar power market.


By Application: Terrestrial Focus with Space Segment Momentum
Terrestrial receivers accounted for 59.10% of 2025 installations, reflecting the immediate payoff in remote mining, disaster relief, and island microgrids, where diesel fuel costs exceed USD 0.35 per kilowatt-hour. Defense customers in the United States and Europe deploy containerized rectennas to forward operating bases, where each delivered kilowatt offsets 2.5 liters of JP-8 fuel and removes convoy exposure. Utilities in New Zealand and Chile have begun permitting ground stations that will couple orbital power with existing substations, creating a 24-hour renewable blend that stabilizes local grids during drought-related hydro shortfalls. These projects give the terrestrial segment firm revenue, anchoring cash-flow assumptions that underpin the broader space-based solar power market size.
The space-application segment, however, is scaling at a 15.58% CAGR driven by constellation-to-constellation power trading, lunar habitats, and deep-space gateways. Star Catcher’s USD 12.25 million seed round targets an orbital energy grid that sells kilowatt-hours to in-orbit data centers, pointing to a service model analogous to terrestrial power purchase agreements. Lunar surface projects under Artemis Phase II envisage 20-meter inflatable rectennas that beam power from polar orbits to the permanently shadowed Shackleton Crater water-mining base. As in-space demand rises, inter-satellite peering markets could evolve, where surplus power from one constellation is auctioned to another in real time, echoing terrestrial spot markets and potentially expanding the space-based solar power market share of space applications beyond 30% by the mid-2030s.
By End User: Government Leadership with Commercial Acceleration
Government and Defense customers controlled 66.35% of 2025 revenue, validating early system architectures, absorbing risk, and shaping standards. The SSPIDR program funnels non-dilutive finance into beam-control avionics and high-density gallium-arsenide solar wafers, accelerating technology readiness that later percolates to civilian uses. Military specifications for beam containment and fail-safe cut-offs become de facto baselines that shorten certification for commercial roll-outs. The concentration of defense dollars underpins supplier capacity, ensuring new entrants find ready subcontractor ecosystems for flight hardware.
Commercial uptake is climbing at a 16.12% CAGR as independent power producers, telecom operators, and agri-tech firms evaluate orbital power purchase agreements indexed to wholesale electricity prices. The ESA-backed Space Energy Initiative aggregates industrial offtake commitments from firms such as ENGIE and ENEL, creating bankable demand that approaches the scale of a mid-sized onshore wind portfolio. Venture backing for pure-play firms like Aetherflux signals investor appetite for asset-light models that lease portions of multi-gigawatt satellites instead of owning hardware outright. Over the forecast period, government share should taper but remain above 50%, anchoring the space-based solar power market while commercial niches blossom around specialized use cases.
Geography Analysis
North America captured 49.10% of the space-based solar power market in 2025, underpinned by the US Air Force, NASA, and a vibrant launch ecosystem that collectively lowers technical and financial barriers. SSPIDR milestone tests proved end-to-end solar-to-RF conversion, building confidence for scaled deployment and energizing a supply chain spanning Colorado, California, and Alabama. Venture funding gravitates toward the region: Aetherflux closed a USD 50 million Series A and Solestial secured a USD 1.2 million SpaceWERX award to automate solar cell production for low-Earth-orbit satellites. Yet, NASA's 2024 cost skepticism introduces policy overhang, showing that funding is still susceptible to shifting budget priorities. Mineral dependencies remain vulnerable; more than 60% of the germanium required for US space solar cell output still traces back to Chinese refineries, prompting legislative push-back embodied in the CHIPS and Science Act.
Europe records the highest growth at 14.88% CAGR through 2041 through the SOLARIS program, unified spectrum policy discussions, and targeted grants such as the EUR 4 million (USD 4.61 million) European Innovation Council check to SPHERICAL. The UK sees strategic opportunity in pairing its high-latitude receiving sites with excess offshore wind infrastructure, creating hybrid renewable hubs that sell 24-hour green power into continental markets. Consortia anchored by Thales Alenia Space develop lightweight carbon-fiber truss booms at French and Italian plants, while German machine-tool specialists deliver automated fastening robots for on-orbit assembly. Continental power-sector modeling indicates that importing one terawatt-hour per year via orbital stations could cut gas peaker-plant usage by 6%, delivering carbon abatement without expanding terrestrial land use.
Asia-Pacific follows a dual-track trajectory. China's kilometer-scale Bishan pilot and Changsha fabrication plant propel gigawatt-class module manufacturing that could eclipse Western production by 2028. The government mandates a minimum 70% domestic content for space energy stations, creating volume that builds supplier depth unmatched elsewhere. Japan, meanwhile, leans on precision manufacturing to refine microwave phase arrays and prepares the OHISAMA demonstration for 2025, aiming to verify beam pointing to ocean barges 36,000 kilometers below. South Korea announced a strategy targeting a 120-gigawatt orbital capacity by 2045, banking on its shipbuilding industry's large-scale aluminum fabrication skills. India's nascent discussions center on pairing geostationary collectors with southern desert rectenna sites. These activities place Asia-Pacific in a strong follower-innovator role, likely to challenge North America's share beyond 2030.

Competitive Landscape
The space-based solar power industry remains moderately fragmented, with no entity overseeing more than 20% of awarded demonstrator funding, but collaboration blurs strict competitive lines. U.S. primes such as Northrop Grumman Corporation leverage decades of defense contracting experience for beam control and thermal management, forming joint ventures with electronics specialists to speed certification. European aerospace majors pursue an open-architecture ethos: Airbus Defence and Space collaborates with Hanwha Systems on 50% lighter tandem solar cells, trading IP to mitigate supply risks while positioning for joint bids in emerging markets.
Start-ups drive niche breakthroughs. Solestial commercializes ultra-thin silicon that withstands 10× the radiation dose of conventional panels, raising throughput of automated roll-to-roll coating lines by 40%. Star Catcher develops market-clearing software for satellite-to-satellite power trades, a first step toward orbital spot electricity markets. Virtus Solis combines robotic 3D-printing with modular sail-style arrays deployable from a single Starship launch, compressing assembly times and leveraging launch cost declines to capture early cash flows. Patent analysis reveals a surge in filings covering metamaterial rectennas and autonomous truss crawlers, but also clustering around safety lock-out circuitry, an area where regulatory compliance drives differentiation rather than pure performance.
International dynamics add competitive tension. China’s state-funded research centers accelerate prototype iteration cycles unheard of in Western funding frameworks, tightening time-to-market windows and spurring policymakers in the United States and Europe to co-fund indigenous alternatives. Yet Western strengths in software, advanced semiconductors, and launch cadence counterbalance scale advantages enjoyed by Chinese programs. Over the forecast period, partnerships are expected to emerge that blend Western beam-forming IP with Asian high-volume production know-how, reinforcing a coopetition model typical of other space hardware segments.
Space-Based Solar Power Industry Leaders
Northrop Grumman Corporation
Airbus SE
Space Solar Group Holdings Ltd.
The Boeing Company
Thales Group
- *Disclaimer: Major Players sorted in no particular order

Recent Industry Developments
- October 2024: Space Solar and Transition Labs announced its plans to deliver 30 MW of clean energy to Iceland by 2030 through the first-ever space-based solar power plant. This groundbreaking delivery marks a significant milestone in the space-based solar power market, ensuring a 24/7 renewable energy supply and advancing global sustainable energy initiatives.
- April 2024: UK-based Space Solar Engineering was awarded GBP 1.2 million (USD 1.59 million) for Cassiopeia's Solar Project Market. The funding, provided through the UK government's space-based solar power innovation, will support the development of a space-based solar power (SBSP) system.


Global Space-Based Solar Power Market Report Scope
| Microwave Power Transmission (MPT) |
| Laser Power Transmission (LPT) |
| Terrestrial |
| Space |
| Government and Defense |
| Commercial |
| North America | United States |
| Canada | |
| Europe | Germany |
| United Kingdom | |
| France | |
| Rest of Europe | |
| Asia-Pacific | China |
| Japan | |
| India | |
| Rest of Asia-Pacific | |
| Rest of the World | Middle East and Africa |
| South America |
| By Energy Transmission Technology | Microwave Power Transmission (MPT) | |
| Laser Power Transmission (LPT) | ||
| By Application | Terrestrial | |
| Space | ||
| By End User | Government and Defense | |
| Commercial | ||
| By Geography | North America | United States |
| Canada | ||
| Europe | Germany | |
| United Kingdom | ||
| France | ||
| Rest of Europe | ||
| Asia-Pacific | China | |
| Japan | ||
| India | ||
| Rest of Asia-Pacific | ||
| Rest of the World | Middle East and Africa | |
| South America | ||


Key Questions Answered in the Report
What is the forecast value for space-based solar power deployments by 2041?
The space-based solar power market is expected to reach USD 4.61 billion in 2041, driven by a 13.24% CAGR during 2026-2041.
How do reusable rockets influence orbital solar economics?
Heavy-lift reusable launchers such as Starship cut payload costs to roughly USD 10 per kilogram, lowering delivered energy prices by about 7% for every 20% drop in launch cost.
Which region currently leads orbital solar activity?
North America holds 49.10% of 2025 revenue owing to robust Air Force and NASA programs plus active start-up funding.
What technology holds the largest share of transmitted-energy solutions?
Microwave Power Transmission (MPT) controls 77.85% of 2025 revenue thanks to mature RF systems and established regulatory frameworks.
Why are metamaterial rectennas important?
They boost RF-to-DC conversion over 90%, reducing ground station land area and accelerating permitting for commercial projects.
Which application is growing fastest within the field?
Space-to-space power supply for satellites and lunar infrastructure is expanding at a 15.58% CAGR as in-orbit demand rises.
Page last updated on:


