
Market Overview
| Study Period | 2021 - 2031 |
|---|---|
| Forecast Data Period | 2026 - 2031 |
| Historical Data Period | 2021 - 2024 |
| Growth Rate | 6.93 % |
| Market Concentration | Low |
Major Players *Disclaimer: Major Players sorted in no particular order Image © Mordor Intelligence. Reuse requires attribution under CC BY 4.0. | |
Southeast Asia Power Generation EPC Market Analysis by Mordor Intelligence
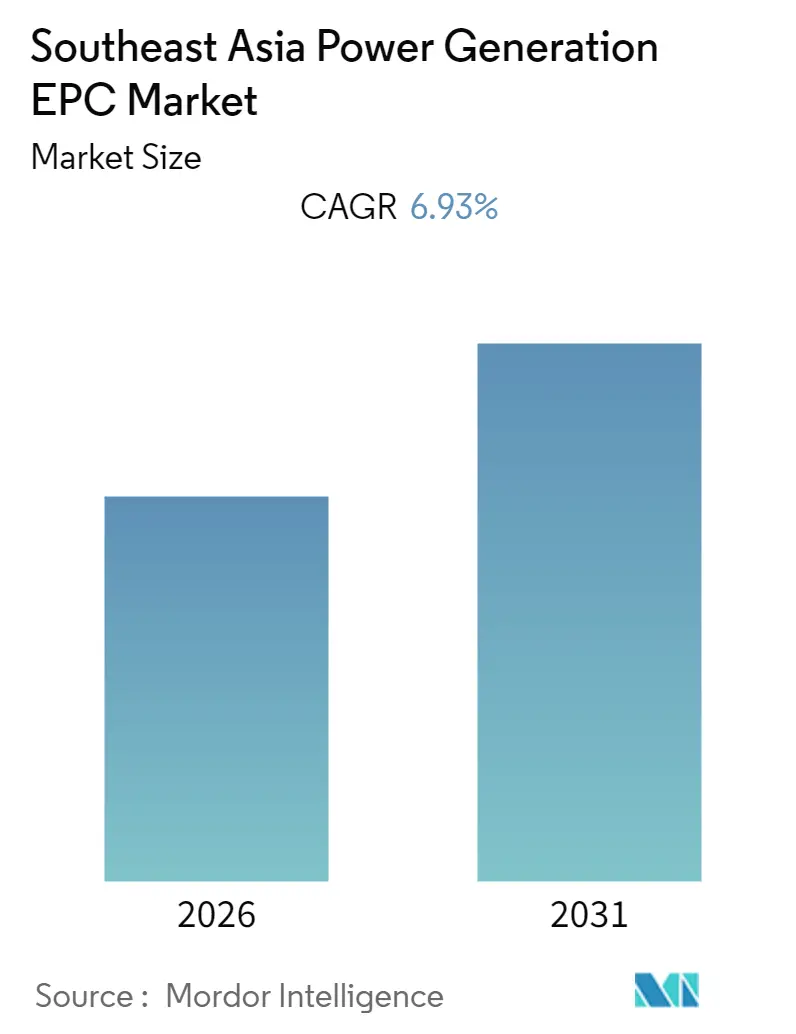
The Southeast Asia Power Generation EPC Market size is expected to register a CAGR of 6.93% during the forecast period (2026-2031).
- Favorable government policies and mandates toward the adoption of renewable energy sources and a rising focus on reducing carbon emissions across the region are expected to boost the renewable power generation EPC market at a significant rate.
- The energy demand in the Southeast Asian region is anticipated to grow by approximately two-thirds between 2019 and 2040, thereby leading to massive investment in new energy generation, distribution, and transmission, creating surplus market opportunities for the EPC market players in the coming years.
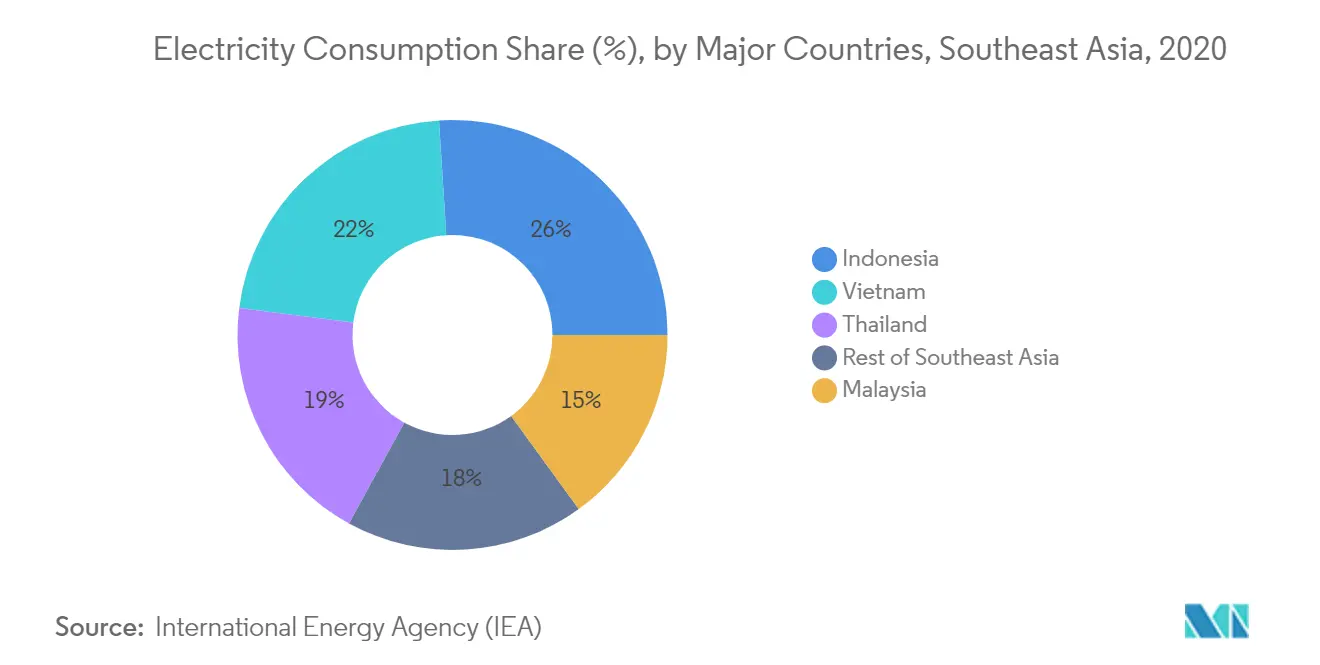
- Indonesia, the largest economy in Southeast Asia, witnessed the highest power generation in 2021. The nation is expected to dominate the power generation EPC market during the forecast period with planned projects.
Note: Market size and forecast figures in this report are generated using Mordor Intelligence’s proprietary estimation framework, updated with the latest available data and insights as of 2026.
Southeast Asia Power Generation EPC Market Trends and Insights
Renewables Power Source to Witness Significant Demand
- The Association of Southeast Asian Nations (ASEAN) has set an ambitious target of securing 23% of its primary energy from renewable sources and a 35% share in installed capacity by 2025. Energy demand in the region is expected to grow by 50%. This, in turn, is projected to provide a significant boost to the Southeast Asian power generation EPC market under renewable sources.
- By the end of 2020, installed wind energy capacity in Vietnam reached 600 MW. The accelerated targets set by the Vietnamese government are expected to reach 11,800 MW by 2025, which is expected to boost the power generation EPC market across the region.
- Favorable government policies introduced by the Malaysian government to increase the renewable energy share across the country are expected to augment the market. The net metering 3.0 program introduced by the government to encourage the deployment of solar power systems in the residential and commercial sectors is expected to stimulate the demand for the power generation EPC market.
- Due to the upcoming projects, the share of renewable energy in power generation is growing in Thailand significantly. With 7,406 MW in 2014 and 11,991 MW in 2020, the installed capacity of renewable energy is increasing continuously in the country.
- Moreover, the Electricity Generating Authority of Thailand (EGAT) plans to build 2.7 GW of floating solar power capacity on the dam reservoirs by 2037. The goal will be to generate plenty of opportunities to drive the EPC market considerably. Hence, the above factors further enhance the market share of the power generation EPC market in the region.
- Hence, based on the above-mentioned factors, the renewable power source segment is expected to witness significant demand during the forecast period.
Indonesia to Dominate the Market
- Indonesia is one of the largest economies in Southeast Asia. The country's electricity sector is highly reliant upon fossil fuels for electricity generation, particularly lignite and bituminous coal. Although not the same as coal, natural gas is also expected to remain an integral part of the country's energy mix.
- The Indonesian Government introduced a new Electricity Procurement Plan (RUPTL), under which the country aims to add 4.7 GW of solar energy by 2030. This is expected to propel the country's market share of power generation EPC under the renewable sector.
- The rising investment trend in the renewable energy sector across Indonesia is anticipated to increase market growth. In 2020, USD 1.36 billion investment was witnessed in the renewable energy sector.
- The Indonesian Government is planning to phase out coal power plants with nuclear reactors to decrease the carbon emissions along with increasing the power generation from nuclear plants. However, the country has immense potential for generating nuclear energy across the region when compared to any other country in the Southeast Asian region.
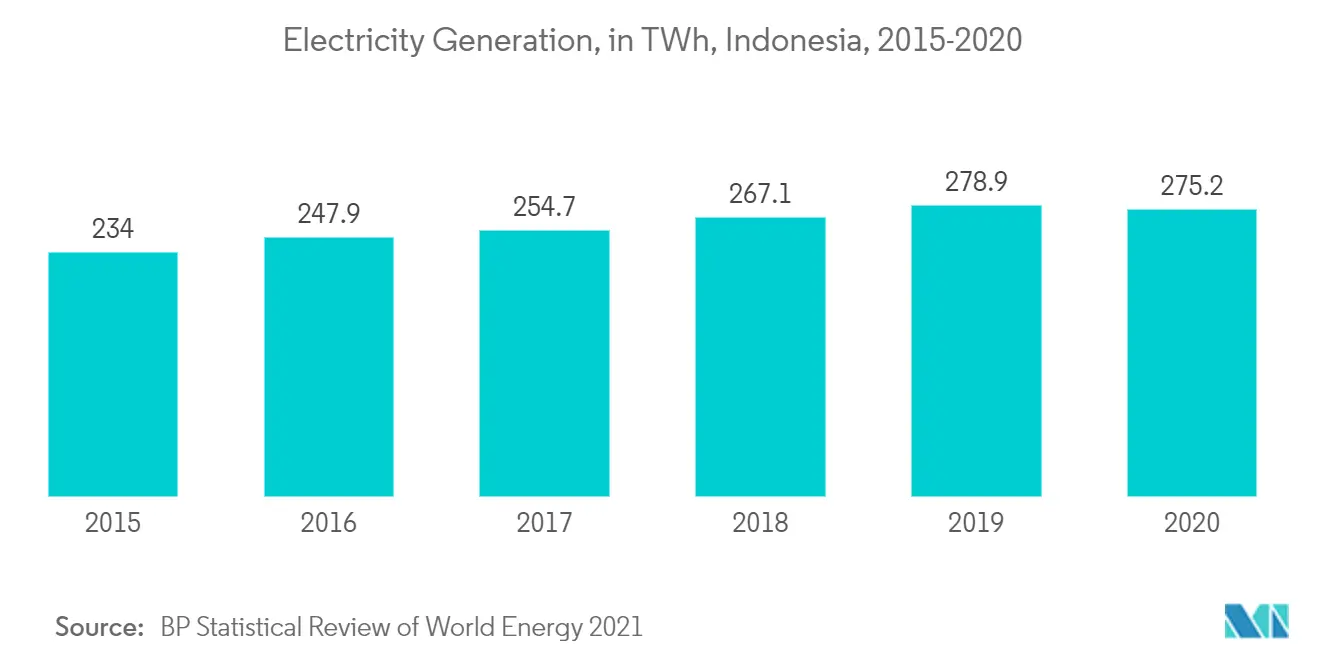
- Therefore, with increasing power demand, power generation is also growing. Indonesia generated 275.2 TWh of electricity in 2020. New projects are expected to meet the soaring power demand during the forecast period and drive a considerable market.
- Therefore, based on the above-mentioned factors, Indonesia is expected to dominate the Southeast Asian power generation EPC market during the forecast period.
Regulatory Landscape
Power generation EPC activity across Southeast Asia is shaped by national electricity frameworks and by increasing ASEAN-led coordination on cross-border interconnections. In October 2025, ASEAN energy ministers endorsed an Enhanced ASEAN Power Grid (APG) Memorandum of Understanding to align rules, technical requirements, and financing approaches for interconnections, supporting multi-country project development and harmonized grid-connection practices.
At the country level, Vietnam updated core development and procurement rules that affect EPC tendering and project bankability. Vietnam Decree No. 56/2025/ND-CP (effective March 3, 2025) elaborates the Law on Electricity with provisions covering electricity development planning, construction, and bidding to select investors, while Resolution No. 253/2025/QH15 provides mechanisms for national energy development for 2026-2030 (effective March 1, 2026). Vietnam also adjusted its direct power purchase agreement framework through Decree No. 243/2026/ND-CP (dated June 26, 2026), which influences contracting routes for renewable generators and, in turn, EPC packaging and offtake structures.
Value Chain Analysis
The value chain for power generation EPC in Southeast Asia typically starts with project origination (utilities, independent power producers, and government planners), then moves through feasibility and permitting, financing, EPC contracting, equipment procurement, construction, commissioning, and long-term operations support. Large projects often use consortium structures that combine international OEMs and EPC capability with local engineering and construction partners, including Vietnam's O Mon IV project, where Petrovietnam finalized an EPC contract with a Doosan Enerbility and PECC2 joint venture (June 2025), followed by Mitsubishi Power supplying key gas turbine equipment (September 2025).
On the supply side, the chain covers OEMs (gas turbines, boilers, generators), balance-of-plant suppliers, civil and electrical contractors, and specialized logistics providers. Grid and interconnection build-outs add further tiers, including high-voltage transformers, switchgear, HVDC cables and converters, and cable-laying vessels, where reported shortages and extended lead times create procurement risk and scheduling pressure for EPC contractors. Owners and EPCs also coordinate around integration requirements (frequency and interoperability) for cross-border power trade, which can shift scope toward HVDC and control-system packages and increase reliance on a narrow set of qualified suppliers.
Competitive Landscape
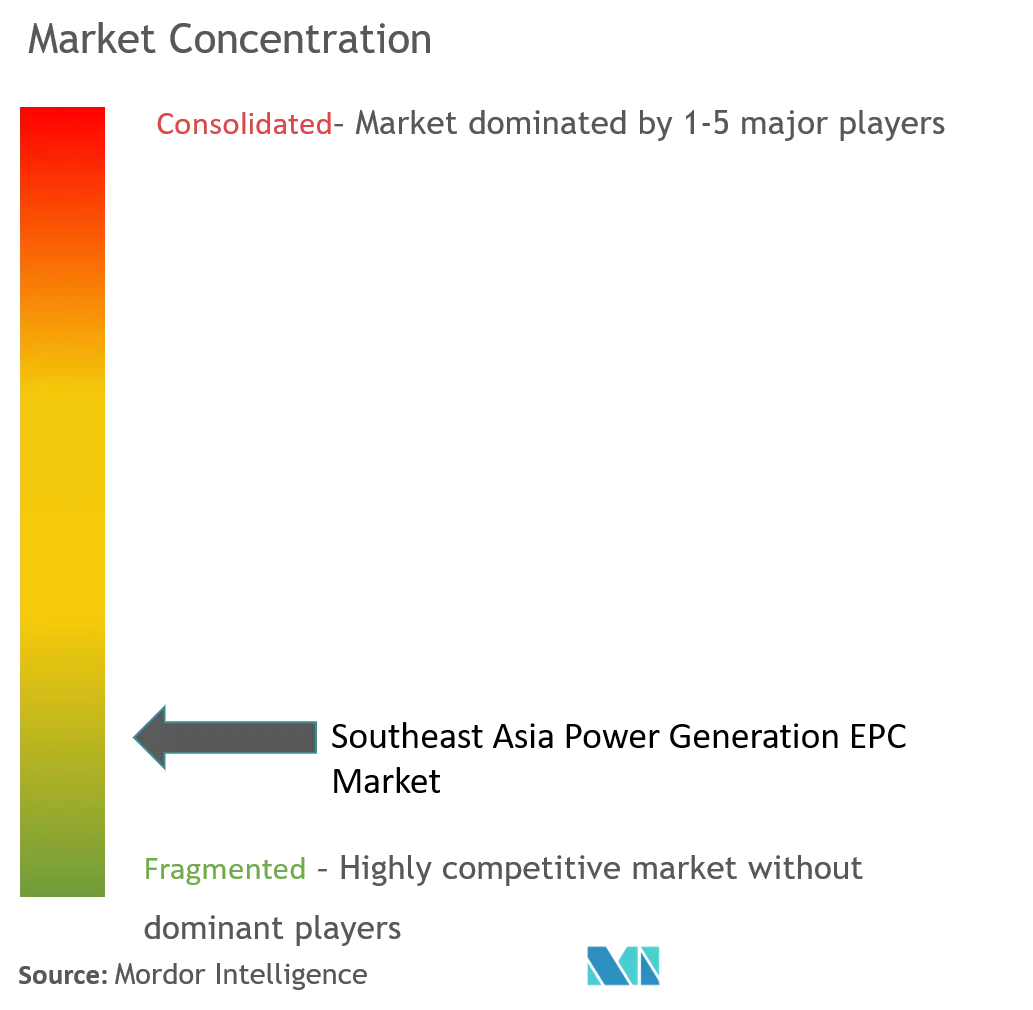
The Southeast Asia power generation EPC power market is moderately fragmented. Some of the major companies include Mitsubishi Heavy Industries Ltd, Hyundai Engineering Co. Ltd, Sumitomo Corporation, Poyry PLC, and Indika Energy.
Southeast Asia Power Generation EPC Industry Leaders
-
Sumitomo Corporation
-
Poyry PLC
-
Indika Energy
-
Mitsubishi Heavy Industries, Ltd.
-
Hyundai Engineering Co., Ltd.
- *Disclaimer: Major Players sorted in no particular order
Market Opportunities and Future Outlook
Utility-scale gas-to-power and LNG-linked combined-cycle projects are expanding EPC contract pools, especially where governments and utilities move from planning to awards. In Vietnam, Vietnam Electricity (EVN) signed a USD 962 million EPC contract in February 2026 for the 1,612 MW Quang Trach II LNG power project with a consortium led by PowerChina and Lilama, and GE Vernova later secured an order (June 2026) to supply major turbomachinery for the same project. Together, these awards reinforce a pipeline of large, EPC-led thermal additions with substantial balance-of-plant and grid-connection scope.
Renewables EPC opportunities are also moving beyond standalone generation into hybrid configurations that combine solar and storage, which increases engineering complexity and total scope per project. In the Philippines, Levanta Renewables signed an EPC contract (April 2026) with China Energy Engineering Group for a 166 MWp solar facility paired with an 80 MWh battery energy storage system, reflecting a shift toward firming and grid-support features. In parallel, the Enhanced ASEAN Power Grid agenda is producing concrete workstreams, with APG Task Forces convening in April 2026 to refine workplans and technical mapping, and the Asian Development Bank establishing a Regional Connectivity Fund for Energy in Southeast Asia (April 2026) under the ASEAN Infrastructure Fund. These steps support multi-country transmission and interconnection programs that broaden the EPC addressable market into high-voltage substations, interties, and cross-border infrastructure enabling multilateral power trade.
Recent Industry Developments
- June 2026: A consortium led by Sumitomo Corporation and Hitachi Zosen Corporation signed an amended public-private partnership agreement to advance the Legok Nangka regional waste-to-energy project in West Java, Indonesia. The agreement supports a municipality-linked generation project type that typically requires integrated EPC across waste processing, power island, and grid connection, extending demand beyond conventional thermal EPC.
- October 2025: Meralco PowerGen selected a consortium of Mitsubishi Power and Jurong Engineering Limited to develop a 670 MW hydrogen-ready combined-cycle gas turbine facility in Singapore. The selection highlights continued investment in high-efficiency gas generation and adds EPC scope tied to hydrogen-ready specifications, integration, and future fuel-flexibility requirements.
- August 2024: Mitsubishi Power received an order to supply an M701F gas turbine and a steam turbine for a 500 MW combined-cycle power plant in Miri, Sarawak, Malaysia. The order supports the regional CCGT project pipeline and shows how OEM-led equipment packages can shape EPC schedules, integration work, and long-term service arrangements.
Research Methodology Framework and Report Scope
Market Definition and Coverage
This methodology covers revenues from engineering, procurement, and construction work delivered for power generation projects across Southeast Asia, where contractors are paid to design, source major equipment, and build plants up to commissioning.
Scope exclusions: We exclude pure operations and maintenance-only contracts, fuel supply and trading, and power transmission and distribution EPC unless it is bundled inside a generation project award.
Segmentation Overview
- Source
- Conventional Thermal Power
- Renewables Power
- Nuclear Power
- Geography
- Indonesia
- Thailand
- Malaysia
- Vietnam
- Philippines
- Rest of Southeast Asia
Data Sources, Market Sizing, and Validation
Desk Research
Desk research was used to set the project pipeline and demand context for EPC activity across Southeast Asia, and then to ground the model in consistent public time series. We typically referenced sources such as IEA and IRENA statistics, ASEAN energy publications, national energy ministries and regulators, and utility planning documents that disclose upcoming capacity additions.
To translate pipeline into an EPC value pool, we also reviewed tender portals and public procurement notices, customs and trade statistics for large power equipment categories, and audited filings and investor presentations of listed contractors and equipment suppliers. A paid subscription for company financials and intelligence was used selectively to standardize revenue splits and to avoid double counting consortium awards. This list of sources is not exhaustive, and other public documents were checked to collect data, validate assumptions, and clarify where disclosures were limited.
Primary Interviews and Surveys
Primary interviews focused on what gets booked as EPC revenue in this region, and how contract structures shift pricing and timing from award to commissioning. We spoke with EPC contractors, developers, utilities, lenders, and engineering consultants across the covered countries, and then reconciled inputs to align assumptions on cost-per-MW ranges, localization factors, and schedule slippages.
Distribution of primary research fieldwork respondents
| Company type | Respondent position |
|---|---|
| Top tier: 37% | CXOs: 15% |
| Mid tier: 42% | Functional/Unit leaders: 32% |
| Smaller Players: 21% | Managers: 53% |
Market-Sizing & Forecasting
Our sizing starts with a top-down build where planned and under-construction generation additions by country and technology are converted into an EPC spend pool using typical cost-per-MW bands and an observed split of equipment versus civil, electrical, and installation works. We then check totals with selective bottom-up approximations, such as roll-ups of announced contract awards, sampled project cost benchmarks, and channel checks on turbine, boiler, solar, and balance-of-plant demand patterns.
Key inputs used in the model include annual capacity additions (MW), the thermal versus renewable share shift, project size mix and build timelines, local content and import reliance signals, and typical contract packaging for EPC versus EPCM. For forecasting, scenario analysis was used around policy-driven renewables targets, grid reliability needs that influence gas additions, and expected financing conditions, and then the final trajectory was aligned to expert consensus from interviews. Where award disclosure is limited, gaps were handled by applying conservative conversion factors from pipeline stages to financial close, followed by an adjustment based on recent award-to-commissioning lags in the region.
Data Validation & Update Cycle
Model outputs were cross-checked against independent signals like country power development plans, tender volumes, and the direction of major equipment imports, and then inconsistencies were reviewed before sign-off. If a country total moved sharply without a clear pipeline driver, we revisited the underlying cost-per-MW bands and the assumed timing of large projects, and then sources were re-contacted when needed.
Each report is refreshed on an annual cycle, and interim updates are made when material project awards, cancellations, or policy shifts occur. Before delivery, a final analyst pass is completed so clients receive the most current assumptions and the latest validated market view.
Mordor Intelligence's South East Asia Power Generation Epc Market Size Compared With Other Published Estimates
Published market sizes for power generation EPC in Southeast Asia often do not match because groups count different project types, years, and contract scopes, and then convert local currencies to USD using different timing. Even when the same geography is used, the treatment of bundled owner-supplied equipment, limited notice-to-proceed visibility, and EPCM-only contracts can change the value materially.
Tender calendars, capacity-addition targets in national power plans, and a cross-check of large project award disclosures are the evidence used to keep Mordor Intelligence tied to the regionally observable EPC award pipeline, and the same checks are also used to filter out work that sits outside generation EPC, like standalone transmission build-outs.
Benchmark comparison
| Source | Market Size | Gaps in Research Methodology |
|---|---|---|
| Mordor Intelligence | USD 16.20 B (2026) | |
| Global Consultancy A | USD 18.75 B (2026) | This estimate appears to apply a wider contract definition that can count EPCM and a larger share of balance-of-plant works, and it also assumes faster pipeline-to-revenue conversion for multi-year projects. |
| Industry Publisher B | USD 14.50 B (2023) | This number is anchored to an earlier base year and may reflect a narrower set of disclosed projects, with fewer adjustments for delays and re-scoping in large thermal and hydro awards. |
Overall, the spread is mainly driven by contract scope boundaries, base-year timing, and how multi-year project revenue is recognized. By anchoring assumptions to country plan additions and award visibility, and then sanity-checking totals with sampled cost-per-MW ranges, the output stays traceable to clear inputs and repeatable steps.
Key Questions Answered in the Report
What is the current Southeast Asia Power Generation EPC Market size?
The Southeast Asia Power Generation EPC Market is projected to register a CAGR of 6.93% during the forecast period (2026-2031)
Who are the key players in Southeast Asia Power Generation EPC Market?
Sumitomo Corporation, Poyry PLC, Indika Energy, Mitsubishi Heavy Industries, Ltd. and Hyundai Engineering Co., Ltd. are the major companies operating in the Southeast Asia Power Generation EPC Market.
What years does this Southeast Asia Power Generation EPC Market cover?
The report covers the Southeast Asia Power Generation EPC Market historical market size for years: 2021, 2022, 2023, 2024 and 2025. The report also forecasts the Southeast Asia Power Generation EPC Market size for years: 2026, 2027, 2028, 2029, 2030 and 2031.