Market Overview
| Study Period | 2021 - 2031 |
|---|---|
| Forecast Data Period | 2026 - 2031 |
| Historical Data Period | 2021 - 2024 |
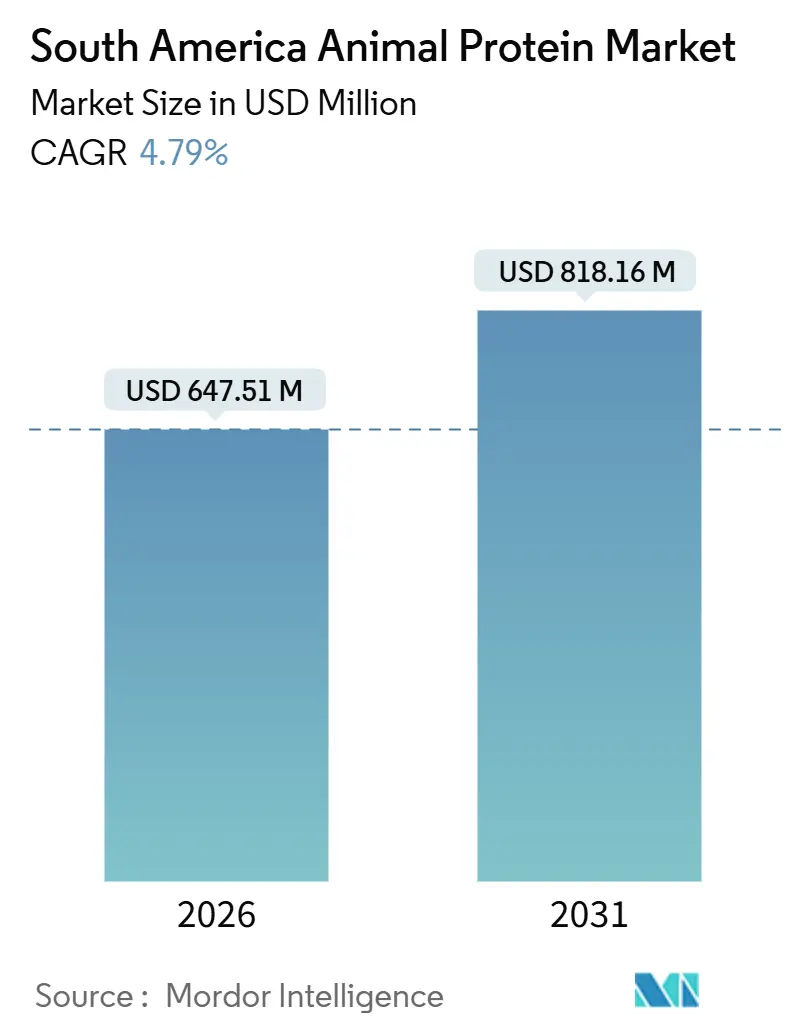
| Market Size (2026) | USD 647.51 Million |
| Market Size (2031) | USD 818.16 Million |
| Growth Rate (2026 - 2031) | 4.79% CAGR |
| Market Concentration | Medium |
Major Players
*Disclaimer: Major Players sorted in no particular order Image © Mordor Intelligence. Reuse requires attribution under CC BY 4.0. |
|
South America Animal Protein Market Analysis by Mordor Intelligence
The South America animal protein market is expected to grow from USD 647.51 million in 2026 to USD 818.16 million by 2031, with a compound annual growth rate (CAGR) of 4.79% during the forecast period. This growth is driven by the region's role as both a major consumer and exporter of animal protein products. Processors in the dairy, meat, and aquaculture industries are utilizing surplus raw materials to produce value-added products such as whey, casein, collagen, gelatin, and egg-based ingredients. Brazil leads the market due to its well-established and vertically integrated poultry, beef, and dairy supply chains, which ensure consistent product quality at competitive prices. Meanwhile, Chile is experiencing the fastest growth in the region, as its protein shortages are driving up import demand. The market remains moderately fragmented, with opportunities for growth driven by innovation and increasing demand for high-quality animal protein products.
Key Report Takeaways
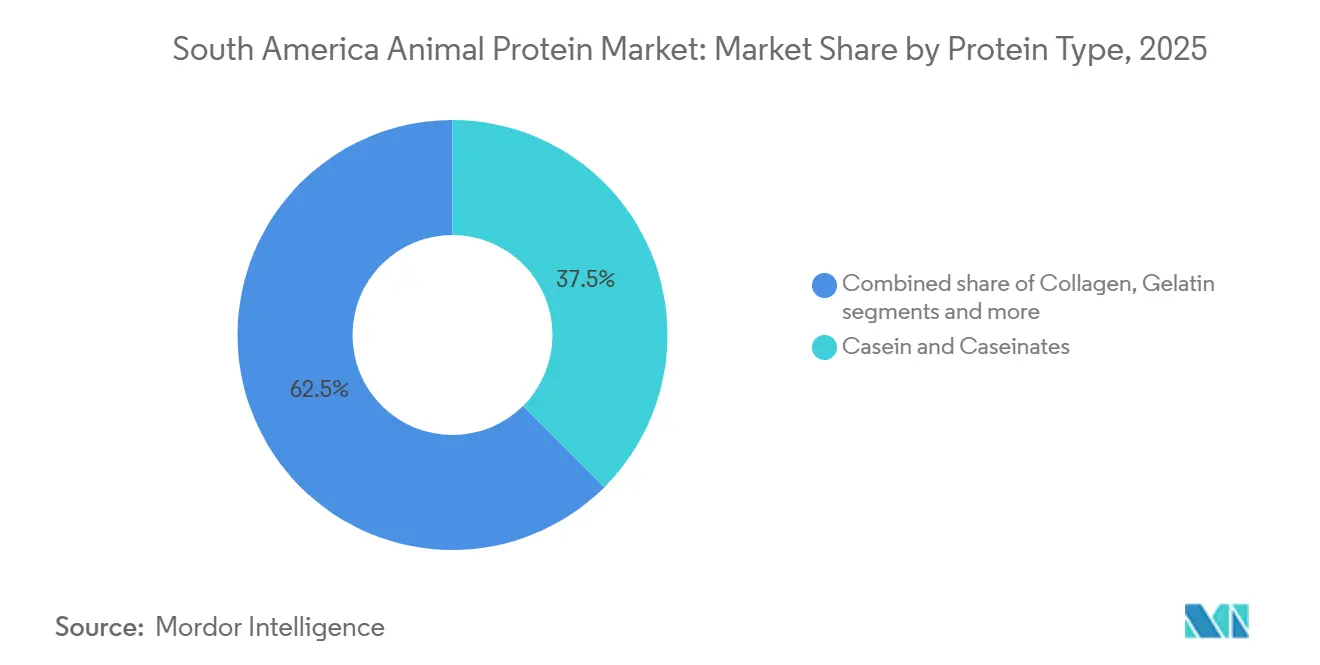
- By protein type, casein and caseinates held 37.54% of the South America animal protein market share in 2025, whereas collagen is advancing at a 5.46% CAGR through 2031.
- By category, conventional products commanded 85.25% of the South American animal protein market in 2025, yet the organic segment is expanding at a 6.43% CAGR through 2031.
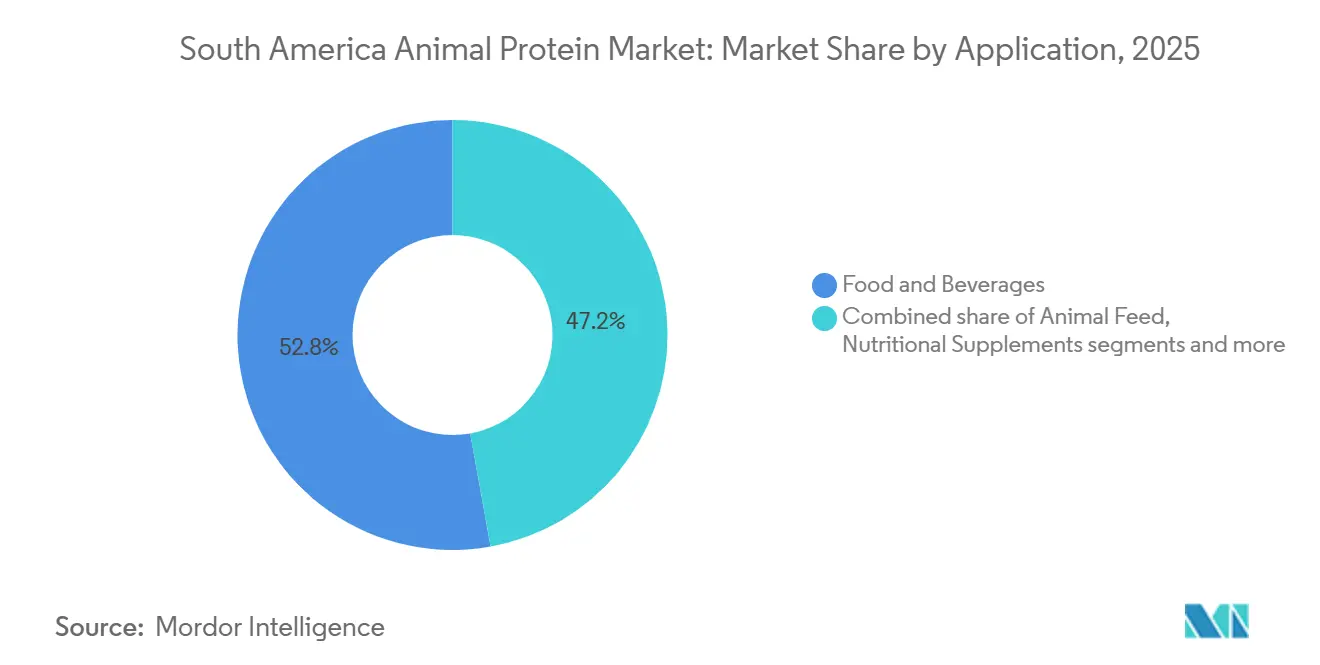
- By application, food and beverages led with a 52.83% share of the South American animal protein market in 2025; personal care and cosmetics are growing fastest at a 6.44% CAGR to 2031.
- By country, Brazil accounted for 55.63% of South America animal protein market share in 2025, while Chile is projected to log a 5.17% CAGR between 2026 and 2031.
Note: Market size and forecast figures in this report are generated using Mordor Intelligence’s proprietary estimation framework, updated with the latest available data and insights as of January 2026.
South America Animal Protein Market Trends and Insights
Drivers Impact Analysis*
| Driver | (~) % Impact on CAGR Forecast | Geographic Relevance | Impact Timeline |
|---|---|---|---|
| Rising health and nutrition awareness encouraging higher protein intake | +1.2% | Brazil, Argentina, Chile—urban centers leading adoption | Medium term (2-4 years) |
| Increasing use of animal protein in processed foods, snacks, and ready meals | +1.0% | Brazil core, spill-over to Colombia and Peru | Medium term (2-4 years) |
| Growing demand for processed and value-added meat products | +0.8% | Brazil, Argentina—export-oriented processors | Long term (≥ 4 years) |
| Rising consumption of affordable protein sources such as poultry and eggs | +0.9% | Regional—Colombia, Peru showing fastest per-capita gains | Short term (≤ 2 years) |
| Rising demand for animal protein ingredients in pet food and animal nutrition | +0.7% | Brazil dominant, Chile and Argentina emerging | Medium term (2-4 years) |
| Technological advancements in breeding, animal health, and feed efficiency | +0.6% | Brazil, Argentina—large-scale integrators | Long term (≥ 4 years) |
| Source: Mordor Intelligence | |||


Rising health and nutrition awareness is encouraging higher protein intake
Awareness of health and nutrition is growing across South America, leading to increased protein consumption, especially from affordable animal-based sources. Eggs are gaining popularity as a natural, nutrient-rich protein source. According to the Incredible Egg Organization, a single large egg provides six grams of high-quality protein and eight essential nutrients, all for just 70 calories[1]Source: Incredible Egg Organization, "Egg Nutrition", incredibleegg.org. This makes eggs an attractive choice for consumers. In countries like Argentina and Brazil, eggs are a staple food consumed by people across various income levels. Urban consumers are increasingly incorporating protein-enriched snacks, drinks, and supplements into their diets as part of their active and health-conscious lifestyles. This trend is driving consistent demand for animal proteins across both retail outlets and institutional markets, ensuring steady growth in consumption.
Increasing use of animal protein in processed foods, snacks, and ready meals
Animal protein is increasingly used in processed foods, snacks, and ready-to-eat meals in Brazil, driven by changing eating habits. According to a 2024 dietary survey in PubMed Central, the most common eating patterns in Brazil include three main meals with one snack (25.1%) and three main meals with two snacks (24.6%)[2]Source: PubMed Central, "How many meals and snacks do Brazilians eat a day?", pmc.ncbi.nlm.nih.gov. This indicates a growing preference for convenient, protein-rich food options. To meet this demand, food manufacturers are adding ingredients such as whey proteins, caseinates, and collagen to products including ready meals, snack bars, soups, and functional snacks. This trend reflects a shift toward more frequent snacking and the need for easy-to-prepare meals, driving the use of animal protein beyond just sports nutrition and into everyday grocery items and mainstream food products.
Rising consumption of affordable protein sources such as poultry and eggs
The demand for affordable protein sources like poultry and eggs is steadily increasing across South America, driven by their cost-effectiveness and nutritional value. With beef prices fluctuating, many households are turning to chicken and eggs as reliable and budget-friendly alternatives. For instance, in 2024, Chile imported eggs worth USD 11.8 million, making it the 63rd-largest egg importer globally, according to the Observatory of Economic Complexity[3]Source: Observatory of Economic Complexity, "Egg in Chile", oec.world. This shift highlights the growing reliance on these protein sources. Advancements in poultry farming, such as improved genetics, enhanced feed enzymes, and improved farm efficiency, are helping producers manage costs more effectively. These developments ensure that poultry and eggs remain the most accessible and affordable animal protein options for consumers in the region, catering to income groups and dietary needs.
Rising demand for animal protein ingredients in pet food and animal nutrition
The demand for animal protein ingredients in pet food and animal nutrition is opening up significant growth opportunities in South America. Pet owners are increasingly choosing high-quality pet food that focuses on better digestion and muscle health. This has led to a rise in the use of animal-based proteins, such as poultry meal and collagen peptides, replacing cheaper cereal-based fillers. This trend is particularly noticeable in Brazil, where the pet-care market is expanding rapidly. Livestock and aquaculture producers are turning to advanced protein ingredients and functional feeds to enhance animal growth, improve disease resilience, and increase feed efficiency. Together, these factors are driving demand for animal protein ingredients across both pet food and farm animal nutrition. This growing and diverse demand is helping suppliers of animal protein ingredients expand their applications and maintain steady revenue streams in the region.
Restraints Impact Analysis*
| Restraint | (~) % Impact on CAGR Forecast | Geographic Relevance | Impact Timeline |
|---|---|---|---|
| High exposure to animal disease outbreaks such as avian influenza and foot-and-mouth disease | -0.9% | Argentina, Brazil (HPAI in wild birds), Chile (Highly Pathogenic Avian Influenza (HPAI) in marine mammals) | Short term (≤ 2 years) |
| Rising pressure from plant-based and alternative proteins | -0.6% | Brazil urban centers, Chile Santiago metro, Argentina Buenos Aires | Medium term (2-4 years) |
| Increasing compliance costs related to food safety, animal welfare, and sustainability standards | -0.5% | Brazil, Argentina—export-oriented producers facing European Union regulations | Long term (≥ 4 years) |
| Water scarcity and climate variability impacting livestock productivity | -0.7% | Brazil Cerrado and Northeast, Argentina Pampas, Chile Central Valley | Medium term (2-4 years) |
| Source: Mordor Intelligence | |||
Rising pressure from plant-based and alternative proteins
The growing popularity of plant-based and alternative proteins is creating challenges for the animal protein market in South America, especially in Brazil. More consumers are cutting back on meat consumption due to concerns about health, ethics, and the environment. According to a study published in ScienceDirect in March 2025, 27% of individuals surveyed in Brazil followed a vegetarian diet[4]Source: ScienceDirect, "Drivers and Barriers to Adopting Sustainable Eating Habits in Brazil", sciencedirect.com. This trend is driving higher demand for plant-based and hybrid protein products, intensifying competition with traditional animal protein producers. As a result, these producers are facing pressure on profit margins and are being pushed to adapt. To stay competitive, they are investing in sustainability practices, cleaner product labeling, and the development of blended formulations combining animal and plant-based proteins. These efforts aim to maintain their relevance and protect their market share in a rapidly changing consumer landscape.
Increasing compliance costs related to food safety, animal welfare, and sustainability standards
Rising compliance costs related to food safety, animal welfare, and sustainability standards are creating challenges for the animal protein market in South America. Governments and retailers are implementing stricter rules on areas such as product traceability, the use of antibiotics, emissions control, and animal welfare practices. These regulations are increasing the expenses associated with operations and certifications for producers and processors. Smaller and mid-sized suppliers are particularly affected, as they often lack the financial resources to invest in necessary upgrades like audits, monitoring systems, and facility improvements. While these measures aim to enhance the market's credibility and improve access to export opportunities in the long term, they are currently adding significant cost pressures. This is impacting profit margins across the entire animal protein value chain, making it harder for smaller players to compete effectively.
*Our forecasts treat driver/restraint impacts as directional, not additive. The impact forecasts reflect baseline growth, mix effects, and variable interactions.
Segment Analysis
By Protein Type: Collagen Gains on Beauty and Joint Health
Casein and caseinates accounted for 37.54% of the South American animal protein market in 2025, making them the largest segment by value. This dominance is due to the extensive dairy farming and milk-processing facilities in countries like Argentina and Brazil, which enable consistent production of casein-based ingredients. These proteins are widely used in industries such as cheese production, bakery, beverages, and sports nutrition, ensuring steady demand. The segment benefits from reliable supply chains and established industrial applications across the region, further solidifying its position.
Collagen is the fastest-growing protein segment, with a projected CAGR of 5.46% between 2026 and 2031. This growth is fueled by increasing use in dietary supplements, functional foods, beauty-enhancing products, and pet nutrition. Consumers are becoming more aware of collagen’s benefits, such as improving joint health, skin elasticity, and recovery, which is driving its popularity. Furthermore, innovations in hydrolyzed collagen and user-friendly formats are making it more accessible, contributing to its rapid adoption across South America.


By Category: Organic Certification Drives Premium Growth
Conventional animal protein products held the largest share of the South American animal protein market in 2025, accounting for 85.25% of the total market. This is mainly due to the use of efficient feed and farming systems that rely on high-yield crops like corn and soy, which help large producers keep costs low. Conventional animal protein benefits from well-established supply chains, widespread availability in retail stores, and competitive pricing. These factors make it the most popular choice for consumers across various income levels in the region.
On the other hand, organic animal protein is a smaller segment but is growing quickly, with a projected CAGR of 6.43% through 2031. This growth is driven by increasing consumer interest in clean-label products, ethical animal treatment, and sustainable farming methods. Urban and higher-income consumers are willing to pay more for certified organic meat, dairy, and protein products. As certification processes improve and distribution networks expand, organic animal protein is becoming more accessible despite its higher production costs and is gaining popularity among health-conscious buyers.
By Application: Personal Care Outpaces Traditional Food Uses
The food and beverage sector holds the largest share in the South America animal protein market, accounting for 52.83% of the total market share in 2025. This dominance is due to the growing use of animal proteins, such as whey, casein, and egg-derived proteins, in products like dairy beverages, baked goods, snacks, and ready-to-eat meals. These proteins not only improve the nutritional value of food but also provide functional benefits, such as improved texture, enhanced emulsification, and greater satiety. As a result, animal proteins have become a key ingredient in everyday food products, driving consistent demand across the region.
The personal care and cosmetics sector is emerging as a rapidly growing application area, with a projected CAGR of 6.44% through 2031. Ingredients such as collagen, gelatin, and milk proteins are being increasingly incorporated into skincare, haircare, and nutricosmetic products due to their benefits, including hydration, strengthening, and anti-aging properties. The rising popularity of beauty-from-within concepts and premium personal care products is further boosting demand for these proteins. This trend is expanding the use of animal protein ingredients beyond food applications, creating new growth opportunities in the cosmetics industry.
Geography Analysis
Brazil is the largest contributor to the South America animal protein market, accounting for 55.63% of the regional market share. This strong position is due to its advanced poultry, dairy, and feed-grain industries, which allow for cost-effective production and robust export capabilities. Brazil has a high domestic demand for animal protein, driven by its growing food processing industry, increasing focus on nutrition, and expanding pet food sector. Over the forecast period, Brazil is expected to retain its leading position, with its growth rate closely following the regional average.
Although smaller in market size, Chile is one of the fastest-growing markets in South America, with a projected CAGR of 5.17% over the forecast period. The country relies heavily on imports of milk proteins and egg-based ingredients because of its limited domestic dairy production. However, innovations in aquaculture and functional nutrition are driving growth, as urban consumers increasingly prefer products like collagen-enriched foods and beverages. These developments make Chile a promising market with significant growth potential, even though its overall market size is smaller than that of other countries in the region.
Colombia, Peru, and Argentina together make up the remaining share of the South America animal protein market, each offering unique contributions. Colombia's poultry industry plays a key role in meeting local demand and supporting regional trade. Peru is a major player in marine protein and fishmeal production, which are essential components of the protein supply chain. Argentina, known for its dairy and beef production, faces challenges such as climate issues and trade restrictions that impact its growth. Despite these challenges, these markets are expected to grow steadily, supported by improvements in production efficiency and a gradual shift toward higher-value protein products.
Competitive Landscape
The South American animal protein market is moderately fragmented, with large multinational dairy companies like Fonterra, Glanbia, and Arla Foods leading in the production of high-quality whey and caseinate proteins, which are essential for nutrition and infant formula. At the same time, regional suppliers play a significant role by catering to both local and export markets with standard and specialized protein products. This combination of global and regional players creates a competitive environment across various product categories, ensuring diverse options for consumers and businesses.
Regional producers, particularly in Brazil, benefit from their proximity to major livestock and dairy hubs, which helps reduce raw material costs and improves supply chain efficiency. These advantages allow them to respond quickly to customer demands. In the collagen and gelatin segments, global companies dominate the premium market, supplying high-value products for pharmaceutical, nutraceutical, and beauty applications. Their expertise in advanced formulations and applications makes it challenging for new players to enter these high-end segments, maintaining their stronghold in the market.
The future of the market is increasingly driven by innovation and scalability rather than just production volume. Opportunities are growing in areas like alternative proteins, precision fermentation, and advanced feed solutions, especially for aquaculture and animal nutrition. The adoption of technologies such as genomic selection, AI-based farm management, and digital traceability systems is helping suppliers meet stricter regulatory requirements while commanding higher prices. Rising costs for compliance and certifications are also pushing the market toward consolidation, favoring vertically integrated companies that manage the entire supply chain, from breeding and feed production to processing and ingredient extraction.
South America Animal Protein Industry Leaders
-
Arla Foods amba
-
Darling Ingredients Inc.
-
GELITA AG
-
Wilmar International
-
Hilmar Cheese Company Inc.
- *Disclaimer: Major Players sorted in no particular order

Recent Industry Developments
- December 2025: Brazil’s MAPA approved Lacprodan MFGM-10 for use in foods and beverages containing whey protein, which represented a significant milestone in Arla Foods Ingredients’ efforts to expand into the Brazilian market.
- September 2025: Nestlé Brasil announced plans to invest BRL 1 billion by 2028 to expand and modernize its instant coffee factory in Araras, São Paulo. This initiative represented the largest investment among the company’s 18 operational units in Brazil. The investment was part of a broader BRL 7 billion package allocated for the period 2025-2028. Additionally, the company aimed to strengthen its production capabilities for various dairy products, including prato and mozzarella cheeses, whey protein, butter, cream cheese, and dairy blends, across its facilities in Ijuí, Teutônia, Santa Rosa, and Três de Maio.
- January 2025: Piracanjuba announced an investment of BRL 499 million to establish a new whey protein and dairy processing facility in Brazil. This initiative aimed to significantly enhance the country's domestic whey production capacity to address the growing demand for high-quality dairy products.


South America Animal Protein Market Report Scope
The South American animal protein market is segmented by protein type, category, application, and country. Based on protein type, the market is classified into casein and caseinates, collagen, egg protein, gelatin, insect protein, milk protein, whey protein, and others. Based on category, the market is classified into organic and conventional. Based on application, the market is classified into animal feed, personal care and cosmetics, food and beverages, and nutritional supplements. By country, the market covers Argentina, Brazil, Colombia, Chile, Peru, and the Rest of South America. The market forecasts are provided in terms of value (USD).
By Protein Type
| Casein and Caseinates |
| Collagen |
| Egg Protein |
| Gelatin |
| Insect Protein |
| Milk Protein |
| Whey Protein |
| Others |
By Category
| Organic |
| Conventional |
By Application
| Animal Feed | |
| Personal Care and Cosmetics | |
| Food and Beverages | Bakery |
| Beverages | |
| Breakfast Cereals | |
| Condiments/Sauces | |
| Confectionery | |
| Dairy and Dairy Alternatives Products | |
| RTE/RTC Food Products | |
| Snacks | |
| Nutritional Supplements | Baby Food and Infant Nutrition |
| Elderly and Medical Nutrition | |
| Sporta/Performance Nutrition |
By Country
| Brazil |
| Colombia |
| Chile |
| Peru |
| Argentina |
| Rest of South America |
| By Protein Type | Casein and Caseinates | |
| Collagen | ||
| Egg Protein | ||
| Gelatin | ||
| Insect Protein | ||
| Milk Protein | ||
| Whey Protein | ||
| Others | ||
| By Category | Organic | |
| Conventional | ||
| By Application | Animal Feed | |
| Personal Care and Cosmetics | ||
| Food and Beverages | Bakery | |
| Beverages | ||
| Breakfast Cereals | ||
| Condiments/Sauces | ||
| Confectionery | ||
| Dairy and Dairy Alternatives Products | ||
| RTE/RTC Food Products | ||
| Snacks | ||
| Nutritional Supplements | Baby Food and Infant Nutrition | |
| Elderly and Medical Nutrition | ||
| Sporta/Performance Nutrition | ||
| By Country | Brazil | |
| Colombia | ||
| Chile | ||
| Peru | ||
| Argentina | ||
| Rest of South America | ||


Market Definition
- End User - The Protein Ingredients Market operates on a B2B basis. Food, Beverages, Supplements, Animal Feed, and Personal Care & Cosmetic manufacturers are considered to be end-consumers in the market studied. The scope excludes manufacturers buying liquid/dry whey to be used for application as a binding agent or thickener or other non-protein applications.
- Penetration Rate - Penetration Rate is defined as the percentage of Protein-Fortified End User Market Volume in the Overall End User Market Volume.
- Average Protein Content - Average protein content is the average protein content present per 100 g of product manufactured by all end-user companies considered under the scope of this report.
- End User Market Volume - End-user market volume is the consolidated volume of all types and forms of end-user products in the country or region.
| Keyword | Definition |
|---|---|
| Alpha-lactalbumin (α-Lactalbumin) | It is a protein that regulates the production of lactose in the milk of almost all mammalian species. |
| Amino acid | It is an organic compound that contains both amino and carboxylic acid functional groups, which are required for the synthesis of body protein and other important nitrogen-containing compounds, such as creatine, peptide hormones, and some neurotransmitters. |
| Blanching | It is the process of briefly heating vegetables with steam or boiling water. |
| BRC | British Retail Consortium |
| Bread improver | It is a flour-based blend of several components with specific functional properties designed to modify dough characteristics and give quality attributes to bread. |
| BSF | Black Soldier Fly |
| Caseinate | It is a substance produced by adding an alkali to acid casein, a derivative of casein. |
| Celiac disease | Celiac disease is an immune reaction to eating gluten, a protein found in wheat, barley, and rye. |
| Colostrum | It is a milky fluid that’s released by mammals that have recently given birth before breast milk production begins. |
| Concentrate | It is the least processed form of protein and has a protein content ranging from 40-90% by weight. |
| Dry protein basis | It refers to the percentage of "pure protein" present in a supplement after the water in it is completely removed through heat. |
| Dry whey | It is the product resulting from drying fresh whey which has been pasteurized and to which nothing has been added as a preservative. |
| Egg protein | It is a mixture of individual proteins, including ovalbumin, ovomucoid, ovoglobulin, conalbumin, vitellin, and vitellenin. |
| Emulsifier | It is a food additive that facilitates the blending of foods that are immiscible with one another, such as oil and water. |
| Enrichment | It is the process of addition of micronutrients that are lost during the processing of the product. |
| ERS | Economic Research Service of the USDA |
| Extrusion | It is the process of forcing soft mixed ingredients through an opening in a perforated plate or die designed to produce the required shape. The extruded food is then cut to a specific size by blades. |
| Fava | Also known as Faba, it is another word for yellow split beans. |
| FDA | Food and Drug Administration |
| Flaking | It is a process in which typically a cereal grain (like corn, wheat, or rice) is broken down into grits, cooked with flavors and syrups, and then pressed into flakes between cooled rollers. |
| Foaming agent | It is a food ingredient that makes it possible to form or maintain a uniform dispersion of a gaseous phase in a liquid or solid food. |
| Foodservice | It refers to the part of the food industry which includes businesses, institutions, and companies which prepare meals outside the home. It includes restaurants, school and hospital cafeterias, catering operations, and many other formats. |
| Fortification | It is the deliberate addition of micronutrients that are not found in them naturally or which are lost during processing, to improve a food product's nutritional value. |
| FSANZ | Food Standards Australia New Zealand |
| FSIS | Food Safety and Inspection Service |
| FSSAI | Food Safety and Standards Authority of India |
| Gelling agent | It is an ingredient that functions as a stabilizer and thickener to provide thickening without stiffness through the formation of gel. |
| GHG | Greenhouse Gas |
| Gluten | It is a family of proteins found in grains, including wheat, rye, spelt, and barley. |
| Hemp | It is a botanical class of Cannabis sativa cultivars grown specifically for industrial or medicinal use. |
| Hydrolysate | It is a form of protein manufactured by exposing the protein to enzymes that can partially break the bonds between the protein's amino acids and break down large, complicated proteins into smaller pieces. Its processing makes it easier and quicker to digest. |
| Hypoallergenic | It refers to a substance that causes fewer allergic reactions. |
| Isolate | It is the purest and most processed form of protein which has undergone separation to obtain a pure protein fraction. It typically contains ≥ 90% of protein by weight. |
| Keratin | It is a protein that helps form hair, nails, and the outer layer of skin. |
| Lactalbumin | It is the albumin contained in milk and obtained from whey. |
| Lactoferrin | It is an iron‑binding glycoprotein that is present in the milk of most mammals. |
| Lupin | It is the yellow legume seeds of the genus Lupinus. |
| Millenial | Also known as Generation Y or Gen Y, it refers to the people born from 1981 to 1996. |
| Monogastric | It refers to an animal with a single-compartmented stomach. Examples of monogastric include humans, poultry, pigs, horses, rabbits, dogs, and cats. Most monogastric are generally unable to digest much cellulose food materials such as grasses. |
| MPC | Milk protein concentrate |
| MPI | Milk protein isolate |
| MSPI | Methylated soy protein isolate |
| Mycoprotein | Mycoprotein is a form of single-cell protein, also known as fungal protein, derived from fungi for human consumption. |
| Nutricosmetics | It is a category of products and ingredients that act as nutritional supplements to care for skin, nails, and hair natural beauty. |
| Osteoporosis | It is a medical condition in which the bones become brittle and fragile from loss of tissue, typically as a result of hormonal changes, or deficiency of calcium or vitamin D. |
| PDCAAS | Protein digestibility-corrected amino acid score (PDCAAS) is a method of evaluating the quality of a protein based on both the amino acid requirements of humans and their ability to digest it. |
| Per-capita consumption of animal protein | It is the average amount of animal protein (such as milk, whey, gelatin, collagen, and egg proteins) that is readily available for consumption by each person in an actual population. |
| Per-capita consumption of plant protein | It is the average amount of plant protein (such as soy, wheat, pea, oat, and hemp proteins) that is readily available for consumption by each person in an actual population. |
| Quorn | It is a microbial protein manufactured using mycoprotein as an ingredient, in which the fungus culture is dried and mixed with egg albumen or potato protein, which acts as a binder, and then is adjusted in texture and pressed into various forms. |
| Ready-to-Cook (RTC) | It refers to food products that include all of the ingredients, where some preparation or cooking is required through a process that is given on the package. |
| Ready-to-Eat (RTE) | It refers to a food product prepared or cooked in advance, with no further cooking or preparation required before being eaten. |
| RTD | Ready-to-Drink |
| RTS | Ready-to-Serve |
| Saturated fat | It is a type of fat in which the fatty acid chains have all single bonds. It is generally considered unhealthy. |
| Sausage | It is a meat product made of finely chopped and seasoned meat, which may be fresh, smoked, or pickled and which is then usually stuffed into a casing. |
| Seitan | It is a plant-based meat substitute made out of wheat gluten. |
| Softgel | It is a gelatin-based capsule with a liquid fill. |
| SPC | Soy protein concentrate |
| SPI | Soy protein isolate |
| Spirulina | It is a biomass of cyanobacteria that can be consumed by humans and animals. |
| Stabilizer | It is an ingredient added to food products to help maintain or enhance their original texture, and physical and chemical characteristics. |
| Supplementation | It is the consumption or provision of concentrated sources of nutrients or other substances that are intended to supplement nutrients in the diet and is intended to correct nutritional deficiencies. |
| Texturant | It is a specific type of food ingredient that is used to control and alter the mouthfeel and texture of food and beverage products. |
| Thickener | It is an ingredient that is used to increase the viscosity of a liquid or dough and make it thicker, without substantially changing its other properties. |
| Trans fat | Also called trans-unsaturated fatty acids or trans fatty acids, it is a type of unsaturated fat that naturally occurs in small amounts in meat. |
| TSP | Textured soy protein |
| TVP | Textured vegetable protein |
| WPC | Whey protein concentrate |
| WPI | Whey protein isolate |


Research Methodology
Mordor Intelligence follows a four-step methodology in all our reports.
- Step-1: Identify Key Variables: The quantifiable key variables (industry and extraneous) pertaining to the specific product segment and country are selected from a group of relevant variables & factors based on desk research & literature review; along with primary expert inputs. These variables are further confirmed through regression modeling (wherever required).
- Step-2: Build a Market Model: In order to build a robust forecasting methodology, the variables and factors identified in Step-1 are tested against available historical market numbers. Through an iterative process, the variables required for market forecast are set and the model is built on the basis of these variables.
- Step-3: Validate and Finalize: In this important step, all market numbers, variables and analyst calls are validated through an extensive network of primary research experts from the market studied. The respondents are selected across levels and functions to generate a holistic picture of the market studied.
- Step-4: Research Outputs: Syndicated Reports, Custom Consulting Assignments, Databases & Subscription Platforms


