Market Overview
| Study Period | 2021 - 2031 |
|---|---|
| Forecast Data Period | 2025 - 2031 |
| Historical Data Period | 2021 - 2024 |
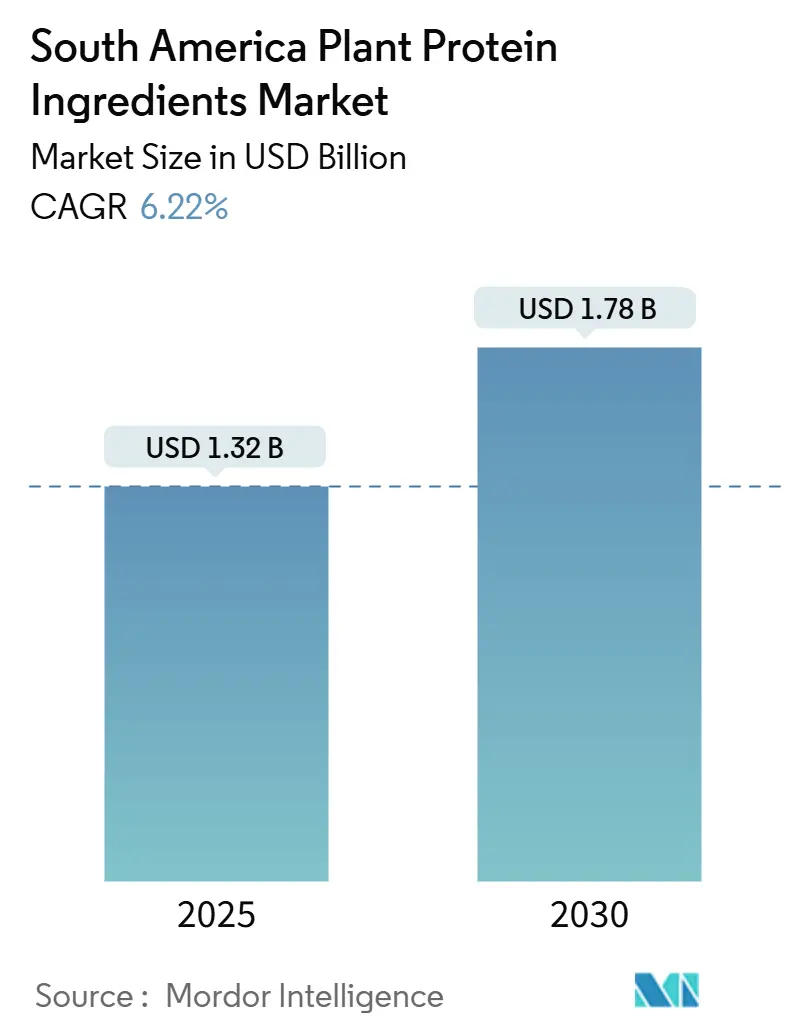
| Market Size (2026) | USD 1.32 Billion |
| Market Size (2031) | USD 1.78 Billion |
| Growth Rate (2025 - 2030) | 6.22% CAGR |
| Market Concentration | Medium |
Major Players
*Disclaimer: Major Players sorted in no particular order Image © Mordor Intelligence. Reuse requires attribution under CC BY 4.0. |
|
South America Plant Protein Ingredients Market Analysis by Mordor Intelligence
The South America plant protein ingredients market size is valued to be USD 1.32 billion in 2026 and is projected to touch USD 1.78 billion by 2031, translating into a 6.22% CAGR over the forecast period. Rising consumer interest in allergen-free nutrition, government backing for bioeconomy strategies, and processors’ shift from raw exports to value-added isolates have moved plant proteins from commodity status to a strategic growth engine. Brazil leverages its unrivaled soybean output to extend downstream into isolates and concentrates, while Argentina reduces export taxes on processed proteins to capture higher margins. Pea, rice, and other emerging sources gain traction as formulators hedge against soy allergen and GMO concerns. Food manufacturers focus on taste and texture improvements and on-pack sustainability claims to broaden adoption among flexitarian shoppers. Meanwhile, animal feed makers substitute fishmeal with local plant proteins to stabilize input costs and comply with export-market sustainability rules.
Key Report Takeaways
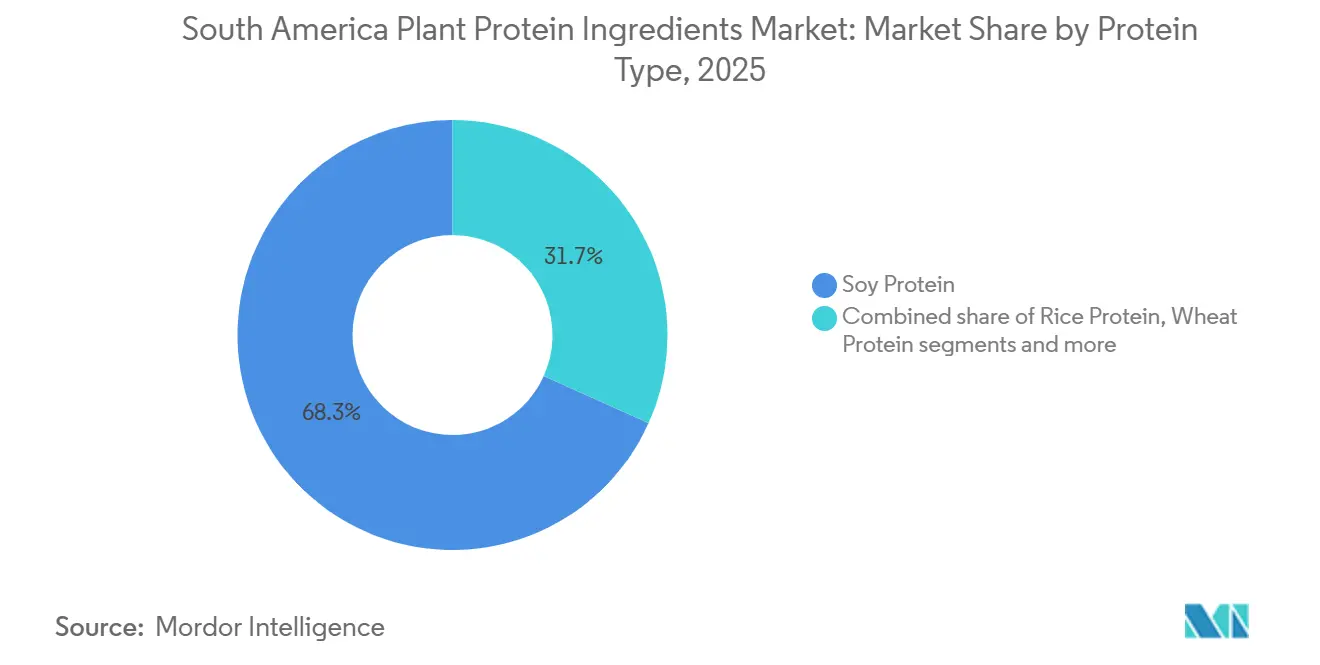
- By protein type, soy protein captured 68.28% of the South American plant protein ingredients market share in 2025, while pea protein is forecast to grow at 5.82% CAGR through 2031.
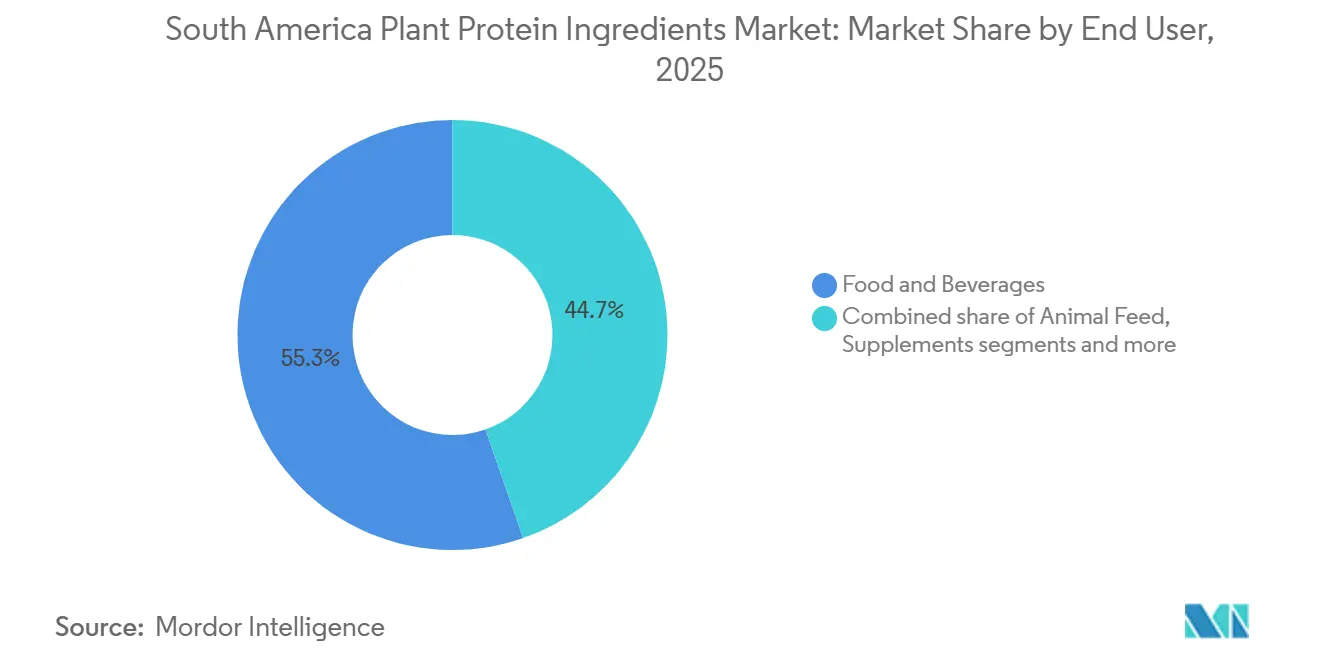
- By end use, the food and beverages segment commanded 55.34% of revenue in 2025, whereas animal feed is expected to expand at a 6.14% CAGR to 2031.
- By country, Brazil led with 61.59% volume share in 2025, and Argentina is projected to post a 6.02% CAGR during 2026-2031.
Note: Market size and forecast figures in this report are generated using Mordor Intelligence’s proprietary estimation framework, updated with the latest available data and insights as of January 2026.
South America Plant Protein Ingredients Market Trends and Insights
Drivers Impact Analysis*
| Driver | (~) % Impact on CAGR Forecast | Geographic Relevance | Impact Timeline |
|---|---|---|---|
| Rising vegan and flexitarian diets | +1.2% | Brazil urban centers, Chile, Colombia | Medium term (2-4 years) |
| Growing market demand for lactose-free protein alternatives | +0.9% | Brazil, Argentina, urban South America | Short term (≤ 2 years) |
| Sports and performance-nutrition boom | +1.4% | Brazil, Argentina, Chile metropolitan areas | Medium term (2-4 years) |
| Increasing demand for elderly nutrition driven by aging populations | +0.7% | Brazil, Argentina, Chile | Long term (≥ 4 years) |
| Clean-label trends prefer natural over synthetic ingredients | +1.0% | Chile, Colombia, Brazil premium segments | Medium term (2-4 years) |
| Environmental sustainability concerns reduce animal protein reliance | +0.8% | Brazil, Argentina with European Union export focus | Long term (≥ 4 years) |
| Source: Mordor Intelligence | |||


Rising vegan and flexitarian diets
Increasing consumer preference for vegan and flexitarian diets is significantly boosting the demand for plant-based alternatives, particularly soy protein ingredients, in South America. This shift is driven by growing health awareness, as consumers seek cholesterol-free options, and by the high prevalence of lactose intolerance in the region, which has heightened the need for dairy substitutes. Companies such as ADM and Ingredion are addressing these needs by offering high-purity soy protein concentrates and versatile solutions for applications in beverages and bakery products. A 2024 survey conducted by the Brazilian Vegetarian Society revealed that 7% of Brazil’s population, approximately 14 million individuals, identified as vegan or vegetarian, reflecting a broader trend toward reduced meat consumption and clean-label preferences [1]Source: Brazilian Vegetarian Society, "Vegan Market," svb.org.br. This has led to innovations from suppliers like Bunge, focusing on allergen-free solutions for meat analogs. Additionally, environmental sustainability concerns and advancements in soy protein textures to mimic animal-based products are further driving adoption. Companies like Roquette are capitalizing on these trends through targeted B2B partnerships, catering to food, elderly nutrition, and fitness product applications across Brazil and Argentina.
Growing market demand for lactose-free protein alternatives
Increasing demand for lactose-free protein alternatives is driving growth in the South American Plant Protein Ingredients market, as high lactose intolerance rates push consumers toward dairy-free options. This trend aligns with the rise of vegan and flexitarian diets, where plant proteins act as cholesterol-free substitutes. Manufacturers like Ingredion are meeting this demand with pea protein isolates that integrate seamlessly into beverages and bakery products without dairy content. Health-conscious consumers prefer plant-based proteins for their easier digestibility compared to animal sources, while hypoallergenic options such as pea and rice proteins address allergy concerns and find applications in food and dietary supplements. Environmental sustainability further supports this shift, as plant-based sourcing reduces livestock dependency. Technological advancements have enhanced solubility and texture, making plant proteins competitive with dairy. Clean-label preferences are also driving adoption, catering to fitness enthusiasts and the elderly with fortified, digestible formats. Ingredion’s versatile ingredients are fostering innovation in dairy substitutes, particularly in Brazil’s leading market, while supporting sustainable livestock feed practices.
Sports and performance-nutrition boom
The rapid growth of the sports nutrition segment in South America, expanding at twice the rate of the overall plant protein market, is driven by increasing gym memberships, e-commerce penetration, and strategic marketing that emphasizes protein supplementation as essential for fitness goals. Manufacturers like IFF are addressing this demand by providing soy protein isolates for high-performance blends, preferred by vegan athletes over whey protein. A 2024 survey by J. Wallin Opinion Research, commissioned by the Health & Fitness Association, revealed that 61% of Latin Americans in select urban areas exercise multiple times weekly, with 78% engaging in physical activity at least a few times each month, reflecting a growing focus on health and fitness [2]Source: Health & Fitness Association, "2024 Latin America Fitness Consumer Survey," healthandfitness.org. In Brazil, multinational supplement brands are reformulating whey-based products to include plant protein blends, catering to vegan athletes and individuals with dairy sensitivities, while Argentina’s economic challenges have increased demand for cost-effective plant-based protein powders, offering superior cost-per-gram ratios compared to animal proteins. Moreover, technological advancements in soy protein texture and hypoallergenic formulations are further driving innovations across food, beverage, and livestock feed sectors, with DuPont playing a key role in shaping the region’s market dynamics.
Increasing demand for elderly nutrition driven by aging populations
The aging population in South America is significantly influencing the demand for plant protein ingredients, particularly in elderly nutrition. With the population aged 65 and above projected to double between 2020 and 2040, there is a growing need for protein-fortified products that address sarcopenia prevention and immune support. Manufacturers are responding by offering soy protein hydrolysates in easily digestible formats tailored for seniors. Brazil's elderly population is expected to reach 23.42 million in 2024, according to the World Bank, driving demand for health-conscious, cholesterol-free options that combat age-related muscle loss and cater to lactose intolerance through dairy-free blends [3]Source: World Bank, "Population Ages 65 and Above, Total - Brazil," data.worldbank.org. This shift aligns with the adoption of vegan and flexitarian diets, as these groups increasingly prioritize sustainable elderly care. Clean-label trends are also shaping the market, with IFF's natural soy ingredients enhancing fortified cereals and beverages. Environmental sustainability benefits from reduced reliance on animal-based sources, while hypoallergenic soy variants address the needs of sensitive elderly consumers. Technological advancements in soy solubility enable swallowable supplements, supporting joint health in active seniors. These developments are fostering innovations in food and beverage products and influencing livestock feed formulations for healthier senior pet foods, with Solae's tailored soy proteins driving market leadership in Brazil and meeting Argentina's clean-label demands.
Restraints Impact Analysis*
| Restraint | (~) % Impact on CAGR Forecast | Geographic Relevance | Impact Timeline |
|---|---|---|---|
| Soy-allergen/GMO consumer concerns | -0.6% | Chile, Colombia, Brazil premium segments | Short term (≤ 2 years) |
| Commodity-price volatility for oilseeds | -0.9% | Brazil, Argentina, region-wide | Short term (≤ 2 years) |
| Taste/texture challenges hinder mainstream adoption vs. animal proteins | -0.8% | Brazil, Argentina, Chile, Colombia | Medium term (2-4 years) |
| Regulatory hurdles on labeling/GMO claims slow innovation | -0.5% | Brazil, Argentina with ANVISA/ANMAT oversight | Medium term (2-4 years) |
| Source: Mordor Intelligence | |||
Soy-allergen/GMO consumer concerns
Consumer concerns regarding soy allergens and GMOs are creating challenges for the plant protein ingredients market in South America, even as pea and rice protein segments gain traction. Soy, which accounts for 74% of the market share, is under scrutiny despite non-GMO options offered by manufacturers like Biosev SA. Rising health consciousness is driving consumers toward hypoallergenic alternatives, with lactose intolerance further accelerating the shift to dairy-free products. However, soy sensitivities, especially in elderly nutrition products, complicate this transition. Regulatory hurdles related to GMO labeling in Brazil and Argentina are slowing innovation, while taste and texture challenges deter consumers from soy-based products, despite advancements by Biosev SA to improve solubility. Environmental concerns over GMO soy cultivation and higher processing costs for non-GMO isolates are additional barriers, particularly in B2B applications like sports nutrition blends. Clean-label trends favor transparent sourcing of alternatives like pea and hemp proteins, but supply chain vulnerabilities in soy-dependent regions and fragmented quality standards exacerbate these issues. As allergen and GMO concerns drive diversification, Biosev SA’s efforts to adapt through partnerships face competition from the rapidly growing pea protein segment.
Commodity-price volatility for oilseeds
Commodity-price volatility for oilseeds is significantly impacting the South American plant protein ingredients market, particularly during the 2025-2026 period, as Brazil expands its soy facilities and Argentina increases pea production. Fluctuations in raw material prices are disrupting the pricing of concentrates and isolates, further exacerbated by supply chain vulnerabilities caused by droughts affecting key soy-producing regions. This volatility is driving up processing costs for premium forms such as hydrolysates, creating challenges for business-to-business (B2B) adoption in food and beverage applications, despite technological advancements by manufacturers like CHS Inc., whose soy protein ingredients face margin pressures in clean-label formulations. Declining Brazilian soybean prices and global surpluses are increasing input costs for cholesterol-free alternatives, counteracting vegan and flexitarian demand, while also clashing with the growing need for lactose-free dairy substitutes. Taste and texture challenges, compounded by cost pressures, are limiting the development of elderly nutrition blends and sports performance formulas reliant on consistent soy protein supplies. Environmental sustainability efforts are hindered by volatile cultivation, driving a shift toward pricier hypoallergenic pea protein, while regulatory hurdles on labeling amplify pricing unpredictability. CHS Inc. is employing hedging strategies in Brazil, but risks losing market share to the more stable pea protein amid bearish pressures expected in 2026.
*Our forecasts treat driver/restraint impacts as directional, not additive. The impact forecasts reflect baseline growth, mix effects, and variable interactions.
Segment Analysis
By Protein Type: Soy Dominance Meets Pea Protein's Allergen-Free Appeal
Soy protein held 68.28% of the market share in 2025, supported by extensive investments in infrastructure such as crush facilities, extraction plants, and supply chain logistics. This established scalability remains unmatched by alternative proteins. Meanwhile, pea protein is projected to grow at a compound annual growth rate (CAGR) of 5.82% through 2031, reflecting a strategic shift in the market. Manufacturers are increasingly incorporating pea isolates into soy-based products to address allergen concerns and appeal to consumers wary of genetically modified organisms (GMOs) ingredients. With its neutral flavor profile and superior amino acid composition compared to rice or wheat proteins, pea protein is particularly favored in sports nutrition and infant formula applications, where allergen-free claims command premium pricing.
Other plant proteins serve specific niches but face limitations in broader adoption. Wheat protein enhances texture in bakery and meat analogs due to its viscoelastic properties, though gluten sensitivities restrict its use. Rice protein is valued for hypoallergenic formulations but requires blending with complementary proteins due to its incomplete amino acid profile, adding complexity. Hemp protein, despite its omega-3 content, is constrained by regulatory uncertainties and limited cultivation infrastructure. Potato protein is gaining traction in clean-label applications for its minimal processing requirements, but remains confined to premium products due to high production costs. Emerging sources like sunflower and watermelon seed proteins are still in pilot-scale production and lack the supply chain maturity for mass-market adoption.


By End User: Food and Beverages Lead, but Animal Feed's Growth Reveals Supply Chain Pragmatism
The food and beverages segment accounted for 55.34% of the market share in 2025, while the animal feed segment demonstrated a notable compound annual growth rate (CAGR) of 6.14% through 2031. This growth in animal feed reflects its role as a structural hedge against volatility in the human nutrition market. Producers in aquaculture and poultry industries are increasingly substituting fishmeal, which has experienced price increases since 2023, with cost-effective alternatives such as soy and pea protein concentrates. This shift is particularly evident in Brazil's shrimp farming sector and Argentina's poultry industry, where producers face margin pressures from export competition and prioritize sustainable protein sources that meet European buyers' certifications. According to USDA Foreign Agricultural Service reports from 2024, Brazilian feed manufacturers introduced over a dozen new plant-based aquafeed formulations targeting tilapia and shrimp production, which are expanding rapidly in the Northeast region.
Within the food and beverages segment, dairy and dairy alternatives represent the fastest-growing subsegment, driven by the increasing prevalence of lactose intolerance and the adoption of flexitarian diets. Beverages, including ready-to-drink protein shakes and plant-based milk, benefit from convenience and impulse purchase behavior, while bakery applications utilize plant proteins to improve moisture retention and shelf life. Emerging applications such as confectionery, snacks, and ready-to-eat (RTE) or ready-to-cook (RTC) foods leverage plant proteins to enhance nutritional profiles and meet "high-protein" label claims, appealing to health-conscious consumers. However, meat, poultry, and seafood alternatives face challenges in South America due to taste-texture gaps and price premiums, limiting their adoption beyond early adopters.
Geography Analysis
Brazil is anticipated to lead the market with a 61.59% share in 2025, supported by its proximity to soybean production zones, established crushing and extraction infrastructure, and a diverse domestic consumer base catering to both premium and value-tier products. While its growth through 2031 is slower than Argentina's 6.02% CAGR, this reflects market maturity rather than stagnation. Growth drivers include premiumization, as consumers transition from commodity soy protein to pea blends, and export expansion to North American and European markets, emphasizing deforestation-free supply chains. Brazil's updated food labeling regulations by ANVISA in 2024, enhancing transparency around allergens and nutritional claims, are expected to further boost plant protein demand by highlighting lactose-free and allergen-free product positioning.
Argentina's 6.02% CAGR through 2031 highlights its strategic shift from raw oilseed exports to value-added processing, supported by 2024-2025 policy reforms reducing export taxes on soy protein isolates and concentrates. This transition is significant, as processed proteins command 2-3 times the per-tonne price of raw soybeans. Argentina's complete adoption of genetically engineered soy by 2024 ensures cost efficiencies unmatched by competitors. However, economic volatility and currency instability pose challenges, as stable macroeconomic conditions are essential for long-term investments in extraction plants and research and development facilities. The VISEC protocol, introduced in 2024, establishes traceability standards for deforestation-free soy, enabling Argentina to access premium European markets increasingly focused on sustainability certifications.
Emerging markets such as Chile, Colombia, and Peru offer growth potential driven by urbanization, rising incomes, and dietary diversification. Chile's higher per-capita income and consumer preference for clean-label products favor minimally processed plant proteins. Colombia's expanding retail infrastructure, led by multinational supermarket chains and e-commerce platforms, has improved distribution access for plant-based products. In Peru, the aquaculture sector is adopting plant-based feed formulations to reduce reliance on imported fishmeal, creating localized demand for soy and pea protein concentrates. Meanwhile, the Rest of South America, including Uruguay, Paraguay, and Ecuador, remains underpenetrated, with plant protein consumption largely confined to niche health food stores and limited mainstream retail presence.
Competitive Landscape
The competitive landscape of the plant protein ingredients market in South America is shaped by the interplay between multinational suppliers and regional processors. Global companies such as Cargill Incorporated, Archer Daniels Midland (ADM), Ingredion Incorporated, and Kerry Group plc leverage their extensive research and development capabilities, technical expertise, and supply networks to serve large food manufacturers across Brazil, Argentina, and neighboring markets. Their economies of scale and broad product portfolios ensure consistent quality and supply security for high-demand ingredients like soy and pea protein isolates, which are essential for meat alternatives, dairy analogues, and functional foods. Meanwhile, regional processors strategically position operations near agricultural hubs to reduce logistics costs and maintain product quality, addressing challenges unique to South America’s inland supply chains.
Shifting consumer preferences and functionality requirements are driving manufacturers to diversify beyond soy protein to include pea, rice, and blended protein systems. While soy protein remains dominant due to its cost-effectiveness and agricultural abundance, premium segments like pea protein isolates and textured formats are gaining traction, supported by demographic changes and plant-based dietary trends. Multinational firms focus on advanced formulations for large-scale processors, while regional players offer flexibility and custom solutions, fostering partnerships with niche food innovators. For instance, Tomorrow Foods (Argentina) supplies tailored protein isolates, including pea, rice, chickpea, and mung, to meet local manufacturers’ needs.
Emerging opportunities in segments such as elderly nutrition, aquaculture feeds, and clean-label bakery ingredients present growth potential for companies with strong technical and financial resources. These applications demand specialized functionality and higher nutritional density, offering moderate barriers to entry compared to mainstream meat alternatives. Additionally, disruptors like precision-fermentation biotech firms and innovators replicating animal protein functionality without heavy agricultural inputs are gaining attention as mid- to long-term competitors. The convergence of global scale, regional flexibility, and innovation underscores the market’s evolution toward diversified and sustainable solutions across South America’s food and feed industries.
South America Plant Protein Ingredients Industry Leaders
-
Archer Daniels Midland Company
-
International Flavors & Fragrances, Inc.
-
Kerry Group plc
-
Ingredion, Incorporated
-
Bunge Limited
- *Disclaimer: Major Players sorted in no particular order

Recent Industry Developments
- December 2025: Brazilian food tech firm Typcal has launched Latin America’s first large-scale mycelium fermentation facility in Pinhais, near Curitiba, following a USD 2 million (BRL10 million) fundraising round backed by local investors and Belgian accelerator Biotope. This facility transitions Typcal to commercial-scale production of mycelium-based protein ingredients, with plans to begin sales in Latin America and Europe by 2026. It supports product expansion and innovation in sustainable protein solutions.
- November 2025: At COP30 in Belém, Brazil, World Animal Protection and partners launched the Protein Shift Responsible Minimum Standard (RMS) under the FARMS Initiative. This framework guides financial institutions in reallocating capital from intensive animal agriculture to plant-based and alternative protein systems. It urges banks, insurers, and investors to align portfolios with climate, biodiversity, and animal welfare goals, supporting low-emission protein production like soy, beans, and precision fermentation to drive sustainable food system transformation.
- June 2024: Researchers from the Institute of Food Technology (ITAL) and the University of Campinas (UNICAMP) in São Paulo, Brazil, in partnership with the Fraunhofer IVV Institute in Germany, have developed a meat substitute derived from sunflower flour. This flour is a significant protein source and addresses the rising demand for sustainable, plant-based food products, reflecting a shift in consumer preferences toward environmentally friendly dietary options.


South America Plant Protein Ingredients Market Report Scope
Hemp Protein, Pea Protein, Potato Protein, Rice Protein, Soy Protein, Wheat Protein are covered as segments by Protein Type. Animal Feed, Food and Beverages, Personal Care and Cosmetics, Supplements are covered as segments by End User. Argentina, Brazil are covered as segments by Country.
By Protein Type
| Hemp Protein |
| Pea Protein |
| Potato Protein |
| Rice Protein |
| Soy Protein |
| Wheat Protein |
| Other Plant Protein |
By End User
| Animal Feed | |
| Food and Beverages | Bakery |
| Beverages | |
| Breakfast Cereals | |
| Condiments/Sauces | |
| Confectionery | |
| Dairy and Dairy Alternatives | |
| Meat/Poultry/Seafood and Alternatives | |
| RTE/RTC Foods | |
| Snacks | |
| Personal Care and Cosmetics | |
| Supplements | Baby Food and Infant Formula |
| Elderly and Medical Nutrition | |
| Sport and Dietary Supplements |
By Country
| Brazil |
| Argentina |
| Colombia |
| Chile |
| Peru |
| Rest of South America |
| By Protein Type | Hemp Protein | |
| Pea Protein | ||
| Potato Protein | ||
| Rice Protein | ||
| Soy Protein | ||
| Wheat Protein | ||
| Other Plant Protein | ||
| By End User | Animal Feed | |
| Food and Beverages | Bakery | |
| Beverages | ||
| Breakfast Cereals | ||
| Condiments/Sauces | ||
| Confectionery | ||
| Dairy and Dairy Alternatives | ||
| Meat/Poultry/Seafood and Alternatives | ||
| RTE/RTC Foods | ||
| Snacks | ||
| Personal Care and Cosmetics | ||
| Supplements | Baby Food and Infant Formula | |
| Elderly and Medical Nutrition | ||
| Sport and Dietary Supplements | ||
| By Country | Brazil | |
| Argentina | ||
| Colombia | ||
| Chile | ||
| Peru | ||
| Rest of South America | ||


Market Definition
- End User - The Protein Ingredients Market operates on a B2B basis. Food, Beverages, Supplements, Animal Feed, and Personal Care & Cosmetic manufacturers are considered to be end-consumers in the market studied. The scope excludes manufacturers buying liquid/dry whey to be used for application as a binding agent or thickener or other non-protein applications.
- Penetration Rate - Penetration Rate is defined as the percentage of Protein-Fortified End User Market Volume in the Overall End User Market Volume.
- Average Protein Content - Average protein content is the average protein content present per 100 g of product manufactured by all end-user companies considered under the scope of this report.
- End User Market Volume - End-user market volume is the consolidated volume of all types and forms of end-user products in the country or region.
| Keyword | Definition |
|---|---|
| Alpha-lactalbumin (α-Lactalbumin) | It is a protein that regulates the production of lactose in the milk of almost all mammalian species. |
| Amino acid | It is an organic compound that contains both amino and carboxylic acid functional groups, which are required for the synthesis of body protein and other important nitrogen-containing compounds, such as creatine, peptide hormones, and some neurotransmitters. |
| Blanching | It is the process of briefly heating vegetables with steam or boiling water. |
| BRC | British Retail Consortium |
| Bread improver | It is a flour-based blend of several components with specific functional properties designed to modify dough characteristics and give quality attributes to bread. |
| BSF | Black Soldier Fly |
| Caseinate | It is a substance produced by adding an alkali to acid casein, a derivative of casein. |
| Celiac disease | Celiac disease is an immune reaction to eating gluten, a protein found in wheat, barley, and rye. |
| Colostrum | It is a milky fluid that’s released by mammals that have recently given birth before breast milk production begins. |
| Concentrate | It is the least processed form of protein and has a protein content ranging from 40-90% by weight. |
| Dry protein basis | It refers to the percentage of "pure protein" present in a supplement after the water in it is completely removed through heat. |
| Dry whey | It is the product resulting from drying fresh whey which has been pasteurized and to which nothing has been added as a preservative. |
| Egg protein | It is a mixture of individual proteins, including ovalbumin, ovomucoid, ovoglobulin, conalbumin, vitellin, and vitellenin. |
| Emulsifier | It is a food additive that facilitates the blending of foods that are immiscible with one another, such as oil and water. |
| Enrichment | It is the process of addition of micronutrients that are lost during the processing of the product. |
| ERS | Economic Research Service of the USDA |
| Extrusion | It is the process of forcing soft mixed ingredients through an opening in a perforated plate or die designed to produce the required shape. The extruded food is then cut to a specific size by blades. |
| Fava | Also known as Faba, it is another word for yellow split beans. |
| FDA | Food and Drug Administration |
| Flaking | It is a process in which typically a cereal grain (like corn, wheat, or rice) is broken down into grits, cooked with flavors and syrups, and then pressed into flakes between cooled rollers. |
| Foaming agent | It is a food ingredient that makes it possible to form or maintain a uniform dispersion of a gaseous phase in a liquid or solid food. |
| Foodservice | It refers to the part of the food industry which includes businesses, institutions, and companies which prepare meals outside the home. It includes restaurants, school and hospital cafeterias, catering operations, and many other formats. |
| Fortification | It is the deliberate addition of micronutrients that are not found in them naturally or which are lost during processing, to improve a food product's nutritional value. |
| FSANZ | Food Standards Australia New Zealand |
| FSIS | Food Safety and Inspection Service |
| FSSAI | Food Safety and Standards Authority of India |
| Gelling agent | It is an ingredient that functions as a stabilizer and thickener to provide thickening without stiffness through the formation of gel. |
| GHG | Greenhouse Gas |
| Gluten | It is a family of proteins found in grains, including wheat, rye, spelt, and barley. |
| Hemp | It is a botanical class of Cannabis sativa cultivars grown specifically for industrial or medicinal use. |
| Hydrolysate | It is a form of protein manufactured by exposing the protein to enzymes that can partially break the bonds between the protein's amino acids and break down large, complicated proteins into smaller pieces. Its processing makes it easier and quicker to digest. |
| Hypoallergenic | It refers to a substance that causes fewer allergic reactions. |
| Isolate | It is the purest and most processed form of protein which has undergone separation to obtain a pure protein fraction. It typically contains ≥ 90% of protein by weight. |
| Keratin | It is a protein that helps form hair, nails, and the outer layer of skin. |
| Lactalbumin | It is the albumin contained in milk and obtained from whey. |
| Lactoferrin | It is an iron‑binding glycoprotein that is present in the milk of most mammals. |
| Lupin | It is the yellow legume seeds of the genus Lupinus. |
| Millenial | Also known as Generation Y or Gen Y, it refers to the people born from 1981 to 1996. |
| Monogastric | It refers to an animal with a single-compartmented stomach. Examples of monogastric include humans, poultry, pigs, horses, rabbits, dogs, and cats. Most monogastric are generally unable to digest much cellulose food materials such as grasses. |
| MPC | Milk protein concentrate |
| MPI | Milk protein isolate |
| MSPI | Methylated soy protein isolate |
| Mycoprotein | Mycoprotein is a form of single-cell protein, also known as fungal protein, derived from fungi for human consumption. |
| Nutricosmetics | It is a category of products and ingredients that act as nutritional supplements to care for skin, nails, and hair natural beauty. |
| Osteoporosis | It is a medical condition in which the bones become brittle and fragile from loss of tissue, typically as a result of hormonal changes, or deficiency of calcium or vitamin D. |
| PDCAAS | Protein digestibility-corrected amino acid score (PDCAAS) is a method of evaluating the quality of a protein based on both the amino acid requirements of humans and their ability to digest it. |
| Per-capita consumption of animal protein | It is the average amount of animal protein (such as milk, whey, gelatin, collagen, and egg proteins) that is readily available for consumption by each person in an actual population. |
| Per-capita consumption of plant protein | It is the average amount of plant protein (such as soy, wheat, pea, oat, and hemp proteins) that is readily available for consumption by each person in an actual population. |
| Quorn | It is a microbial protein manufactured using mycoprotein as an ingredient, in which the fungus culture is dried and mixed with egg albumen or potato protein, which acts as a binder, and then is adjusted in texture and pressed into various forms. |
| Ready-to-Cook (RTC) | It refers to food products that include all of the ingredients, where some preparation or cooking is required through a process that is given on the package. |
| Ready-to-Eat (RTE) | It refers to a food product prepared or cooked in advance, with no further cooking or preparation required before being eaten. |
| RTD | Ready-to-Drink |
| RTS | Ready-to-Serve |
| Saturated fat | It is a type of fat in which the fatty acid chains have all single bonds. It is generally considered unhealthy. |
| Sausage | It is a meat product made of finely chopped and seasoned meat, which may be fresh, smoked, or pickled and which is then usually stuffed into a casing. |
| Seitan | It is a plant-based meat substitute made out of wheat gluten. |
| Softgel | It is a gelatin-based capsule with a liquid fill. |
| SPC | Soy protein concentrate |
| SPI | Soy protein isolate |
| Spirulina | It is a biomass of cyanobacteria that can be consumed by humans and animals. |
| Stabilizer | It is an ingredient added to food products to help maintain or enhance their original texture, and physical and chemical characteristics. |
| Supplementation | It is the consumption or provision of concentrated sources of nutrients or other substances that are intended to supplement nutrients in the diet and is intended to correct nutritional deficiencies. |
| Texturant | It is a specific type of food ingredient that is used to control and alter the mouthfeel and texture of food and beverage products. |
| Thickener | It is an ingredient that is used to increase the viscosity of a liquid or dough and make it thicker, without substantially changing its other properties. |
| Trans fat | Also called trans-unsaturated fatty acids or trans fatty acids, it is a type of unsaturated fat that naturally occurs in small amounts in meat. |
| TSP | Textured soy protein |
| TVP | Textured vegetable protein |
| WPC | Whey protein concentrate |
| WPI | Whey protein isolate |


Research Methodology
Mordor Intelligence follows a four-step methodology in all our reports.
- Step-1: Identify Key Variables: The quantifiable key variables (industry and extraneous) pertaining to the specific product segment and country are selected from a group of relevant variables & factors based on desk research & literature review; along with primary expert inputs. These variables are further confirmed through regression modeling (wherever required).
- Step-2: Build a Market Model: In order to build a robust forecasting methodology, the variables and factors identified in Step-1 are tested against available historical market numbers. Through an iterative process, the variables required for market forecast are set and the model is built on the basis of these variables.
- Step-3: Validate and Finalize: In this important step, all market numbers, variables and analyst calls are validated through an extensive network of primary research experts from the market studied. The respondents are selected across levels and functions to generate a holistic picture of the market studied.
- Step-4: Research Outputs: Syndicated Reports, Custom Consulting Assignments, Databases & Subscription Platforms


