South America Herbicide Market Size and Share
Market Overview
| Study Period | 2017 - 2030 |
|---|---|
| Forecast Data Period | 2025 - 2030 |
| Historical Data Period | 2017 - 2023 |
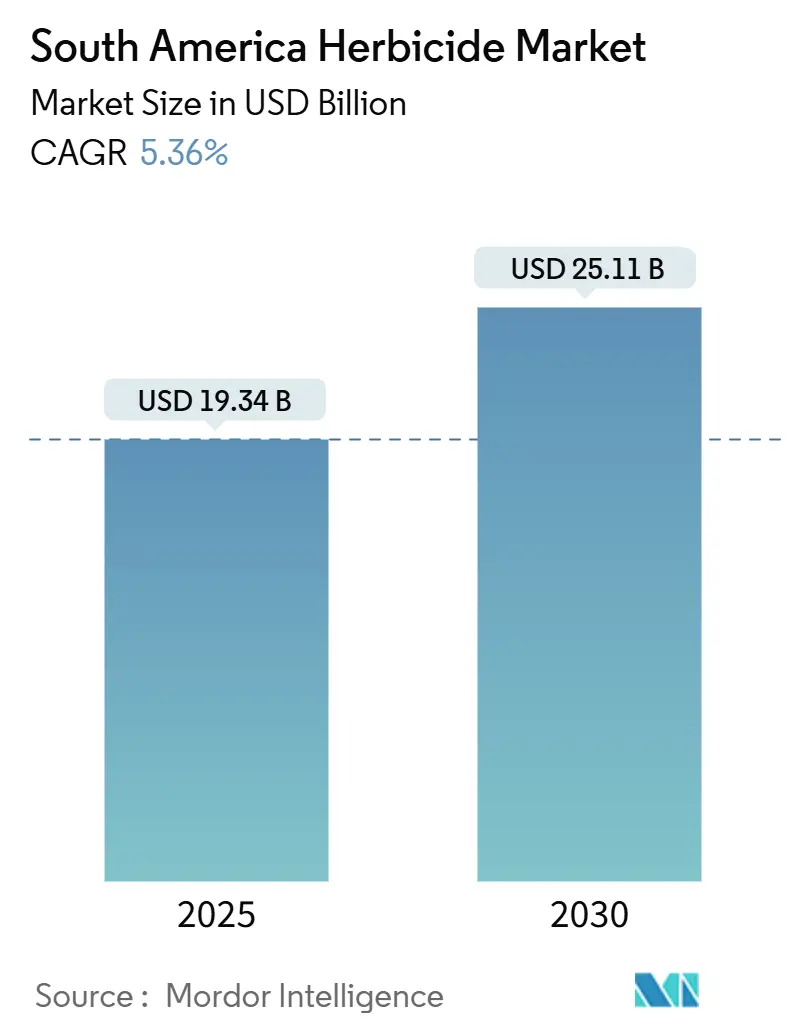
| Market Size (2025) | USD 19.34 Billion |
| Market Size (2030) | USD 25.11 Billion |
| Growth Rate (2025 - 2030) | 5.36% CAGR |
| Market Concentration | Medium |
Major Players *Disclaimer: Major Players sorted in no particular order Image © Mordor Intelligence. Reuse requires attribution under CC BY 4.0. | |
South America Herbicide Market Analysis by Mordor Intelligence
The South America herbicides market size reached USD 19.34 billion in 2025 and is projected to reach USD 25.11 billion by 2030, advancing at a 5.36% CAGR through the forecast period. Sustained expansion reflects aggressive adoption of glyphosate-tolerant genetically modified seed, the growing appeal of integrated subsidy programs that lower the effective cost of chemical weed control, and continuous investment in precision spraying technologies that unlock measurable input-use efficiency. Brazil remains the unquestioned revenue anchor due to its concentration of soybean and corn acreage, but Argentina’s streamlined registration rules and favorable export incentives are accelerating product turnover and portfolio diversification among suppliers. Widespread labor shortages, recurring waves of herbicide-resistant weeds, and tighter residue standards in export markets are also reshaping formulation strategy and pushing growers to premium premixes with multiple modes of action. At the same time, policy support for biological actives under Brazil’s new Pesticide Law and similar initiatives in Chile are encouraging manufacturers to deploy hybrid portfolios that balance synthetic and bio-based chemistries.
Key Report Takeaways
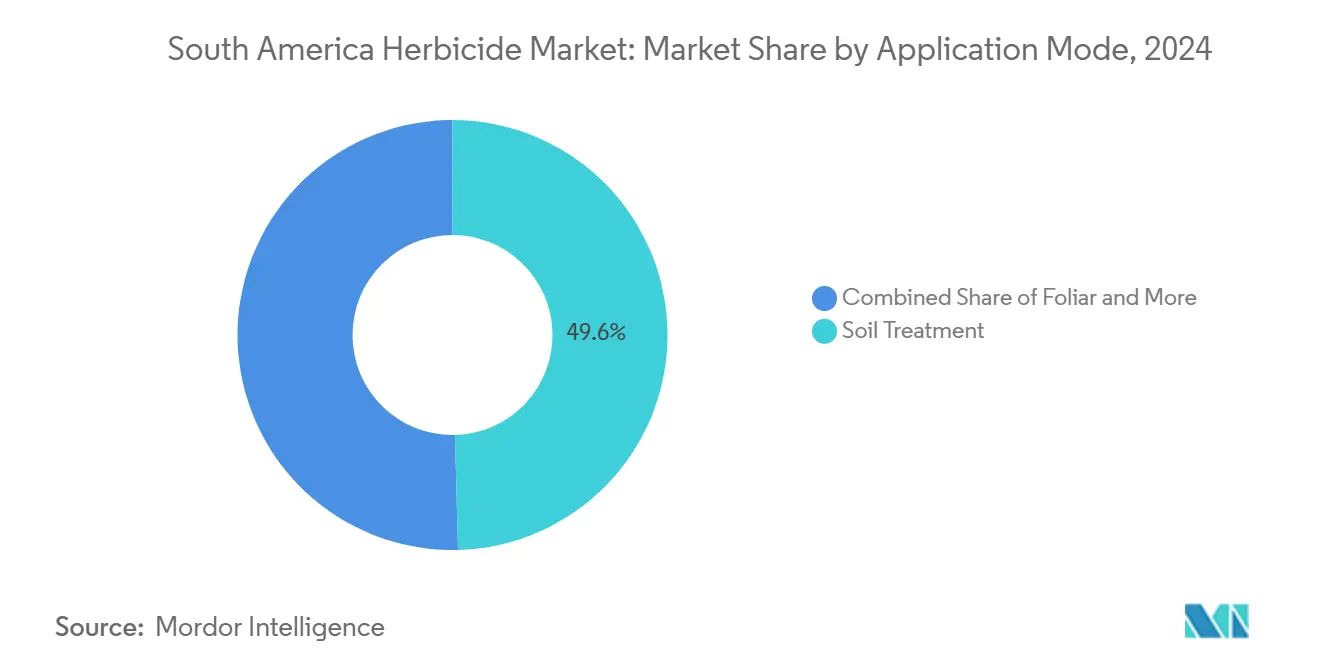
- By application mode, soil treatment commanded 49.6% of the South America herbicides market share in 2024 and is projected to grow at a 5.56% CAGR through 2030.
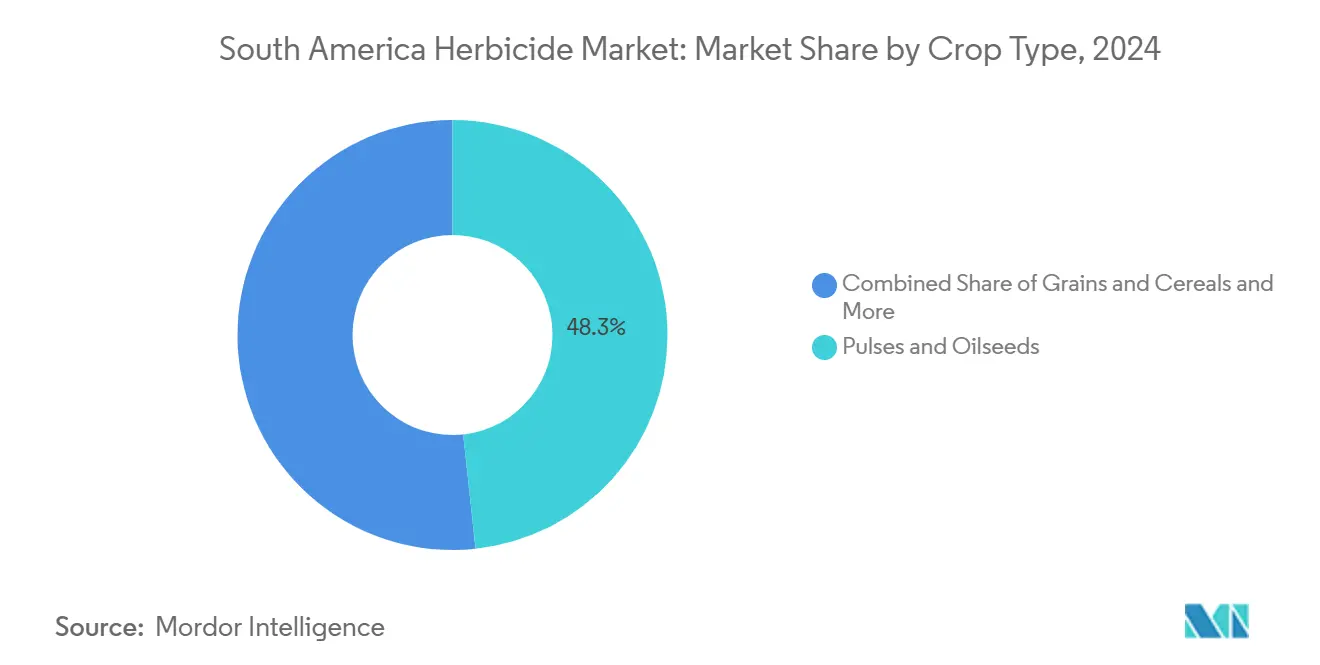
- By crop type, pulses and oilseeds accounted for 48.3% of the South America herbicides market size in 2024, while grains and cereals are forecast to record the fastest expansion at 5.45% CAGR to 2030.
- In 2024, Brazil commanded a dominant 63.6% share of the revenue pie, while Argentina is set to outpace its peers, with projections indicating a robust 5.68% CAGR through 2030.
South America Herbicide Market Trends and Insights
Drivers Impact Analysis*
| Driver | (~) % Impact on CAGR Forecast | Geographic Relevance | Impact Timeline |
|---|---|---|---|
| Escalating glyphosate-tolerant GM seed adoption | +1.2% | Brazil, Argentina, Paraguay | Medium term (2-4 years) |
| Government subsidy programs for row-crop intensification | +0.8% | Brazil, Argentina, Chile | Short term (≤ 2 years) |
| Rising herbicide-resistant weed prevalence | +1.5% | Global, strongest in Brazil and Argentina | Long term (≥ 4 years) |
| Farm-labor scarcity accelerating chemical weed control | +0.6% | Brazil, Argentina, Chile | Medium term (2-4 years) |
| Emergence of bio-herbicide active ingredients | +0.4% | Brazil, Chile, emerging in Argentina | Long term (≥ 4 years) |
| Advent of drone-enabled precision spraying | +0.3% | Brazil, Argentina, pilot programs in Chile | Medium term (2-4 years) |
| Source: Mordor Intelligence | |||
Escalating Glyphosate-Tolerant GM Seed Adoption
Genetically modified herbicide-tolerant crop varieties now cover approximately 95% of South America's soybean acreage and 85% of corn plantings, creating sustained demand for post-emergence herbicide applications. Argentina's recent approval of HB4 drought-tolerant soybeans with glyphosate and glufosinate tolerance expands the addressable market for dual-mode herbicide programs, particularly in marginal rainfall zones where crop stress amplifies weed competition. Brazil's adoption of Intacta2 Xtend soybeans, combining dicamba tolerance with existing glyphosate resistance, drives incremental herbicide volume growth estimated at 8-12% annually in adopting regions. However, technology fees for advanced trait packages increase seed costs by USD 15-25 per hectare, pressuring growers to maximize herbicide efficacy through precise application timing and tank-mix optimization strategies.
Government Subsidy Programs for Row-Crop Intensification
Brazil's Plano Safra 2024/25 allocates R$ 400.59 billion (USD 73.7 billion) in agricultural credit, with specific provisions supporting integrated pest management and precision agriculture adoption that indirectly subsidizes herbicide applications through equipment financing and technical assistance programs[1]Source: Brazilian Development Bank, “Plano Safra 2024/25 Agricultural Credit Program,” bndes.gov.br. Argentina's export tax differential system provides preferential rates for value-added agricultural products, incentivizing intensive cropping systems that rely heavily on herbicide-based weed control. Chile's agricultural competitiveness program offers matching grants up to USD 50,000 for precision spraying equipment, accelerating UAV-based herbicide application adoption among mid-scale growers. These subsidy mechanisms effectively reduce the net cost of herbicide programs by 12-18%, supporting market expansion despite commodity price volatility.
Rising Herbicide-Resistant Weed Prevalence
Multiple herbicide resistance now affects over 40% of South America's intensive cropping areas, with Amaranthus hybridus exhibiting resistance to glyphosate, ALS inhibitors, and PPO inhibitors across 15 million hectares of Brazilian and Paraguayan farmland[2]Source: Weed Science Society of America, “Multiple Herbicide Resistance in South American Weed Species,” cambridge.org. Conyza species demonstrate resistance to five different herbicide modes of action, forcing growers to adopt expensive pre-emergence residual programs that increase per-hectare costs by USD 35-50 compared to post-emergence-only strategies. Digitaria insularis (sourgrass) resistance evolution in Paraguay's eastern production regions threatens the sustainability of no-till systems that underpin the region's agricultural competitiveness. Resistance management protocols now mandate mode-of-action rotation, cover crop integration, and mechanical cultivation practices that collectively add 20-25% to traditional herbicide program costs, driving demand for novel active ingredients and biological control agents.
Farm-Labor Scarcity Accelerating Chemical Weed Control
Rural wage inflation averaging 8-12% annually across South America's primary agricultural regions makes manual weeding economically unviable for commercial crop production, particularly during peak labor demand periods when seasonal workers command premium wages. Mechanized cultivation alternatives require significant capital investment and are constrained by soil conditions, crop spacing, and weather windows that limit operational flexibility. Chemical weed control programs offer consistent efficacy regardless of labor availability, driving adoption among mid-scale growers who previously relied on manual methods. The economic threshold for herbicide application has declined to USD 12-15 per hectare in most crops, well below manual weeding costs that range from USD 45-80 per hectare depending on weed density and regional wage rates.
Restraints Impact Analysis*
| Restraint | (~) % Impact on CAGR Forecast | Geographic Relevance | Impact Timeline |
|---|---|---|---|
| Stringent MRL regulations in import markets | -0.7% | Brazil, Argentina export regions | Short term (≤ 2 years) |
| Supply-chain volatility in key technicals | -0.5% | Regional, China-dependent imports | Short term (≤ 2 years) |
| Escalating resistance-management costs for growers | -0.9% | Brazil, Argentina, Paraguay | Medium term (2-4 years) |
| Early-stage carbon-credit land-use restrictions | -0.2% | Brazil Cerrado, Argentina Pampas | Long term (≥ 4 years) |
| Source: Mordor Intelligence | |||
Stringent MRL Regulations in Import Markets
European Union rule updates that lower maximum residue levels for glyphosate and paraquat have triggered mandatory pre-harvest intervals and sampling protocols for soybean cargoes shipped from Brazil’s northern ports. Exporters now require third-party verification certificates, which add USD 4–6 per ton in logistics and laboratory charges, prompting some growers to cap late-season applications and pivot toward lower residue formulations. Similar pressures emanate from East Asian buyers of high-protein corn, further constraining formulation choices during dry-down periods.
Supply-Chain Volatility in Key Technicals
Intermittent manufacturing shutdowns in China’s Zhejiang province curbed glufosinate and oxadiazon output, inflating delivered prices into Santos port by as much as 22% in late 2024. Spot shortages ripple downstream, disrupting distributors’ inventory planning and pushing growers toward substitute actives that may deliver suboptimal control. Local technical synthesis capacity is expanding but remains insufficient to buffer prolonged global supply dislocations. Continuous price swings undercut long-term forecast reliability and may deter on-farm adoption of more premium residual programs.
*Our forecasts treat driver/restraint impacts as directional, not additive. The impact forecasts reflect baseline growth, mix effects, and variable interactions.
Segment Analysis
By Application Mode: Residual Soil Treatments Rise in Pre-Emergence Strategies
Soil treatment applications captured 49.6% market share in 2024, reflecting the industry's strategic shift toward residual herbicide programs that provide extended weed control duration and resistance management benefits. This segment is projected to grow at 5.56% CAGR through 2030, driven by escalating post-emergence resistance issues that force growers to invest in pre-emergence foundation programs. Foliar applications maintain a significant share, particularly for post-emergence grass control and burndown treatments, due to resistance constraints. Chemigation systems are concentrated in irrigated crop production, where precise timing and uniform distribution justify the infrastructure investment required for injection systems.
Second-generation granular formulations of pyroxasulfone, S-metolachlor, and flumioxazin provide 60-day residual activity in high-temperature environments, a critical advantage as rain events become less predictable. Distributors report steadily rising bundle sales that pair pre-emergence residuals with post-emergence contact actives to sustain season-long control while meeting stewardship guidelines. Continuous education efforts led by crop science firms and extension agencies further drive adoption, with field days demonstrating lower per-bushel cost when residuals are correctly timed ahead of the first weed flush. On-farm trials reveal average yield gains of 2–4 bushels per acre in soybean and 4–6 bushels in corn when soil treatments replace single-shot foliar programs.


By Crop Type: Pulses and Oilseeds Anchor Volume and Value Growth
Pulses and oilseeds account for 48.3% of the South America herbicides market size in 2024. Soybean represents nearly three quarters of this segment, scaling with Brazil’s aggressive expansion into the Cerrado and Argentina’s rebound in northern provinces. Grains and Cereals segment is projected 5.45% CAGR through 2030 mirrors ongoing acreage gains and adoption of stacked herbicide-tolerant traits. Intensive herbicide regimes that blend pre-plant residuals and in-crop grass killers are standard in double-cropped corn following soybean, yet margin compression from fluctuating global prices moderates segment expansion. Commercial crops such as cotton and sugarcane witness mechanization upgrades in sugarcane, including controlled droplet application booms, which are nudging herbicide loadings higher to manage increasingly diverse weed flora.
Fruits and vegetables, drive disproportionate value due to average per-hectare spend of USD 180–250, reflecting high labor displacement and zero-tolerance residue protocols demanded by importers in North America and Europe. Turf and ornamental use remains minor at 1.8% but registers consistent sales to golf courses and city parks, which lean on softer bio-herbicides to maintain public access. In South America, herbicide market share data reveal a shift towards tailored mixtures, adjusted for specific weed pressures and crop growth stages. This trend favors manufacturers boasting strong agronomic advisory networks and region-specific product development.
Geography Analysis
Brazil retained 63.62% market share in 2024, buoyed by 85 million cultivated hectares spanning soybeans, corn, cotton, and sugarcane. Continued expansion into the MATOPIBA frontier and double-cropping systems, while Argentina records the fastest growing country with 5.68% CAGR. Adoption of biologicals is gaining ground in the Southern states where small grains and horticulture dominate. Enhanced port infrastructure along the Northern Arc shortens delivery times for inputs shipped from Asian technical suppliers, lowering stock-out risk and supporting just-in-time delivery models[3]Source: Argentine Agricultural Federation, “Herbicide Market Trends in Argentina 2024,” faa.org.ar.
Argentina's resolution 694/2024, which recognizes technical equivalence with seven reference countries, halves approval time for new formulations to 12 months and drives a 14% year-on-year spike in product launches. Export-oriented policies that discount soybean meal duties relative to unprocessed beans indirectly reward intensive herbicide programs that help achieve protein specifications. Currency devaluation cycles encourage inventory prepayment, prompting distributors to roll promotional bundles that tie early purchasing to extended credit.
In Chile, orchardists increasingly deploy drone spraying and bio-herbicides to comply with stringent European Union residue rules, pushing suppliers to tailor low-drift emulsions and adjuvants that reduce visible residues at harvest. Rest of South America, is fuelled by rising mechanization and government-backed no-till initiatives that necessitate chemical weed control. Across these emerging markets, smallholder aggregation schemes and input credit cooperatives play pivotal roles in unlocking herbicide adoption among resource-constrained growers. Brazil’s ANVISA (Agência Nacional de Vigilância Sanitáriastill) demands exhaustive toxicology dossiers, prompting multinational firms to prioritize blockbuster actives with broad revenue potential.
Competitive Landscape
The South America herbicides market shows moderate concentration where the top five firms captured around 40% share in 2024. Syngenta Group leads on the back of broad-spectrum brands like Gramoxone and Touchdown and an aggressive field-service model that bundles digital scouting tools with product sales. Corteva Agriscience follows, propelled by Zidua and Rinskor, plus its strong channel presence through the Pioneer seed network. BASF, Bayer, and UPL occupy the next three positions, each leveraging distinct strengths. In December 2024, BASF bolstered its direct-to-farmer penetration by acquiring Lavoro Agro's expansive 450-store distribution chain.
Below the top tier, Helm AG exploit price-driven opportunities in post-patent actives, while domestic companies such as Rotam CropScience secure orchard and specialty crop niches through flexible packaging and local stewardship programs. Digital agronomy partnerships emerge as a defining battleground; Nufarm’s integration with Solinftec’s real-time monitoring platform demonstrates how algorithm-driven recommendations can lock growers into proprietary formulation suites. Key patents on glufosinate and dicamba have expired, intensifying pricing pressures and opening doors for generic manufacturers. Notably, Albaugh seized this opportunity, debuting a cost-effective glufosinate in Paraguay in September 2024.
Sustainability credentials increasingly dictate tender outcomes, especially for suppliers targeting multinational grain exporters that enforce ISO 14001 and GLOBALG.A.P. compliance across sourcing regions. Companies responding with transparent supply-chain audits, recyclable packaging, and reduced-solvent formulations are winning shelf space at large distributors. Competitive intensity remains highest in soy-dominated Brazil where multiseason rotations push demand peaks, whereas niche opportunities arise in Chile and Peru for bio-herbicide specialists capitalizing on export-oriented horticulture.
South America Herbicide Industry Leaders
BASF SE
Bayer AG
Corteva Agriscience
Syngenta Group
UPL Ltd
- *Disclaimer: Major Players sorted in no particular order


Recent Industry Developments
- July 2025: Bayer has applied for approval of its new herbicide, icafolin-methyl. This herbicide introduces a groundbreaking approach to post-emergent weed control, marking the first such innovation in over three decades for key crops, including soybeans and cereals. It anticipates launching the product in 2028, with Brazil set to be the inaugural market.
- December 2024: BASF wrapped up a USD 280 million purchase of Lavoro Agro’s Brazilian retail chain, adding 450 outlets and enhancing after-sales agronomic support. Integration plans feature omnichannel ordering platforms and localized warehouse hubs that shorten delivery lead times during peak spray windows.
- November 2024: Syngenta Group received ANVISA clearance for a soil-applied premix combining S-metolachlor and pyroxasulfone. Multi-site field trials showed 15% better control of resistant Digitaria insularis compared with stand-alone actives, prompting the firm to forecast first-year sales of 2 million liters.


South America Herbicide Market Report Scope
| Chemigation |
| Foliar |
| Fumigation |
| Soil Treatment |
| Commercial Crops |
| Fruits & Vegetables |
| Grains & Cereals |
| Pulses & Oilseeds |
| Turf & Ornamental |
| Argentina |
| Brazil |
| Chile |
| Rest of South America |
| Application Mode | Chemigation |
| Foliar | |
| Fumigation | |
| Soil Treatment | |
| Crop Type | Commercial Crops |
| Fruits & Vegetables | |
| Grains & Cereals | |
| Pulses & Oilseeds | |
| Turf & Ornamental | |
| Country | Argentina |
| Brazil | |
| Chile | |
| Rest of South America |


Market Definition
- Function - Herbicides are chemicals used to control or prevent weeds from preventing crop growth and yield loss.
- Application Mode - Foliar, Seed Treatment, Soil Treatment, Chemigation, and Fumigation are the different type of application modes through which crop protection chemicals are applied to the crops.
- Crop Type - This represents the consumption of crop protection chemicals by Cereals, Pulses, Oilseeds, Fruits, Vegetables, Turf, and Ornamental crops.
| Keyword | Definition |
|---|---|
| IWM | Integrated weed management (IWM) is an approach to incorporate multiple weed control techniques throughout the growing season to give producers the best opportunity to control problematic weeds. |
| Host | Hosts are the plants that form relationships with beneficial microorganisms and help them colonize. |
| Pathogen | A disease-causing organism. |
| Herbigation | Herbigation is an effective method of applying herbicides through irrigation systems. |
| Maximum residue levels (MRL) | Maximum Residue Limit (MRL) is the maximum allowed limit of pesticide residue in food or feed obtained from plants and animals. |
| IoT | The Internet of Things (IoT) is a network of interconnected devices that connect and exchange data with other IoT devices and the cloud. |
| Herbicide-tolerant varieties (HTVs) | Herbicide-tolerant varieties are plant species that have been genetically engineered to be resistant to herbicides used on crops. |
| Chemigation | Chemigation is a method of applying pesticides to crops through an irrigation system. |
| Crop Protection | Crop protection is a method of protecting crop yields from different pests, including insects, weeds, plant diseases, and others that cause damage to agricultural crops. |
| Seed Treatment | Seed treatment helps to disinfect seeds or seedlings from seed-borne or soil-borne pests. Crop protection chemicals, such as fungicides, insecticides, or nematicides, are commonly used for seed treatment. |
| Fumigation | Fumigation is the application of crop protection chemicals in gaseous form to control pests. |
| Bait | A bait is a food or other material used to lure a pest and kill it through various methods, including poisoning. |
| Contact Fungicide | Contact pesticides prevent crop contamination and combat fungal pathogens. They act on pests (fungi) only when they come in contact with the pests. |
| Systemic Fungicide | A systemic fungicide is a compound taken up by a plant and then translocated within the plant, thus protecting the plant from attack by pathogens. |
| Mass Drug Administration (MDA) | Mass drug administration is the strategy to control or eliminate many neglected tropical diseases. |
| Mollusks | Mollusks are pests that feed on crops, causing crop damage and yield loss. Mollusks include octopi, squid, snails, and slugs. |
| Pre-emergence Herbicide | Preemergence herbicides are a form of chemical weed control that prevents germinated weed seedlings from becoming established. |
| Post-emergence Herbicide | Postemergence herbicides are applied to the agricultural field to control weeds after emergence (germination) of seeds or seedlings. |
| Active Ingredients | Active ingredients are the chemicals in pesticide products that kill, control, or repel pests. |
| United States Department of Agriculture (USDA) | The Department of Agriculture provides leadership on food, agriculture, natural resources, and related issues. |
| Weed Science Society of America (WSSA) | The WSSA, a non-profit professional society, promotes research, education, and extension outreach activities related to weeds. |
| Suspension concentrate | Suspension concentrate (SC) is one of the formulations of crop protection chemicals with solid active ingredients dispersed in water. |
| Wettable powder | A wettable powder (WP) is a powder formulation that forms a suspension when mixed with water prior to spraying. |
| Emulsifiable concentrate | Emulsifiable concentrate (EC) is a concentrated liquid formulation of pesticide that needs to be diluted with water to create a spray solution. |
| Plant-parasitic nematodes | Parasitic Nematodes feed on the roots of crops, causing damage to the roots. These damages allow for easy plant infestation by soil-borne pathogens, which results in crop or yield loss. |
| Australian Weeds Strategy (AWS) | The Australian Weeds Strategy, owned by the Environment and Invasives Committee, provides national guidance on weed management. |
| Weed Science Society of Japan (WSSJ) | WSSJ aims to contribute to the prevention of weed damage and the utilization of weed value by providing the chance for research presentation and information exchange. |


Research Methodology
Mordor Intelligence follows a four-step methodology in all our reports.
- Step-1: Identify Key Variables: In order to build a robust forecasting methodology, the variables and factors identified in Step-1 are tested against available historical market numbers. Through an iterative process, the variables required for market forecast are set and the model is built on the basis of these variables.
- Step-2: Build a Market Model: Market-size estimations for the forecast years are in nominal terms. Inflation is not a part of the pricing, and the average selling price (ASP) is kept constant throughout the forecast period.
- Step-3: Validate and Finalize: In this important step, all market numbers, variables and analyst calls are validated through an extensive network of primary research experts from the market studied. The respondents are selected across levels and functions to generate a holistic picture of the market studied.
- Step-4: Research Outputs: Syndicated Reports, Custom Consulting Assignments, Databases & Subscription Platforms


