South America Fungicide Market Size and Share
Market Overview
| Study Period | 2017 - 2030 |
|---|---|
| Forecast Data Period | 2025 - 2030 |
| Historical Data Period | 2017 - 2023 |
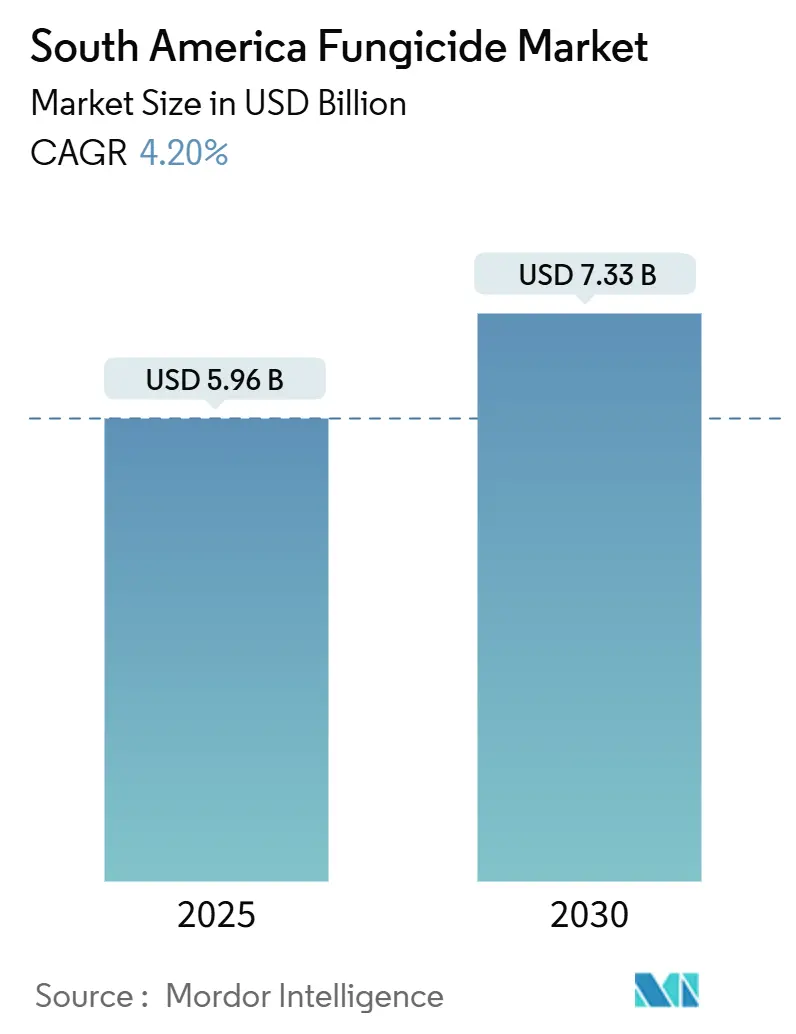
| Market Size (2025) | USD 5.96 Billion |
| Market Size (2030) | USD 7.33 Billion |
| Growth Rate (2025 - 2030) | 4.20% CAGR |
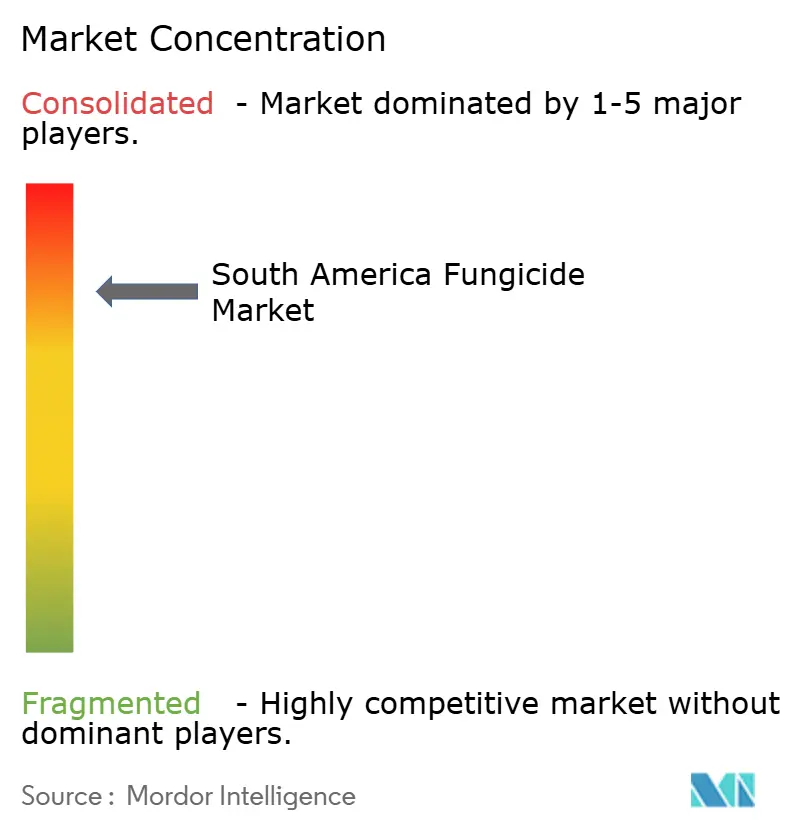
| Market Concentration | High |
Major Players *Disclaimer: Major Players sorted in no particular order Image © Mordor Intelligence. Reuse requires attribution under CC BY 4.0. | |
South America Fungicide Market Analysis by Mordor Intelligence
The South America fungicides market is currently worth USD 5.96 billion and is forecast to reach USD 7.33 billion by 2030, translating into a 4.2% CAGR over the period from 2025 to 2030. Strong demand stems from the region’s expansive soybean, corn, and fruit production zones where persistent fungal pressure and evolving resistance profiles make broad-spectrum and combination products essential. Brazil’s streamlined pesticide registration law has cut approval timelines to three years and is encouraging rapid commercialization of new active ingredients, while an upswing in drone-based aerial spraying and precision agriculture platforms is improving application efficiency and reducing wastage. Tightened maximum residue limits in key export destinations are nudging producers toward lower-dose formulations and biological alternatives, yet robust commodity prices and carbon credit incentives continue to support grower spending on premium chemistries. While volatile triazole raw material costs pose challenges, Brazil and Argentina's growing domestic production capacities are easing supply-chain concerns.
Key Report Takeaways
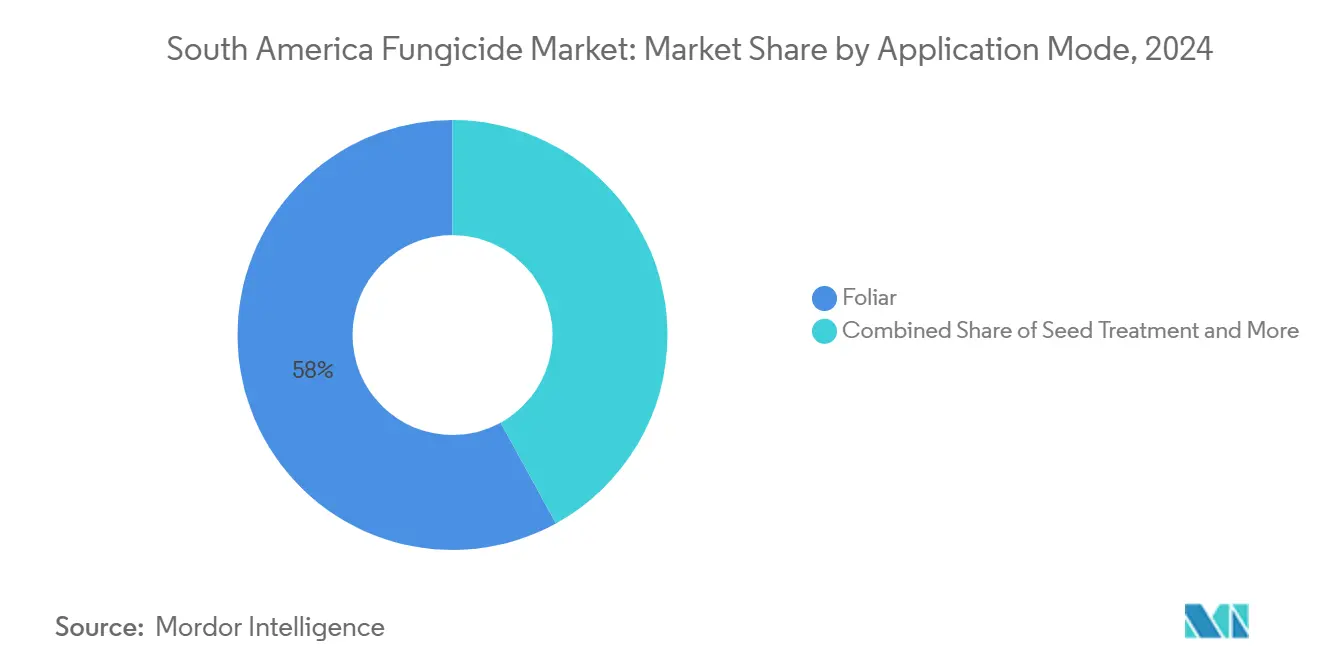
- By application mode, foliar spraying led with a 58% revenue share in 2024, while seed treatment is projected to post a 4.29% CAGR through 2030.
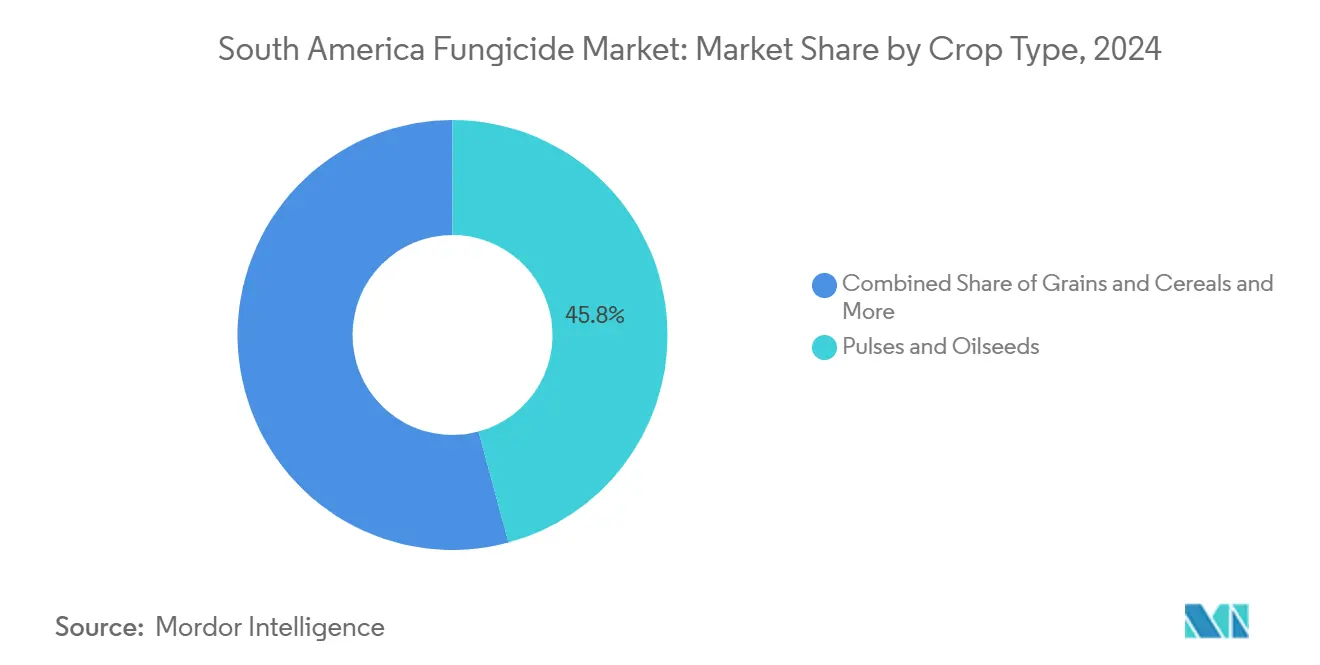
- In 2024, pulses and oilseeds held a dominant 45.8% share of the South American fungicides market, while fruits and vegetables are projected to grow at a CAGR of 4.44% through 2030.
- In 2024, Brazil dominated the demand landscape, capturing a significant 81.6% share. Meanwhile, Chile is poised to lead with the swiftest growth rate, projected at 5.79% through 2030.
South America Fungicide Market Trends and Insights
Drivers Impact Analysis*
| Driver | (~) % Impact on CAGR Forecast | Geographic Relevance | Impact Timeline |
|---|---|---|---|
| Soybean rust-resistant strains push higher fungicide dosages | +0.8% | Brazil, Argentina, Paraguay | Medium term (2-4 years) |
| Brazil's emergency pesticide registration fast-track | +0.6% | Brazil, spill-over to regional markets | Short term (≤ 2 years) |
| Surge in no-till acreage increases foliar fungicide need | +0.5% | Brazil, Argentina, Chile | Long term (≥ 4 years) |
| Commodity price hedging boosts grower spend on crop protection | +0.4% | Brazil, Argentina, Colombia | Medium term (2-4 years) |
| Carbon credit programs rewarding disease-free yields | +0.3% | Brazil, early adoption in Chile, Colombia | Long term (≥ 4 years) |
| Drone-based aerial spraying efficiency gains | +0.2% | Brazil, Argentina, expanding to Chile | Medium term (2-4 years) |
| Source: Mordor Intelligence | |||
Soybean Rust-Resistant Strains Push Higher Fungicide Dosages
Pathogen evolution in South America's soybean belt has accelerated resistance development against single-mode fungicides, forcing growers to increase application frequencies and adopt combination products. Brazilian research institutions documented 15 distinct Phakopsora pachyrhizi races in 2024, with 8 showing reduced sensitivity to triazole fungicides previously considered highly effective.[1]Source: Embrapa, “Soybean Rust Resistance Monitoring Report 2024,” embrapa.brThis resistance pressure drives a fundamental shift from prophylactic to intensive management protocols, where growers apply 3-4 fungicide treatments per season compared to 2-3 applications in previous decades. The economic impact extends beyond application costs, as resistant rust strains can reduce soybean yields by 10-80% without adequate protection, creating compelling Return on investment(ROI) justification for premium fungicide investments. Regulatory frameworks in Brazil and Argentina now mandate resistance monitoring protocols, requiring fungicide manufacturers to demonstrate stewardship programs that rotate modes of action and preserve long-term efficacy.
Brazil's Emergency Pesticide Registration Fast-Track
Brazil's regulatory modernization through Law 14.785/2024 introduced expedited registration pathways that reduce approval timelines from 8 years to 3 years for novel active ingredients with favorable toxicological profiles. Agência Nacional de Vigilância Sanitária(ANVISA) processed 67 emergency use authorizations for fungicides in 2024, compared to 23 in 2023, reflecting both regulatory efficiency gains and industry demand for rapid market access. This acceleration particularly benefits companies with robust data packages for biological fungicides, as the bioinputs framework provides additional fast-track provisions for naturally-derived active ingredients. The competitive implications favor multinational corporations with dedicated regulatory affairs capabilities, while creating barriers for smaller players lacking comprehensive toxicology databases. Regional harmonization efforts with Argentina and Chile suggest similar expedited frameworks may emerge across South America, potentially creating first-mover advantages for companies that establish regulatory precedents in Brazil.
Surge in No-Till Acreage Increases Foliar Fungicide Need
Conservation agriculture adoption across South America reached 70 million hectares in 2024, with no-till practices covering 85% of Brazil's soybean area and 75% of Argentina's grain production zones. Crop residue retention in no-till systems creates favorable microenvironments for fungal pathogen survival, increasing disease pressure that requires intensive foliar fungicide programs. Research from the University of São Paulo demonstrates that no-till soybean fields experience 40% higher fungal disease incidence compared to conventional tillage systems, driving additional fungicide applications worth USD 180 per hectare annually. The practice also delays canopy drying, extending leaf wetness periods that favor diseases like Asian soybean rust and white mold. Carbon sequestration benefits from no-till agriculture create economic incentives through emerging carbon credit markets, where verified soil carbon gains can offset increased crop protection costs by USD 50-80 per hectare.
Commodity Price Hedging Boosts Grower Spend on Crop Protection
Sophisticated risk management tools enable South American growers to lock in favorable commodity prices 12-18 months before harvest, providing financial certainty that supports premium fungicide investments. Chicago Mercantile Exchange data shows South American soybean futures contracts increased 35% in volume during 2024, with Brazilian and Argentine producers actively hedging 60-70% of anticipated production. This price security allows growers to justify higher per-hectare crop protection expenditures, knowing that revenue streams remain protected against market volatility. The strategy proves particularly effective for fungicide programs, where preventive applications require upfront investment with uncertain disease pressure outcomes. Cooperative purchasing programs in Brazil leverage collective hedging positions to negotiate volume discounts on fungicide packages, creating economies of scale that benefit smaller producers while maintaining premium product access.
Restraints Impact Analysis*
| Restraint | (~) % Impact on CAGR Forecast | Geographic Relevance | Impact Timeline |
|---|---|---|---|
| Fungicide-resistant pathogen populations | -0.70% | Brazil, Argentina, expanding regionally | Medium term (2-4 years) |
| Regulatory shift toward biologics over synthetics | -0.50% | Brazil, Chile, Colombia | Long term (≥ 4 years) |
| Anti-chemical consumer pressure on export markets | -0.40% | Chile, Brazil, Argentina | Medium term (2-4 years) |
| Supply-chain shocks in triazole raw materials | -0.30% | Regional impact from Asia-Pacific supply chains | Short term (≤ 2 years) |
| Source: Mordor Intelligence | |||
Fungicide-Resistant Pathogen Populations
Intensive fungicide use across South America's monoculture systems has accelerated resistance development, with 12 major fungal pathogens showing documented resistance to at least one chemical class by 2024. The Fungicide Resistance Action Committee identified South America as a high-risk region for resistance evolution, citing selection pressure from repeated applications of single-mode products across continuous cropping systems. Economic losses from resistance-induced fungicide failures reached USD 890 million across Brazil and Argentina in 2024, forcing growers to adopt more expensive combination products or increase application frequencies. Resistance management protocols now require mode-of-action rotation, reducing the commercial lifespan of individual fungicide products and increasing development costs for manufacturers. The situation creates opportunities for companies developing novel modes of action, while threatening revenue streams for generic manufacturers dependent on off-patent triazoles and strobilurins.
Regulatory Shift Toward Biologics Over Synthetics
Government policies across South America increasingly favor biological crop protection products through expedited registration processes and reduced regulatory fees. Brazil's bioinputs framework, established in 2024, provides 50% fee reductions for biological fungicide registrations and fast-track approval pathways that bypass certain toxicology requirements. This regulatory preference reflects environmental sustainability goals and export market demands for reduced chemical residues. Chile's agricultural export strategy explicitly targets organic and low-residue markets, creating incentives for growers to adopt biological alternatives even when synthetic options remain more cost-effective. The transition challenges established synthetic fungicide manufacturers while creating opportunities for biotechnology companies and integrated pest management service providers. However, biological products often require more frequent applications and show variable efficacy under high disease pressure, limiting adoption in intensive production systems.
*Our forecasts treat driver/restraint impacts as directional, not additive. The impact forecasts reflect baseline growth, mix effects, and variable interactions.
Segment Analysis
By Application Mode: Foliar Dominance Drives Innovation
Foliar treatments held 58% of the South America fungicides market in 2024 on account of their flexibility to tackle multiple pathogens in real time. Seed treatment occupies a smaller base but is the fastest rising at a 4.2% CAGR. The method's popularity stems from its cost-effectiveness and precise application capabilities, particularly in controlling diseases in pulses and oilseeds, where it has shown remarkable effectiveness against pathogens like Asian soybean rust and other foliar diseases. The segment's strength is further reinforced by its versatility across various crop types and its ability to provide both preventive and curative actions against fungal infections, making it a crucial plant protection chemical.
The foliar segment is projected to grow steadily because growers see quick, visible returns on investment during critical flowering stages. By contrast, seed treatment growth comes from long-term integrated pest protocols that combine fungicides with inoculants and micronutrients. The segment's expansion is further supported by the adoption of precision agriculture practices and the growing recognition of seed treatment's role in protecting seeds and young plants from diseases originating from seeds and soil. The effectiveness of seed treatment in preventing early-stage infections and improving crop emergence rates continues to drive its adoption across various crop types, solidifying its role as a key agricultural pesticide.
Drone-optimized suspension concentrates and ultra-low-volume formulations underpin next-generation foliar demand. Brazilian operators achieving 15% cost reductions compared to traditional ground-based equipment while improving coverage uniformity across uneven terrain.[2]Source: Brazilian Agricultural Aviation Association, “Drone Application Technology Report 2024,” sindag.org.br Soil treatment is gaining ground in Chilean vineyards and Colombian coffee estates where root rot pathogens threaten perennial assets. Chemigation retains niche relevance in drip-irrigated orchards, while fumigation remains confined to high-value greenhouse production.


By Crop Type: Oilseeds Leadership Faces Diversification
Pulses and oilseeds accounted for 45.8% of revenue in 2024, largely due to Brazil’s vast soybean acreage that depends on multi-spray rust control. Meanwhile, fruits and vegetables are forecast to expand at a 4.4% CAGR as Chile and Peru push export-oriented blueberry, avocado, and table-grape production. This significant market share is primarily driven by the extensive cultivation of soybeans across major agricultural nations like Brazil, Argentina, Paraguay, and Uruguay. Asian soybean rust alone can take away up to 80% yield if unmanaged, meaning growers often invest in combinations of triazoles, strobilurins, and SDHIs. The segment's prominence is further reinforced by the crops' high susceptibility to various fungal diseases, particularly the devastating Asian soybean rust, which can cause yield losses of up to 90%.
The fruits and vegetables segment is driven by increasing demand for high-quality fresh produce in both domestic and international markets. It will benefit from premium price incentives that offset higher per-hectare input costs. The segment's growth is particularly notable in crops such as tomatoes, potatoes, garlic, onions, lettuce, carrots, broccoli, as well as various fruits including citrus, stone fruits, and tropical varieties. The expansion is further fueled by the rising prevalence of fungal diseases such as Alternaria solani, Septoria leaf blight, angular leaf spot, powdery mildew, fruit rot, and downy mildew, which necessitate effective fungicide applications. The segment's growth is also supported by intensive cultivation practices and the increasing adoption of advanced fungicide application technologies to ensure optimal crop protection and yield enhancement.
Grains and cereals carry steady but slower demand tied to wheat scab and corn leaf blight management in Argentina’s Pampas. Turf and ornamental care is emerging as municipal green-space budgets climb, though volume is still modest. As diversification continues, suppliers are segmenting portfolios to match residue thresholds and pre-harvest interval requirements for each crop.
Geography Analysis
Brazil dominated the South America fungicides market with an 81.6% share in 2024, while Chile is the fastest-growing market at a projected 5.7% CAGR. Brazil is supported by 38 million hectares of soybeans and another 24 million hectares of corn that require intensive in-season treatments. Expedited approvals under Law 14.785 and local manufacturing capacity in São Paulo and Paraná buffer growers against global supply turmoil. Precision spraying tools and real-time disease alerts from satellite imagery are mainstream among large farming groups in Mato Grosso and Goiás. Rapid uptake of carbon-linked subsidy programs further encourages adoption of combination fungicides that preserve yield potential and sequestered soil carbon.
Argentina is leveraging the Pampas region’s deep soils for soybean and wheat output. Although currency swings hamper input purchasing power, cooperative hedging and government-backed credit lines sustain disease-control spending. Variable-rate applicators and drone surveillance help growers maintain high efficacy despite large field sizes. The government is aligning its registration pathways with Brazil, which will likely shorten time-to-market for new formulations by 2027.
Chile is fueled by fruit exporters racing to meet stricter European and North American residue regulations. Blueberry acreage in Biobío and Maule continues to expand, each harvest requiring multiple protective sprays against Botrytis and powdery mildew. Producers increasingly favor biofungicides and copper-based solutions, and they integrate weather-based forecasting to trim unnecessary applications. Colombia and Peru round out the core markets, each investing in coffee rust control and high-value vegetable exports. Harmonized Mercosur guidelines promise smoother cross-border registrations, allowing manufacturers to amortize data packages over several national markets.
Competitive Landscape
The market is consolidated, with the top five companies accounting for 65.5% of total revenue in 2024. Syngenta Group, at the forefront, showcases a diverse pipeline featuring both synthetic and biological products, bolstered by strong on-farm technical assistance. [3]Source: Syngenta Group, “Fungicide Innovation Pipeline 2025,” syngenta.com Close on its heels, Bayer is broadening its influence through digital platforms, seamlessly linking disease forecasts to customized product bundles. BASF SE, harnessing its newly sanctioned SDHI Revysol, is tackling triazole resistance issues and aligning its formulations with regulator-approved drone application protocols.
Corteva Agriscience is forging partnerships with cooperatives, securing multi-year supply contracts to ensure acreage commitment. Meanwhile, UPL Ltd is making strides by leveraging generic triazoles and bolstering its rural presence through recent distribution acquisitions. On the other hand, smaller innovators are carving a niche with microbial products and advanced delivery tools, including smart nozzles and electrostatic drones. As regional regulators push for stewardship plans to manage resistance, intellectual property in formulation science and data-driven agronomy services emerges as a key competitive advantage.
Companies are making strategic moves, from expanding fermentation capacities and forming local raw-material synthesis partnerships to venturing into digital carbon-credit platforms. Those adept at navigating regulatory landscapes, intensifying service offerings, and curating a distinct mode-of-action portfolio are poised to capture a larger market share, especially as resistance and residue challenges influence grower decisions.
South America Fungicide Industry Leaders
BASF SE
Bayer AG
Corteva Agriscience
Syngenta Group
UPL Limited
- *Disclaimer: Major Players sorted in no particular order

Recent Industry Developments
- January 2025: Syngenta Group announced a USD 150 million upgrade to its biological production hub in São Paulo, adding fermenters and quality-assurance labs that will triple the output of microbial fungicides for domestic and export markets.
- August 2025: BASF SE received ANVISA approval for mefentrifluconazole across major row crops and published drone application guidelines validated under tropical humidity conditions.
- July 2025: Corteva Agriscience partnered with Copersucar to supply integrated fungicide programs and resistance monitoring across 180,000 hectares of sugarcane, bundling variable-rate aerial services and on-site diagnostics.


South America Fungicide Market Report Scope
| Chemigation |
| Foliar |
| Fumigation |
| Seed Treatment |
| Soil Treatment |
| Commercial Crops |
| Fruits & Vegetables |
| Grains & Cereals |
| Pulses & Oilseeds |
| Turf & Ornamental |
| Argentina |
| Brazil |
| Chile |
| Rest of South America |
| Application Mode | Chemigation |
| Foliar | |
| Fumigation | |
| Seed Treatment | |
| Soil Treatment | |
| Crop Type | Commercial Crops |
| Fruits & Vegetables | |
| Grains & Cereals | |
| Pulses & Oilseeds | |
| Turf & Ornamental | |
| Country | Argentina |
| Brazil | |
| Chile | |
| Rest of South America |


Market Definition
- Function - Fungicides are chemicals used to control or prevent fungi from damaging the crop and prevent yield loss.
- Application Mode - Foliar, Seed Treatment, Soil Treatment, Chemigation, and Fumigation are the different type of application modes through which crop protection chemicals are applied to the crops.
- Crop Type - This represents the consumption of crop protection chemicals by Cereals, Pulses, Oilseeds, Fruits, Vegetables, Turf, and Ornamental crops.
| Keyword | Definition |
|---|---|
| IWM | Integrated weed management (IWM) is an approach to incorporate multiple weed control techniques throughout the growing season to give producers the best opportunity to control problematic weeds. |
| Host | Hosts are the plants that form relationships with beneficial microorganisms and help them colonize. |
| Pathogen | A disease-causing organism. |
| Herbigation | Herbigation is an effective method of applying herbicides through irrigation systems. |
| Maximum residue levels (MRL) | Maximum Residue Limit (MRL) is the maximum allowed limit of pesticide residue in food or feed obtained from plants and animals. |
| IoT | The Internet of Things (IoT) is a network of interconnected devices that connect and exchange data with other IoT devices and the cloud. |
| Herbicide-tolerant varieties (HTVs) | Herbicide-tolerant varieties are plant species that have been genetically engineered to be resistant to herbicides used on crops. |
| Chemigation | Chemigation is a method of applying pesticides to crops through an irrigation system. |
| Crop Protection | Crop protection is a method of protecting crop yields from different pests, including insects, weeds, plant diseases, and others that cause damage to agricultural crops. |
| Seed Treatment | Seed treatment helps to disinfect seeds or seedlings from seed-borne or soil-borne pests. Crop protection chemicals, such as fungicides, insecticides, or nematicides, are commonly used for seed treatment. |
| Fumigation | Fumigation is the application of crop protection chemicals in gaseous form to control pests. |
| Bait | A bait is a food or other material used to lure a pest and kill it through various methods, including poisoning. |
| Contact Fungicide | Contact pesticides prevent crop contamination and combat fungal pathogens. They act on pests (fungi) only when they come in contact with the pests. |
| Systemic Fungicide | A systemic fungicide is a compound taken up by a plant and then translocated within the plant, thus protecting the plant from attack by pathogens. |
| Mass Drug Administration (MDA) | Mass drug administration is the strategy to control or eliminate many neglected tropical diseases. |
| Mollusks | Mollusks are pests that feed on crops, causing crop damage and yield loss. Mollusks include octopi, squid, snails, and slugs. |
| Pre-emergence Herbicide | Preemergence herbicides are a form of chemical weed control that prevents germinated weed seedlings from becoming established. |
| Post-emergence Herbicide | Postemergence herbicides are applied to the agricultural field to control weeds after emergence (germination) of seeds or seedlings. |
| Active Ingredients | Active ingredients are the chemicals in pesticide products that kill, control, or repel pests. |
| United States Department of Agriculture (USDA) | The Department of Agriculture provides leadership on food, agriculture, natural resources, and related issues. |
| Weed Science Society of America (WSSA) | The WSSA, a non-profit professional society, promotes research, education, and extension outreach activities related to weeds. |
| Suspension concentrate | Suspension concentrate (SC) is one of the formulations of crop protection chemicals with solid active ingredients dispersed in water. |
| Wettable powder | A wettable powder (WP) is a powder formulation that forms a suspension when mixed with water prior to spraying. |
| Emulsifiable concentrate | Emulsifiable concentrate (EC) is a concentrated liquid formulation of pesticide that needs to be diluted with water to create a spray solution. |
| Plant-parasitic nematodes | Parasitic Nematodes feed on the roots of crops, causing damage to the roots. These damages allow for easy plant infestation by soil-borne pathogens, which results in crop or yield loss. |
| Australian Weeds Strategy (AWS) | The Australian Weeds Strategy, owned by the Environment and Invasives Committee, provides national guidance on weed management. |
| Weed Science Society of Japan (WSSJ) | WSSJ aims to contribute to the prevention of weed damage and the utilization of weed value by providing the chance for research presentation and information exchange. |


Research Methodology
Mordor Intelligence follows a four-step methodology in all our reports.
- Step-1: Identify Key Variables: In order to build a robust forecasting methodology, the variables and factors identified in Step-1 are tested against available historical market numbers. Through an iterative process, the variables required for market forecast are set and the model is built on the basis of these variables.
- Step-2: Build a Market Model: Market-size estimations for the forecast years are in nominal terms. Inflation is not a part of the pricing, and the average selling price (ASP) is kept constant throughout the forecast period.
- Step-3: Validate and Finalize: In this important step, all market numbers, variables and analyst calls are validated through an extensive network of primary research experts from the market studied. The respondents are selected across levels and functions to generate a holistic picture of the market studied.
- Step-4: Research Outputs: Syndicated Reports, Custom Consulting Assignments, Databases & Subscription Platforms


