South America Crop Protection Chemicals Market Size and Share
Market Overview
| Study Period | 2017 - 2030 |
|---|---|
| Forecast Data Period | 2025 - 2030 |
| Historical Data Period | 2017 - 2023 |
| Market Size (2025) | USD 44.30 Billion |
| Market Size (2030) | USD 56.04 Billion |
| Growth Rate (2025 - 2030) | 4.78% CAGR |
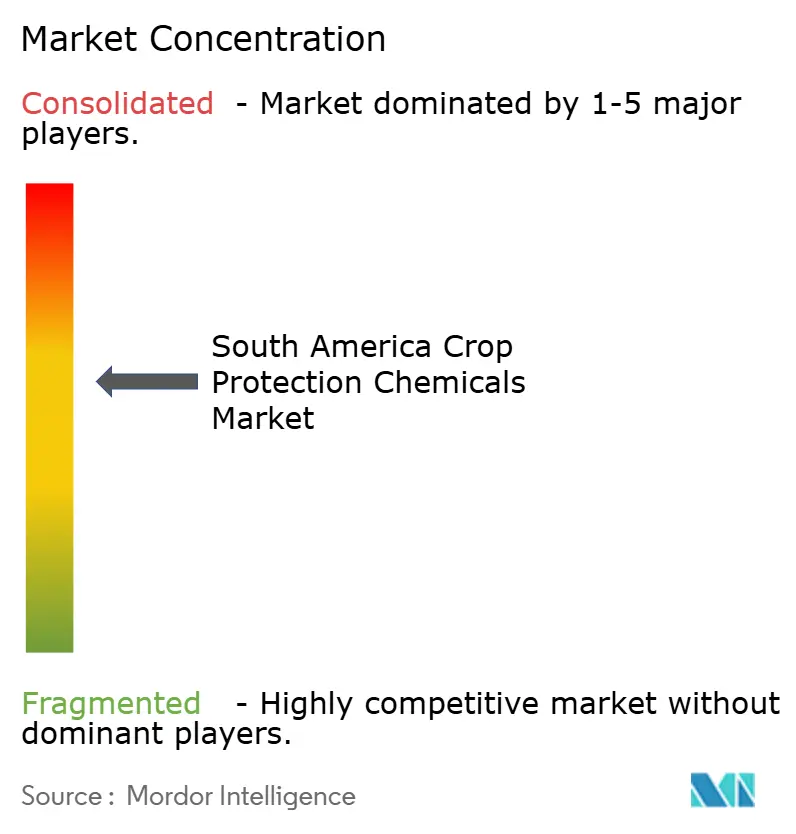
| Market Concentration | Medium |
Major Players *Disclaimer: Major Players sorted in no particular order Image © Mordor Intelligence. Reuse requires attribution under CC BY 4.0. | |

South America Crop Protection Chemicals Market Analysis by Mordor Intelligence
The South America crop protection chemicals market size stood at USD 44.30 billion in 2025 and is projected to reach USD 56.04 billion by 2030, reflecting a 4.78% CAGR over the forecast period. Sustained soybean expansion in Brazil, rapid herbicide-tolerant genetically modified seed adoption, and integration of biological inputs with conventional chemistry anchor growth. Large commercial farms continue to prioritize efficiency, so demand concentrates on high-value herbicides and newer fungicide modes that address mounting resistance. Currency volatility and supply disruptions from China raise input costs, yet competitive farm economics keep overall chemical usage resilient. Digital agriculture and precision application technologies are gaining traction, optimizing spray timing and minimizing off-target losses. [1]Source: Reuters Staff, “Brazil Soybean Exports Hit Record in 2024,” Reuters, reuters.com
Key Report Takeaways
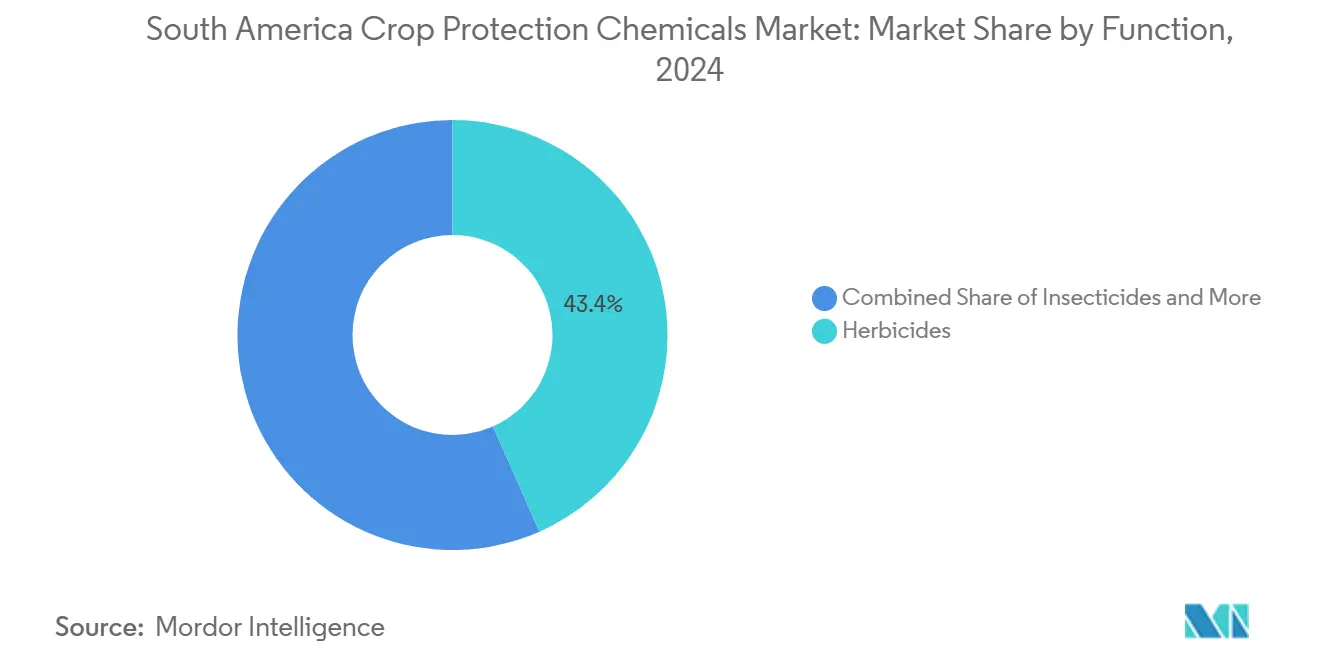
- By function, herbicides held 43.36% of the South America crop protection chemicals market share in 2024, while molluscicides are forecast to register the fastest 6.11% CAGR through 2030.
- By application mode, foliar spraying accounted for 42.3% share of the South America crop protection chemicals market size in 2024, while soil treatment is projected to expand at a 5.22% CAGR between 2025 and 2030.
- By crop type, pulses and oilseeds commanded 48.1% share of the South America crop protection chemicals market size in 2024 and are advancing at a 4.91% CAGR through 2030.
- By geography, Brazil led with 77.7% of regional revenue in 2024, while Argentina records the fastest 5.48% CAGR to 2030.
South America Crop Protection Chemicals Market Trends and Insights
Drivers Impact Analysis*
| Driver | (~) % Impact on CAGR Forecast | Geographic Relevance | Impact Timeline |
|---|---|---|---|
| Rising herbicide-tolerant Genetically Modified (GM) seed adoption | +1.2% | Brazil and Argentina | Medium term (2-4 years) |
| Expansion of soybean acreage in Brazil | +0.8% | Cerrado region | Long term (≥ 4 years) |
| Biopesticide integration into chemical spray programs | +0.7% | Regional | Medium term (2-4 years) |
| Climate-Driven Pest Migration Toward Southern Cone | +0.6% | Argentina and Chile | Short term (≤ 2 years) |
| AI-enabled variable-rate application systems | +0.5% | Brazil and Argentina | Medium term (2-4 years) |
| Carbon-credit premiums for low-impact chemistry | +0.4% | Brazil and Colombia | Long term (≥ 4 years) |
| Source: Mordor Intelligence | |||
Rising Herbicide-Tolerant Genetically Modified (GM) Seed Adoption
Herbicide-tolerant traits covered 30% of Brazilian soybean hectares in 2024, fueling premium demand for dicamba and 2,4-D systems that complement glyphosate. Bundled trait licenses with herbicide recommendations simplify farmer decisions and lock in consistent chemistry purchases. Similar approvals in Argentina and Paraguay widen the addressable base, reinforcing upside for the South America crop protection chemicals market.
Expansion of Soybean Acreage in Brazil
Brazil's soybean planted area expanded by 2.1 million hectares in 2024 from 2023, reaching 45.2 million hectares as producers converted pastureland and secondary forest areas in the MATOPIBA (Maranhão, Tocantins, Piauí, and Bahia) region. This expansion occurs in regions with higher pest pressure and different climatic conditions than traditional growing areas, necessitating adjusted spray programs and increased fungicide applications. The Brazilian government's infrastructure investments in the Ferrogrão railway project will reduce transportation costs from interior production areas, improving farmer economics and supporting continued acreage expansion. Double-cropping systems with corn following soybeans create year-round chemical demand, with winter corn acreage reaching 15.8 million hectares in 2024.
Biopesticide Integration into Chemical Spray Programs
Integrated pest management protocols combining biological and chemical solutions gained adoption across 18.5 million hectares in South America during 2024, driven by resistance management needs and sustainability certification requirements. Bioceres Crop Solutions' inactivated-microbe technology platform demonstrates efficacy when tank-mixed with reduced-rate synthetic fungicides, maintaining disease control while extending chemical product lifecycles. Carbon credit programs offered by Bayer's Carbon Initiative and similar platforms provide farmers USD 15-25 per hectare premiums for adopting biological inputs, creating economic incentives beyond agronomic benefits. This integration approach addresses regulatory pressure while maintaining the convenience and reliability that farmers expect from chemical solutions.
Climate-Driven Pest Migration Toward Southern Cone
Shifting precipitation patterns and temperature increases have accelerated pest migration from tropical regions toward temperate growing areas in Argentina and Chile, creating new market opportunities for specialized chemistry. Fall armyworm pressure in Argentine corn production increased 35% in 2024 compared to historical averages, driving increased insecticide applications and adoption of refuge management protocols. Slug populations in Chilean wheat production expanded southward due to increased moisture retention, supporting molluscicide market growth in previously unaffected regions. These pest shifts require farmers to adopt new active ingredients and application timings, creating opportunities for companies with specialized product portfolios and technical service capabilities.
Restraints Impact Analysis*
| Restraint | (~) % Impact on CAGR Forecast | Geographic Relevance | Impact Timeline |
|---|---|---|---|
| Rising resistance to Group-3 triazoles | −0.9% | Brazil and Argentina | Short term (≤ 2 years) |
| Stricter Maximum Residue Limits (MRL) enforcement by European Union importers | −0.7% | Brazil and Chile | Medium term (2-4 years) |
| Supply-chain volatility for active ingredients | −0.6% | Regional | Short term (≤ 2 years) |
| Currency depreciation on farm inputs | −0.5% | Argentina and Brazil | Short term (≤ 2 years) |
| Source: Mordor Intelligence | |||
Rising Resistance to Group-3 Triazoles
Demethylation inhibitor fungicide resistance in Brazilian soybean production has reached critical thresholds, with Asian soybean rust populations showing reduced sensitivity to tebuconazole and other triazole actives across 65% of monitored fields in 2024. This resistance development forces farmers to increase application rates, adopt tank-mix strategies, or switch to alternative modes of action, increasing per-hectare treatment costs by 25-40% in affected regions. Regulatory bodies, including Brazil's National Health Surveillance Agency, have implemented resistance monitoring protocols that may restrict triazole usage patterns, accelerating the transition to newer chemistry platforms. Companies with novel fungicide modes of action, such as BASF's Revysol technology, gain competitive advantages as resistance pressures intensify.
Stricter Maximum Residue Limits (MRL) enforcement by European Union importers
European Union maximum residue limit enforcement tightened in 2024, with rejection rates for Brazilian soybean shipments increasing 18% due to trace detections of banned active ingredients including paraquat and carbendazim. These rejections create supply chain disruptions and force producers to adopt more expensive, EU-compliant chemistry programs that reduce profit margins by USD 35-50 per hectare. Certification programs such as the Responsible Soy Standard require documented spray records and residue testing, adding administrative costs and complexity to farm operations. This regulatory pressure accelerates adoption of biological solutions and lower-residue synthetic alternatives, benefiting companies with compliant product portfolios while constraining traditional chemistry usage.
*Our forecasts treat driver/restraint impacts as directional, not additive. The impact forecasts reflect baseline growth, mix effects, and variable interactions.
Segment Analysis
By Function: Herbicides Secure Revenue Leadership
Herbicides contributed 43.3% of South America crop protection chemicals market share in 2024, underpinned by soybean monoculture that relies on broad-spectrum knockdown and selective modes. Glyphosate holds volume leadership, yet value migrates to dicamba and 2,4-D blends optimized for stacked traits. New mode launches such as BASF’s dimpropyridaz enable rotation and resistance stewardship. Molluscicides, while contributing small portion of the market, represent the fastest growing 6.1% CAGR through 2030 as wetter southern climates spur slug outbreaks.
The competitive mix shows leading innovators pairing synthetic and biological offerings in single-pack formulations. Fungicide demand remains strong across 38.2 million hectares of soybeans although portfolio sales depend on replacing triazoles with SDHI and quinone outside inhibitors. Insecticide volumes vary with pest pressure but stay vital in corn, cotton, and specialty horticulture. Nematicide adoption rises in intensive vegetable belts, leveraging precise soil-applied technologies.


By Application Mode: Foliar Dominance with Soil Treatment Upside
Foliar spraying accounted for 42.3% of South America crop protection chemicals market share in 2024, owing to operational ease on large farms. Ground rigs remain standard although aerial fleets service remote Cerrado operations where 1,000-hectare fields favor aircraft coverage. Soil treatment is the fastest growing segment with a CAGR of 5.2% during the forecast period, boosted by GPS-enabled variable-rate equipment that calibrates dose to localized pest incidence and reduces run-off. Seed treatment adoption deepens as growers chase early season protection that curbs in-season sprays.
Chemigation adoption climbs in high-value orchards and vegetables due to uniform distribution and water synergy. Fumigation use is niche and highly regulated but retains value in intensive horticulture and stored grain protection. Product development now focuses on formulation compatibility with electrostatic sprayers and drone platforms.

By Crop Type: Pulses and Oilseeds Anchor Demand
Pulses and oilseeds, led by soybean, generated 48.1% of South America crop protection chemicals market share in 2024 and will expand at a 4.9% CAGR through 2030. Soybean commands more than 60% of herbicide usage and drive ongoing fungicide innovation. Double-cropping with corn magnifies chemical throughput per hectare and supports insecticide demand. Grains and cereals remain essential, accounting for 28% of total revenue and benefitting from fall armyworm countermeasures.
Commercial crops such as sugarcane and cotton add premium revenue streams requiring tailored herbicide and insecticide regimes. Fruits and vegetables, though smaller in area, deliver the highest value per hectare and push adoption of biological solutions to satisfy export residue standards. Turf and ornamental demand grows steadily within urban landscaping programs in Brazil and Argentina.

Geography Analysis
Brazil held 77.7% share of South America crop protection chemicals market revenue in 2024, riding on 85 million hectares of cultivated acreage. Regulatory reform under Law 14.785 compresses approval timelines to 3–4 years and accelerates new mode entry. Biopesticide adoption reached 18.5 million hectares in 2024 as integrated pest management gains traction. Expansion in MATOPIBA (Maranhão, Tocantins, Piauí, and Bahia) and improved rail logistics underpin long-term chemical intensity.
Argentina is the fastest-growing country with 5.4% CAGR during the forecast period. Resolution 694/2024 eased registration equivalence and cut import tariffs for active ingredients, while currency stabilization measures improve grower purchasing power. Precision farming and herbicide-tolerant traits support volume gains, and climate-shifted pest profiles open markets for specialty insecticides and molluscicides.
Chile’s specialty export crops demand premium low-residue programs. Strict SAG (Servicio Agrícola y Ganadero) oversight enforces compliance and favors biological offerings. Colombia, Peru, and Uruguay round out the Rest of South America cluster, with gains tied to palm oil, asparagus, and beef pasture intensification. Smaller markets serve as pilot zones for innovative modes before broader regional rollout.[2]Source: Argentina Ministry of Agriculture, “Resolution 694/2024,” argentina.gob.ar
Competitive Landscape
The South America crop protection chemicals market exhibits medium concentration; the top five suppliers controlled around 40% of the revenue in 2024. Syngenta Group leads, leveraging an integrated package of proprietary chemistry, biologicals, and digital agronomy. BASF SE, Bayer AG, Corteva Agriscience, and FMC Corporation round out the top tier, each emphasizing resistance-breaking actives and precision application partnerships. Companies are heavily focused on product innovation, particularly in developing new active ingredients and crop protection formulations to address evolving pest resistance challenges and environmental concerns.
Patent expiries on glufosinate and selected fungicides draw generic entrants, especially from India and China. UPL Limited., and ADAMA Agricultural Solutions Ltd. scale post-patent portfolios, while Bioceres and local firms focus on microbial platforms. BASF SE FieldManager and Bayer AG Climate FieldView embed decision tools that boost product stickiness. Local manufacturing expansions, such as Syngenta Group’s USD 200 million biologicals plant in São Paulo, strengthen supply security and compliance with shifting residue regulations.
Strategic partnerships and collaborations, especially between multinational corporations and local distributors, have emerged as a key trend to enhance market penetration and technical support capabilities. Companies are also expanding their presence through research and development centers, particularly in Brazil and Argentina, while simultaneously strengthening their digital agriculture platforms to provide integrated crop protection solutions. [3]Source: BASF Digital Farming, “FieldManager Platform,” basf.com
South America Crop Protection Chemicals Industry Leaders
BASF SE
Bayer AG
Corteva Agriscience
FMC Corporation
Syngenta Group
- *Disclaimer: Major Players sorted in no particular order

Recent Industry Developments
- July 2025: In the 2024/2025 crop season, 16 research institutions across 19 locations found that judicious fungicide application boosted soybean yields, despite a high prevalence of the target spot disease, attributed to the fungus Corynespora cassiicola.
- March 2025: BASF SE introduced Efficon fungicide with the novel active dimpropyridaz across Brazil and Argentina, investing USD 150 million in regional launch activities and positioning the product for Asian soybean rust control and resistance rotation.
- January 2025: Corteva Agriscience secured Argentine approval for Enlist E3 soybeans, opening a 12 million-hectare market for linked 2,4-D and glyphosate herbicide programs.


South America Crop Protection Chemicals Market Report Scope
| Fungicides |
| Herbicides |
| Insecticides |
| Molluscicide |
| Nematicide |
| Chemigation |
| Foliar |
| Fumigation |
| Seed Treatment |
| Soil Treatment |
| Commercial Crops |
| Fruits & Vegetables |
| Grains & Cereals |
| Pulses & Oilseeds |
| Turf & Ornamental |
| Argentina |
| Brazil |
| Chile |
| Rest of South America |
| Function | Fungicides |
| Herbicides | |
| Insecticides | |
| Molluscicide | |
| Nematicide | |
| Application Mode | Chemigation |
| Foliar | |
| Fumigation | |
| Seed Treatment | |
| Soil Treatment | |
| Crop Type | Commercial Crops |
| Fruits & Vegetables | |
| Grains & Cereals | |
| Pulses & Oilseeds | |
| Turf & Ornamental | |
| Country | Argentina |
| Brazil | |
| Chile | |
| Rest of South America |


Market Definition
- Function - Crop Protection Chemicals are apllied to control or prevent pests, including insects, fungi, weeds, nematodes, and mollusks, from damaging the crop and to protect the crop yield.
- Application Mode - Foliar, Seed Treatment, Soil Treatment, Chemigation, and Fumigation are the different type of application modes through which crop protection chemicals are applied to the crops.
- Crop Type - This represents the consumption of crop protection chemicals by Cereals, Pulses, Oilseeds, Fruits, Vegetables, Turf, and Ornamental crops.
| Keyword | Definition |
|---|---|
| IWM | Integrated weed management (IWM) is an approach to incorporate multiple weed control techniques throughout the growing season to give producers the best opportunity to control problematic weeds. |
| Host | Hosts are the plants that form relationships with beneficial microorganisms and help them colonize. |
| Pathogen | A disease-causing organism. |
| Herbigation | Herbigation is an effective method of applying herbicides through irrigation systems. |
| Maximum residue levels (MRL) | Maximum Residue Limit (MRL) is the maximum allowed limit of pesticide residue in food or feed obtained from plants and animals. |
| IoT | The Internet of Things (IoT) is a network of interconnected devices that connect and exchange data with other IoT devices and the cloud. |
| Herbicide-tolerant varieties (HTVs) | Herbicide-tolerant varieties are plant species that have been genetically engineered to be resistant to herbicides used on crops. |
| Chemigation | Chemigation is a method of applying pesticides to crops through an irrigation system. |
| Crop Protection | Crop protection is a method of protecting crop yields from different pests, including insects, weeds, plant diseases, and others that cause damage to agricultural crops. |
| Seed Treatment | Seed treatment helps to disinfect seeds or seedlings from seed-borne or soil-borne pests. Crop protection chemicals, such as fungicides, insecticides, or nematicides, are commonly used for seed treatment. |
| Fumigation | Fumigation is the application of crop protection chemicals in gaseous form to control pests. |
| Bait | A bait is a food or other material used to lure a pest and kill it through various methods, including poisoning. |
| Contact Fungicide | Contact pesticides prevent crop contamination and combat fungal pathogens. They act on pests (fungi) only when they come in contact with the pests. |
| Systemic Fungicide | A systemic fungicide is a compound taken up by a plant and then translocated within the plant, thus protecting the plant from attack by pathogens. |
| Mass Drug Administration (MDA) | Mass drug administration is the strategy to control or eliminate many neglected tropical diseases. |
| Mollusks | Mollusks are pests that feed on crops, causing crop damage and yield loss. Mollusks include octopi, squid, snails, and slugs. |
| Pre-emergence Herbicide | Preemergence herbicides are a form of chemical weed control that prevents germinated weed seedlings from becoming established. |
| Post-emergence Herbicide | Postemergence herbicides are applied to the agricultural field to control weeds after emergence (germination) of seeds or seedlings. |
| Active Ingredients | Active ingredients are the chemicals in pesticide products that kill, control, or repel pests. |
| United States Department of Agriculture (USDA) | The Department of Agriculture provides leadership on food, agriculture, natural resources, and related issues. |
| Weed Science Society of America (WSSA) | The WSSA, a non-profit professional society, promotes research, education, and extension outreach activities related to weeds. |
| Suspension concentrate | Suspension concentrate (SC) is one of the formulations of crop protection chemicals with solid active ingredients dispersed in water. |
| Wettable powder | A wettable powder (WP) is a powder formulation that forms a suspension when mixed with water prior to spraying. |
| Emulsifiable concentrate | Emulsifiable concentrate (EC) is a concentrated liquid formulation of pesticide that needs to be diluted with water to create a spray solution. |
| Plant-parasitic nematodes | Parasitic Nematodes feed on the roots of crops, causing damage to the roots. These damages allow for easy plant infestation by soil-borne pathogens, which results in crop or yield loss. |
| Australian Weeds Strategy (AWS) | The Australian Weeds Strategy, owned by the Environment and Invasives Committee, provides national guidance on weed management. |
| Weed Science Society of Japan (WSSJ) | WSSJ aims to contribute to the prevention of weed damage and the utilization of weed value by providing the chance for research presentation and information exchange. |


Research Methodology
Mordor Intelligence follows a four-step methodology in all our reports.
- Step-1: Identify Key Variables: In order to build a robust forecasting methodology, the variables and factors identified in Step-1 are tested against available historical market numbers. Through an iterative process, the variables required for market forecast are set and the model is built on the basis of these variables.
- Step-2: Build a Market Model: Market-size estimations for the forecast years are in nominal terms. Inflation is not a part of the pricing, and the average selling price (ASP) is kept constant throughout the forecast period.
- Step-3: Validate and Finalize: In this important step, all market numbers, variables and analyst calls are validated through an extensive network of primary research experts from the market studied. The respondents are selected across levels and functions to generate a holistic picture of the market studied.
- Step-4: Research Outputs: Syndicated Reports, Custom Consulting Assignments, Databases & Subscription Platforms


