Market Overview
| Study Period | 2021 - 2031 |
|---|---|
| Forecast Data Period | 2026 - 2031 |
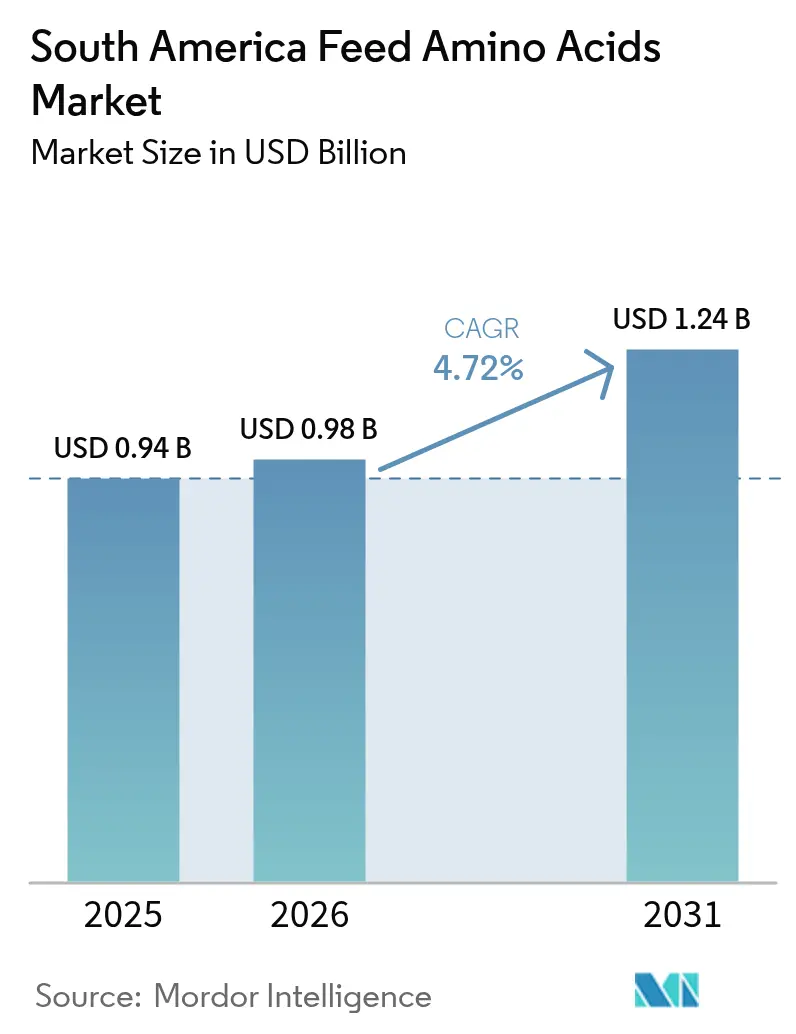
| Base Year Market Size (2025) | USD 0.94 Billion |
| Market Size (2026) | USD 0.98 Billion |
| Market Size (2031) | USD 1.24 Billion |
| Growth Rate (2026 - 2031) | 4.72% CAGR |
| Market Concentration | Low |
Major Players *Disclaimer: Major Players sorted in no particular order Image © Mordor Intelligence. Reuse requires attribution under CC BY 4.0. | |
South America Feed Amino Acids Market Analysis by Mordor Intelligence
The South American feed amino acids market size is expected to grow from USD 0.94 billion in 2025 to USD 0.98 billion in 2026 and is forecast to reach USD 1.24 billion by 2031 at 4.72% CAGR over 2026-2031. The market growth stems from increased regional meat consumption, strong poultry exports, and improved feed milling infrastructure. Brazil's integrated corn and soybean supply chain maintains competitive input costs, while Argentina's precision livestock practices and Chile's salmon farming sector contribute to market expansion. Regional trade policies, including lower tariffs on essential nutrients and investments in local fermentation facilities, help reduce currency-related risks for importers. Despite challenges from exchange-rate fluctuations and disease outbreaks, the market maintains positive long-term prospects. Growth factors include precision feeding technology adoption, environmental regulation compliance, and aquaculture diversification. These developments drive consistent demand for amino acids, particularly lysine and methionine, which enhance feed efficiency and animal health.[1]Source: Brazilian Agricultural Research Corporation, “Feedgrain Trends and Animal Nutrition Metrics 2025,” embrapa.br The South America feed amino acids market continues to expand as producers implement cost-effective and sustainable nutrition strategies, supported by domestic innovation and global market competitiveness.
Key Report Takeaways
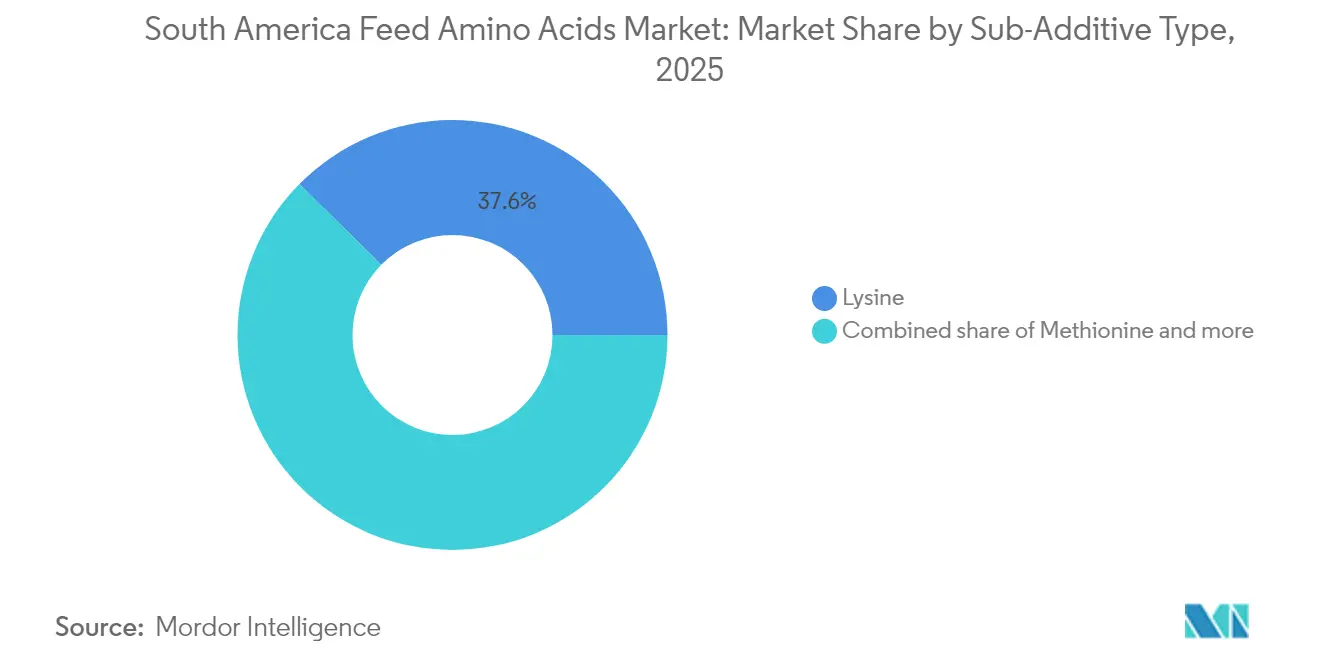
- By sub-additive type, lysine commanded 37.62% of the South America feed amino acids market share in 2025, whereas methionine is projected to expand at a 4.96% CAGR through 2031.
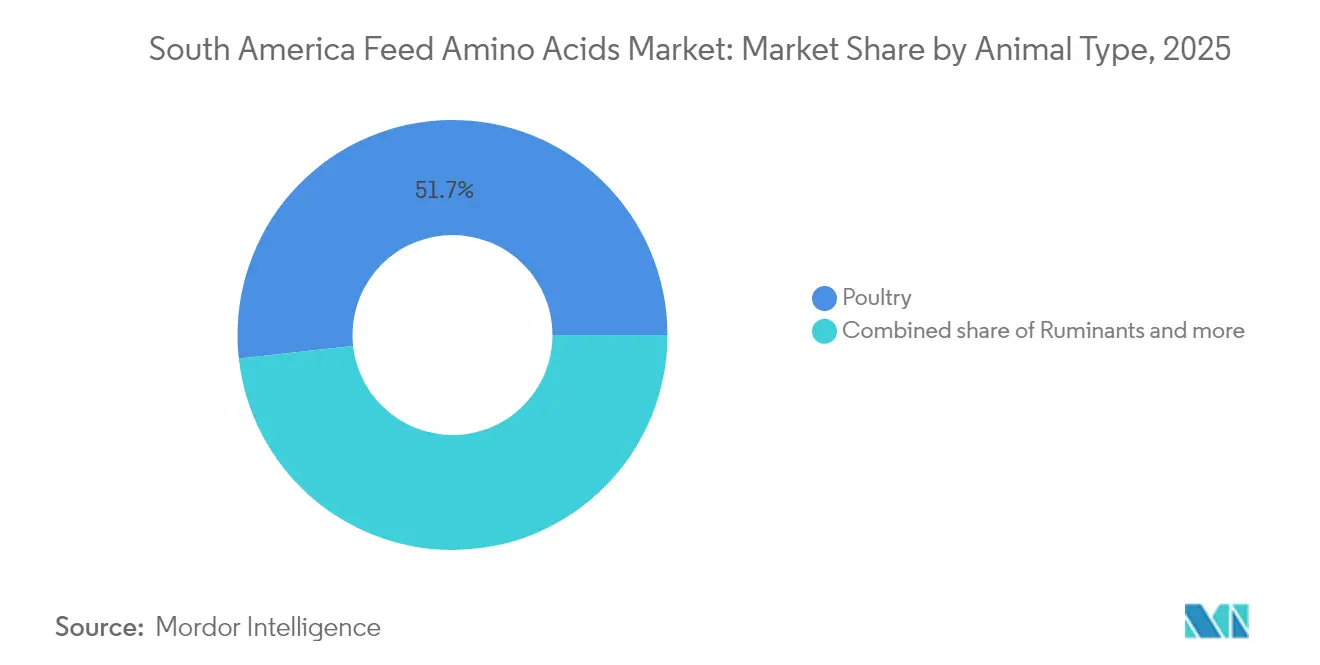
- By animal type, poultry accounted for a 51.75% share of the South America feed amino acids market size in 2025, and ruminants are advancing at a 5.14% CAGR to 2031.
- By geography, Brazil led with 48.65% revenue share in 2025; Chile is forecast to progress at a 5.29% CAGR over the outlook period.
Note: Market size and forecast figures in this report are generated using Mordor Intelligence’s proprietary estimation framework, updated with the latest available data and insights as of 2026.
South America Feed Amino Acids Market Trends and Insights
Drivers Impact Analysis*
| Driver | (~) % Impact on CAGR Forecast | Geographic Relevance | Impact Timeline |
|---|---|---|---|
| Increasing Poultry-meat Demand | +1.2% | Brazil, Argentina, and Chile | Medium term (2-4 years) |
| Rise in Premix-feed Mills | +0.8% | Brazil, Argentina, and Rest of South America | Short term (≤ 2 years) |
| Expansion of Soy-crushing Capacity | +0.7% | Brazil and Argentina | Long term (≥ 4 years) |
| Easing Import Tariffs on Essential Feed Nutrients | +0.6% | Argentina, Chile, and Rest of South America | Short term (≤ 2 years) |
| Adoption of Precision Livestock Farming | +0.5% | Brazil and Argentina | Medium term (2-4 years) |
| Fermentation Cost Breakthroughs in Regional Plants | +0.4% | Brazil and Argentina | Long term (≥ 4 years) |
| Source: Mordor Intelligence | |||


Increasing Poultry-meat Demand
The rising global demand for poultry meat is driving significant growth in amino acid usage across South America's feed industry. Broiler production continues to expand, especially in Brazil and Argentina, where integrated systems focus on export-grade carcass quality. Improvements in bird genetics and stocking density have led to tighter amino acid specifications, particularly for lysine and methionine, which are essential for efficient feed conversion. Feed manufacturers are reducing crude protein levels while increasing synthetic amino acids to reduce nitrogen emissions, comply with animal welfare standards, and manage soybean meal cost fluctuations.[2]Source: Brazilian Agricultural Research Corporation, “Industrial fermentation cost benchmarks 2025,” embrapa.br Export buyers now require greater transparency in feed practices, prompting producers to adopt precision-feeding routines that rely on amino acid optimization. These data-driven strategies improve animal performance and ensure consistency in meeting international quality benchmarks. As poultry remains the primary protein source, its influence on amino acid demand continues to shape the South America feed additives market.
Rise in Premix‐feed Mills
The expansion of premix feed mills across South America is transforming amino acid distribution and utilization. Regions like Paraná, Santa Catarina, and Córdoba have seen an increase in specialized facilities that shorten supply chains and improve nutrient accuracy. These premix sites deliver species-specific concentrates quickly, helping producers respond to changing nutritional needs. Local production reduces financial pressure on smaller feed mills by reducing order sizes and lead times. The integration of cloud-based formulation platforms enables manufacturers to adjust amino acid blends based on real-time farm performance data. This enables faster product rotation and improves feed efficiency. The growth of premix infrastructure indicates market confidence, particularly as producers seek precise nutrition strategies. By supporting customized formulations and improving access to high-quality inputs, premix mills strengthen domestic manufacturing and drive sustained amino acid demand across the region.
Expansion of Soy-crushing Capacity
South America's growing soy-crushing capacity is reinforcing the foundation of its feed amino acids market. Brazil and Argentina have significantly expanded processing volumes, increasing the availability of soybean meal for livestock feed. While soybean meal provides a strong protein base, it often lacks sufficient lysine, requiring formulators to supplement with synthetic amino acids. Argentina's policy incentives favor value-added processing, encouraging investment in meal and oil production over raw bean exports. This shift increases plant utilization rates and supports domestic feed manufacturing. The abundance of locally sourced meals allows producers to reduce reliance on imported fish meal, lowering costs and improving sustainability. By balancing amino acid profiles with targeted additions, feed companies optimize animal performance while maintaining economic efficiency. The expansion of soy-crushing infrastructure strengthens supply chains and ensures consistent access to key feed components.
Easing Import Tariffs on Essential Feed Nutrients
Recent policy reforms across South America are improving access to essential feed nutrients, including amino acids. Argentina's decision to waive import duties on critical inputs has reduced landed costs, offering financial relief to livestock producers. Chile has streamlined its regulatory framework, aligning additive inclusion limits with international standards and simplifying approval processes. These changes benefit mid-sized feed mills and aquaculture operators, who often face administrative hurdles and budget constraints. By lowering barriers to entry, governments are encouraging broader adoption of amino acid formulations and increasing market competition. This regulatory support improves supply chain efficiency and promotes innovation in feed strategies. As producers seek cost-effective solutions to meet rising performance and sustainability demands, easier access to high-quality additives becomes crucial.
Restraints Impact Analysis*
| Restraint | (~) % Impact on CAGR Forecast | Geographic Relevance | Impact Timeline |
|---|---|---|---|
| Currency Volatility vs. Dollar-denominated Amino Acids | -0.9% | Argentina, Brazil, and Rest of South America | Short term (≤ 2 years) |
| Disease-shock Demand Swings (AI, FMD) | -0.6% | Brazil, Argentina, and Chile | Short term (≤ 2 years) |
| Port Bottlenecks During Peak Grain Export Season | -0.5% | Brazil and Argentina | Medium term (2-4 years) |
| Consumer Shift Toward Antibiotic-free Meat Limiting Synthetic Additives | -0.3% | Brazil and Chile | Long term (≥ 4 years) |
| Source: Mordor Intelligence | |||
Currency Volatility vs. Dollar-denominated Amino Acids
Currency fluctuations remain a significant challenge for South American feed producers who purchase amino acids priced in the United States dollars. When local currencies like the Argentine peso or Brazilian real depreciate, the cost of imported lysine, methionine, and other amino acids rises sharply. This forces feed mills to reformulate rations, ration inventory, or delay purchases, disrupting production schedules and reducing throughput. Smaller operators without access to financial hedging tools are especially vulnerable, often facing stockouts that impact animal performance. While Brazil's partial domestic production offers some protection, niche amino acids such as valine and isoleucine still rely heavily on imports. These financial pressures complicate long-term planning and increase buyer risk. Until macroeconomic conditions stabilize, currency volatility will continue to influence purchasing decisions and supply chain reliability.
Disease-shock Demand Swings (AI, FMD)
Disease outbreaks such as avian influenza and foot-and-mouth disease create sudden and unpredictable shifts in feed demand across South America. When export bans or livestock movement restrictions are imposed, producers often withdraw feed from affected flocks or herds, leading to abrupt drops in amino acid consumption. These events complicate supplier forecasting and strain inventory management, especially for mills operating on tight margins. While preventive measures like vaccination and enhanced biosecurity protocols help reduce the frequency and severity of outbreaks, they cannot fully eliminate the risk. The feed amino acids market must remain agile, balancing long-term growth drivers with health-related disruptions. Producers and suppliers are investing in contingency planning and flexible logistics to navigate these challenges. Despite the episodic nature of disease outbreaks, the underlying demand for amino acids remains strong, supported by structural trends in livestock expansion, export growth, and nutritional innovation across the region.
*Our forecasts treat driver/restraint impacts as directional, not additive. The impact forecasts reflect baseline growth, mix effects, and variable interactions.
Segment Analysis
By Sub-additive Type: Lysine Dominance with Methionine Momentum
Lysine secured 37.62% of the South America feed amino acids market share in 2025, establishing its fundamental role in monogastric nutrition. It remains essential in corn-soy diets for broilers and pigs, supporting lean tissue growth and feed conversion efficiency. The region's strong position in poultry exports reinforces lysine's market dominance, as producers maintain consistent dosing to meet performance requirements. Brazil and Argentina's local fermentation facilities reduce logistics costs and currency risks, improving lysine accessibility for both large integrators and small feed mills. The market shows increasing adoption of lysine sulfate formats due to their higher nutrient density and transport efficiency. Feed formulators are using lysine to reduce crude protein levels in rations, minimizing nitrogen excretion while maintaining growth performance. These combined benefits of performance and environmental compliance establish lysine as an essential component in South America's livestock and poultry feed formulations.
Methionine is projected to grow at a 4.96% CAGR through 2031, primarily due to increased demand from aquaculture and ruminant applications. In aquaculture operations, methionine enhances tissue development and feed efficiency, particularly in high-density fish and shrimp farming. Chilean salmon producers have implemented coated methionine formats to maintain export quality standards, while dairy operations in Brazil and Argentina utilize rumen-protected methionine to enhance milk solids and protein production. New production methods, including enzymatic and microbial fermentation, are reducing costs and increasing availability. These developments make methionine more accessible across various production systems, including emerging aquaculture and beef operations. The increasing demand for species-specific nutrition positions methionine as a significant growth component in South America's feed amino acids market.


By Animal Type: Poultry Leads while Ruminants Accelerate
Poultry accounted for 51.75% of the South America feed amino acids market size in 2025, demonstrating its significance in regional protein production. Brazil and Argentina's integrated poultry operations use precision nutrition to maintain export market competitiveness. Advanced broiler genetics require precise amino acid balancing, particularly lysine and methionine, to achieve optimal performance. Nutritionists use data-driven formulation to optimize nutrient matrices and minimize feed waste. The industry maintains long-term amino acid supply contracts to manage price fluctuations and quality standards. Layer and turkey operations contribute additional demand through specialized amino acid requirements for egg production and meat quality. The poultry sector's continued dominance ensures sustained amino acid demand in South America.
The ruminant segment projects the highest growth rate at 5.14% CAGR through 2031, driven by increased amino acid adoption in dairy and beef production. Dairy operations in Argentina's Santa Fe and Córdoba regions optimize lysine and methionine ratios to improve milk protein content and production. The adoption of rumen-protected amino acids enables effective nutrient delivery to the small intestine. Beef feedlots implement balanced amino acid profiles to enhance daily weight gain and feed efficiency, reducing soybean meal dependency. Performance trials demonstrate improved results and economic benefits, encouraging wider implementation across the region. Environmental and economic factors drive ruminant producers toward amino acids as an efficiency solution, expanding the market beyond traditional poultry applications.
Geography Analysis
Brazil holds 48.65% of regional revenue in 2025 due to its extensive grain supply, large livestock populations, and efficient regulatory framework under the Ministry of Agriculture. The country's feed industry operates within an integrated value chain, with domestic amino acid production reducing import dependency. Companies like Evonik and Nutreco have established manufacturing and distribution facilities, making Brazil a key production center. Government programs support efficient feed formulation practices, enabling cooperatives and integrators to optimize amino acid usage. The country's infrastructure facilitates consistent demand across poultry, swine, and beef sectors.
Chile demonstrates the region's highest growth at 5.29% CAGR through 2031, driven by expansion in salmon farming and diversification into trout and yellowtail production. The aquaculture sector emphasizes feed efficiency and environmental standards. Recent regulations have increased the availability of specialized amino acids, including hydroxy analogue methionine. The country's efficient poultry industry contributes to increased amino acid usage per animal. Uruguay, Paraguay, and Peru are emerging markets, primarily through cattle finishing and tilapia farming operations. These countries benefit from MERCOSUR trade agreements that facilitate logistics and reduce trade barriers.
Argentina maintains a significant presence in the feed amino acids market through its established feed manufacturing infrastructure and export focus. The country's beef and poultry integrators target premium export markets in the Middle East and Asia, increasing demand for quality feed formulations. Improved regulatory processes enable faster adoption of new amino acid products. Despite currency fluctuations, producers implement strategic buying practices and utilize temporary tariff exemptions. The local soybean processing industry supports amino acid production, while dairy and beef sectors increasingly use rumen-protected amino acids.
Competitive Landscape
The market structure remains fragmented, with the top five suppliers controlling a minor share of the market. SHV (Nutreco NV) maintains market leadership through integrated feed solutions. Evonik Industries AG utilizes regional production facilities for methionine and lysine. IFF (Danisco Animal Nutrition) combines product sales with digital solutions and technical support. Adisseo specializes in sulfur amino acids and enzymes, while Lonza Group Ltd. focuses on specific applications for ruminants and specialty species.
Companies are investing in regional manufacturing capacity and technological advancement. New facilities for threonine and tryptophan production enhance product portfolios and export capabilities. Suppliers integrate data analytics into feed formulation systems for precise amino acid recommendations. Companies with efficient regulatory compliance processes gain competitive advantages through faster market access.
New entrants explore sustainable amino acid alternatives, including microbial and insect-based sources. Distribution remains challenging in areas with limited infrastructure. Companies address this through acquisitions of regional networks and partnerships with local distributors. Digital platforms improve ordering and inventory management processes. Success in the market requires balanced capabilities in innovation, distribution, and technical support.
South America Feed Amino Acids Industry Leaders
Evonik Industries AG
Lonza Group Ltd.
Adisseo France SAS (China National BlueStar Co. Ltd.)
Nutreco N.V. (SHV Holdings N.V.)
IFF Danisco Animal Nutrition and Health
- *Disclaimer: Major Players sorted in no particular order

Recent Industry Developments
- October 2024: DSM-Firmenich launched a new facility in Sete Lagoas, Brazil, with a 100,000 metric ton annual capacity focused on feed enzymes for cattle health. The investment supports amino acid synergy in precision livestock nutrition across South America.
- May 2024: Innovad acquired Brazilian feed additive supplier Oligo Basics, expanding its footprint and product portfolio in South America. The merger enhances access to amino acid-based nutritional solutions tailored for regional livestock production.
- May 2023: CJ Bio completed expansions of its tryptophan and threonine production in Brazil, reinforcing its role in supplying essential amino acids for animal nutrition. This move strengthens South America's capacity for locally sourced feed-grade amino acids.


South America Feed Amino Acids Market Report Scope
Lysine, Methionine, Threonine, Tryptophan are covered as segments by Sub Additive. Aquaculture, Poultry, Ruminants, Swine are covered as segments by Animal. Argentina, Brazil, Chile are covered as segments by Country.By Sub-additive Type
| Lysine |
| Methionine |
| Threonine |
| Tryptophan |
| Other Amino Acids |
By Animal Type
| Aquaculture | Fish |
| Shrimp | |
| Other Aquaculture Species | |
| Poultry | Broiler |
| Layer | |
| Other Poultry Birds | |
| Ruminants | Beef Cattle |
| Dairy Cattle | |
| Other Ruminants | |
| Swine | |
| Other Animals |
Geography
| Argentina |
| Brazil |
| Chile |
| Rest of South America |
| By Sub-additive Type | Lysine | |
| Methionine | ||
| Threonine | ||
| Tryptophan | ||
| Other Amino Acids | ||
| By Animal Type | Aquaculture | Fish |
| Shrimp | ||
| Other Aquaculture Species | ||
| Poultry | Broiler | |
| Layer | ||
| Other Poultry Birds | ||
| Ruminants | Beef Cattle | |
| Dairy Cattle | ||
| Other Ruminants | ||
| Swine | ||
| Other Animals | ||
| Geography | Argentina | |
| Brazil | ||
| Chile | ||
| Rest of South America | ||


Market Definition
- FUNCTIONS - For the study, feed additives are considered to be commercially manufactured products that are used to enhance characteristics such as weight gain, feed conversion ratio, and feed intake when fed in appropriate proportions.
- RESELLERS - Companies engaged in reselling feed additives without value addition have been excluded from the market scope, to avoid double counting.
- END CONSUMERS - Compound feed manufacturers are considered to be end-consumers in the market studied. The scope excludes farmers buying feed additives to be used directly as supplements or premixes.
- INTERNAL COMPANY CONSUMPTION - Companies engaged in the production of compound feed as well as the manufacturing of feed additives are part of the study. However, while estimating the market sizes, the internal consumption of feed additives by such companies has been excluded.
| Keyword | Definition |
|---|---|
| Feed additives | Feed additives are products used in animal nutrition for purposes of improving the quality of feed and the quality of food from animal origin, or to improve the animals’ performance and health. |
| Probiotics | Probiotics are microorganisms introduced into the body for their beneficial qualities. (It maintains or restores beneficial bacteria to the gut). |
| Antibiotics | Antibiotic is a drug that is specifically used to inhibit the growth of bacteria. |
| Prebiotics | A non-digestible food ingredient that promotes the growth of beneficial microorganisms in the intestines. |
| Antioxidants | Antioxidants are compounds that inhibit oxidation, a chemical reaction that produces free radicals. |
| Phytogenics | Phytogenics are a group of natural and non-antibiotic growth promoters derived from herbs, spices, essential oils, and oleoresins. |
| Vitamins | Vitamins are organic compounds, which are required for normal growth and maintenance of the body. |
| Metabolism | A chemical process that occurs within a living organism in order to maintain life. |
| Amino acids | Amino acids are the building blocks of proteins and play an important role in metabolic pathways. |
| Enzymes | Enzyme is a substance that acts as a catalyst to bring about a specific biochemical reaction. |
| Anti-microbial resistance | The ability of a microorganism to resist the effects of an antimicrobial agent. |
| Anti-microbial | Destroying or inhibiting the growth of microorganisms. |
| Osmotic balance | It is a process of maintaining salt and water balance across membranes within the body's fluids. |
| Bacteriocin | Bacteriocins are the toxins produced by bacteria to inhibit the growth of similar or closely related bacterial strains. |
| Biohydrogenation | It is a process that occurs in the rumen of an animal in which bacteria convert unsaturated fatty acids (USFA) to saturated fatty acids (SFA). |
| Oxidative rancidity | It is a reaction of fatty acids with oxygen, which generally causes unpleasant odors in animals. To prevent these, antioxidants were added. |
| Mycotoxicosis | Any condition or disease caused by fungal toxins, mainly due to contamination of animal feed with mycotoxins. |
| Mycotoxins | Mycotoxins are toxin compounds that are naturally produced by certain types of molds (fungi). |
| Feed Probiotics | Microbial feed supplements positively affect gastrointestinal microbial balance. |
| Probiotic yeast | Feed yeast (single-cell fungi) and other fungi used as probiotics. |
| Feed enzymes | They are used to supplement digestive enzymes in an animal’s stomach to break down food. Enzymes also ensure that meat and egg production is improved. |
| Mycotoxin detoxifiers | They are used to prevent fungal growth and to stop any harmful mold from being absorbed in the gut and blood. |
| Feed antibiotics | They are used both for the prevention and treatment of diseases but also for rapid growth and development. |
| Feed antioxidants | They are used to protect the deterioration of other feed nutrients in the feed such as fats, vitamins, pigments, and flavoring agents, thus providing nutrient security to the animals. |
| Feed phytogenics | Phytogenics are natural substances, added to livestock feed to promote growth, aid in digestion, and act as anti-microbial agents. |
| Feed vitamins | They are used to maintain the normal physiological function and normal growth and development of animals. |
| Feed flavors and sweetners | These flavors and sweeteners help to mask tastes and odors during changes in additives or medications and make them ideal for animal diets undergoing transition. |
| Feed acidifiers | Animal feed acidifiers are organic acids incorporated into the feed for nutritional or preservative purposes. Acidifiers enhance congestion and microbiological balance in the alimentary and digestive tracts of livestock. |
| Feed minerals | Feed minerals play an important role in the regular dietary requirements of animal feed. |
| Feed binders | Feed binders are the binding agents used in the manufacture of safe animal feed products. It enhances the taste of food and prolongs the storage period of the feed. |
| Key Terms | Abbreviation |
| LSDV | Lumpy Skin Disease Virus |
| ASF | African Swine Fever |
| GPA | Growth Promoter Antibiotics |
| NSP | Non-Starch Polysaccharides |
| PUFA | Polyunsaturated Fatty Acid |
| Afs | Aflatoxins |
| AGP | Antibiotic Growth Promoters |
| FAO | The Food And Agriculture Organization of the United Nations |
| USDA | The United States Department of Agriculture |


Research Methodology
Mordor Intelligence follows a four-step methodology in all our reports.
- Step-1: IDENTIFY KEY VARIABLES: In order to build a robust forecasting methodology, the variables and factors identified in Step-1 are tested against available historical market numbers. Through an iterative process, the variables required for market forecast are set and the model is built on the basis of these variables.
- Step-2: Build a Market Model: Market-size estimations for the forecast years are in nominal terms. Inflation is not a part of the pricing, and the average selling price (ASP) is kept constant throughout the forecast period.
- Step-3: Validate and Finalize: In this important step, all market numbers, variables and analyst calls are validated through an extensive network of primary research experts from the market studied. The respondents are selected across levels and functions to generate a holistic picture of the market studied.
- Step-4: Research Outputs: Syndicated Reports, Custom Consulting Assignments, Databases & Subscription Platforms


