South America Dog Food Market Size and Share
Market Overview
| Study Period | 2018 - 2031 |
|---|---|
| Forecast Data Period | 2026 - 2031 |
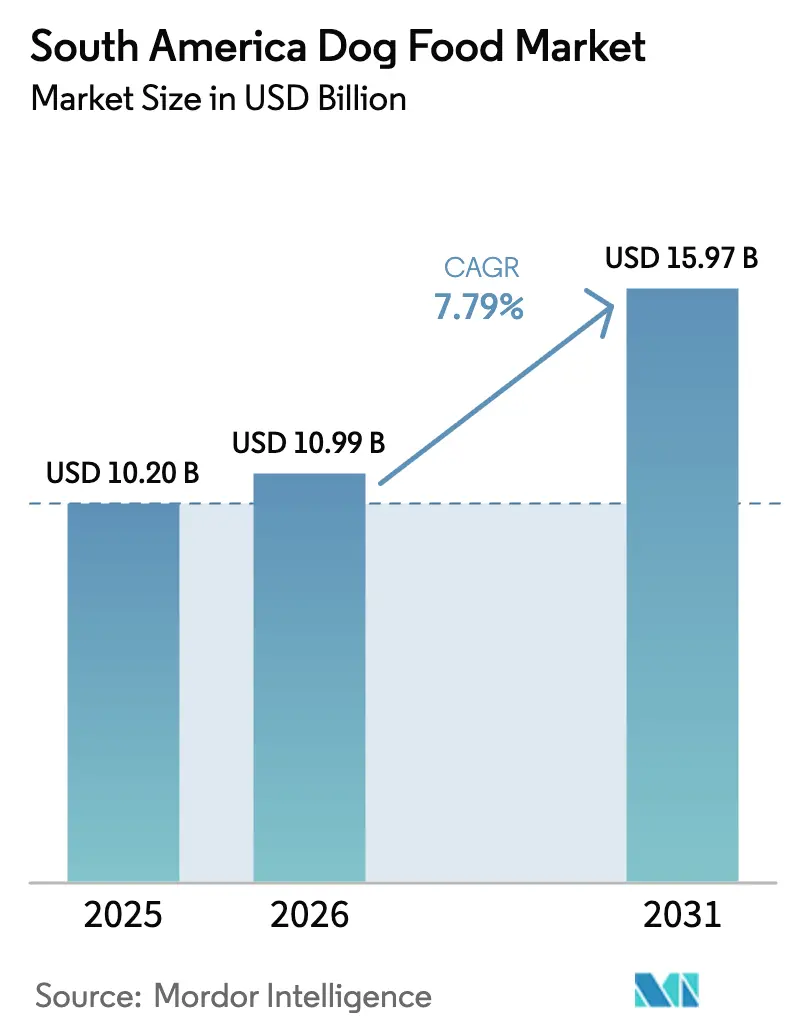
| Base Year Market Size (2025) | USD 10.20 Billion |
| Market Size (2026) | USD 10.99 Billion |
| Market Size (2031) | USD 15.97 Billion |
| Growth Rate (2026 - 2031) | 7.79% CAGR |
| Market Concentration | Low |
Major Players *Disclaimer: Major Players sorted in no particular order Image © Mordor Intelligence. Reuse requires attribution under CC BY 4.0. | |
South America Dog Food Market Analysis by Mordor Intelligence
The South America dog food market size was valued at USD 10.20 billion in 2025 and estimated to grow from USD 10.99 billion in 2026 to reach USD 15.97 billion by 2031, at a CAGR of 7.79% during the forecast period (2026-2031). Continued pet humanization, formal dog population registration, and supportive tax reforms are the primary accelerants of this growth trajectory. Brazil’s new National Pet Registration System (SinPatinhas) and Ecuador’s 2025 VAT (Value Added Tax) exemption have expanded product accessibility, while premium formulations and therapeutic diets are capturing the rising disposable income in urban centers. Specialty-store expertise, rapid e-commerce penetration, and export-oriented production upgrades give firms multiple paths to volume and margin expansion. Input-cost volatility and fragmented regulations remain structural constraints, though ongoing ingredient-cost hedging, omnichannel investment, and product innovation mitigate near-term risk. Over the forecast horizon, premiumization and digital engagement are projected to reinforce sustained demand even under macroeconomic headwinds.
Key Report Takeaways
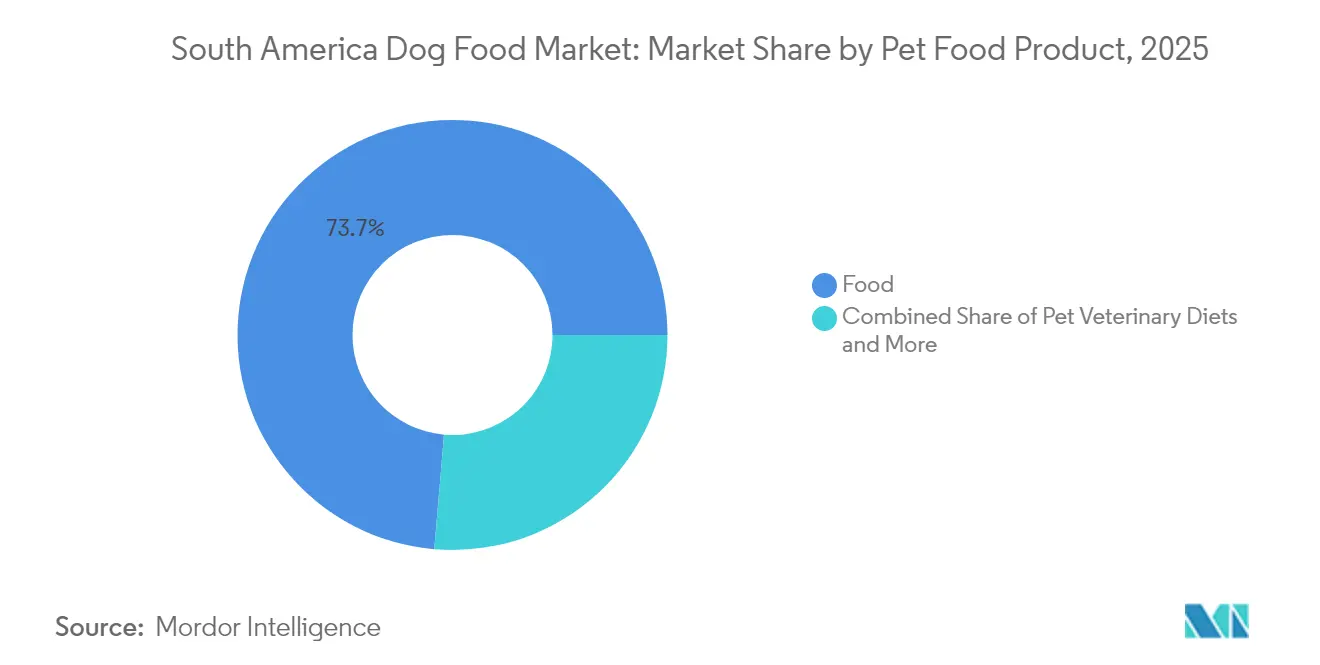
- By pet food product, food products led with 73.65% of South America dog food market share in 2025, while veterinary diets are projected to grow at a 9.97% CAGR through 2031.
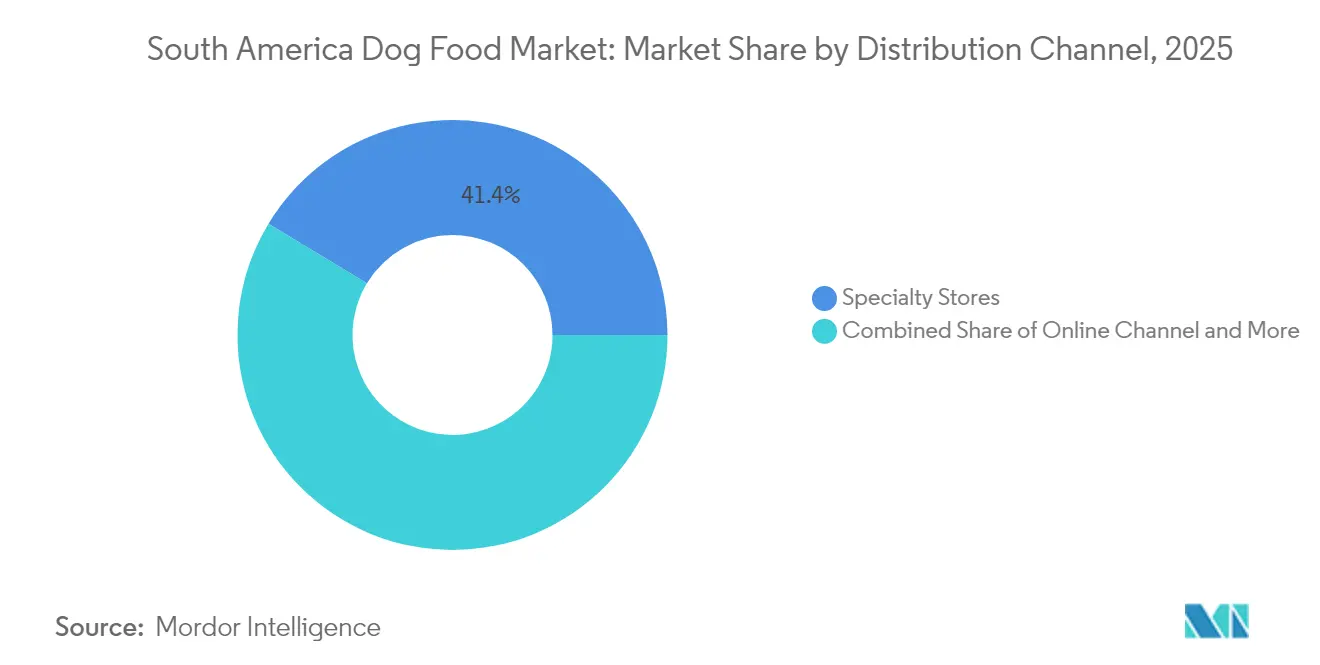
- By distribution channel, specialty stores held 41.35% share of the South America dog food market size in 2025, and online channels are advancing at a 10.18% CAGR during 2026-2031.
- By geography, Brazil captured 66.85% revenue share in 2025 and Argentina is forecast to record the highest CAGR at 9.38% between 2026 and 2031.
Note: Market size and forecast figures in this report are generated using Mordor Intelligence’s proprietary estimation framework, updated with the latest available data and insights as of 2026.
South America Dog Food Market Trends and Insights
Drivers Impact Analysis*
| Driver | (~) % Impact on CAGR Forecast | Geographic Relevance | Impact Timeline |
|---|---|---|---|
| Premiumization of dog diets | +1.2% | Brazil, Argentina, Chile | Medium term (2-4 years) |
| Rapid e-commerce penetration | +1.5% | Brazil, Colombia, urban centers | Short term (≤ 2 years) |
| Growing canine population and adoption programs | +1.8% | Brazil, Argentina, Ecuador | Long term (≥ 4 years) |
| Brazilian VAT (Value Added Tax) reform easing pet-food taxes | +0.8% | Brazil, regional spillover | Medium term (2-4 years) |
| AI-driven personalized nutrition platforms | +0.6% | Brazil, Mexico, urban markets | Long term (≥ 4 years) |
| US FDA (United States Food and Drug Administration) approval of Brazil wet-food exports | +0.9% | Brazil, export-dependent regions | Medium term (2-4 years) |
| Source: Mordor Intelligence | |||
Premiumization of Dog Diets
Urban consumers prefer functional, super-premium formulations that promise digestive health and transparency in their ingredients. Brazilian producer Especially Pet Food now operates at a monthly capacity of 180 metric tons, exporting freeze-dried treats across the Americas, which illustrates a shift toward higher-value products[1]Source: All Pet Food Editorial Team, “Projections for 2025 in LATAM,” allpetfood.net. Colombian Italcol’s collaboration with Alpina on probiotic dog treats reinforces the convergence of human food science and pet nutrition. Although real household purchasing power in the region has declined since 2020, upper-middle-income pet owners continue to allocate a significant portion of their discretionary funds to specialty diets. Manufacturers that document ingredient provenance and sustainability receive premium shelf positioning, especially in large Brazilian and Chilean chains.
Rapid E-commerce Penetration
Online sales are set to grow faster than any physical format. The announced merger talks between Petz and Cobasi in April 2024 underscore a rush to strengthen omnichannel capabilities. Subscription-based replenishment, last-mile delivery near major cities, and loyalty apps are increasing lifetime customer value. Manufacturers that integrate product education, veterinary teleconsultation, and automatic reorder options hold a distinct competitive advantage. Traditional specialty outlets respond by blending in-store consultations with click-and-collect services to retain relevance.
Growing Canine Population and Adoption Programs
Brazil's launch of the National Pet Registration System (SinPatinhas) in 2025 marks a significant milestone in market formalization, as it addresses the substantial population of street and shelter animals. Government and NGO adoption programs are increasingly sophisticated, often including starter pet food packages and educational materials that introduce new pet owners to commercial nutrition products rather than homemade feeding practices. The demographic shift toward smaller household sizes and delayed family formation in urban areas is driving pet adoption as a means of emotional companionship, with younger consumers being particularly receptive to premium nutrition messaging and veterinary-recommended diets.
Brazilian VAT (Value Added Tax) reform easing pet-food taxes
Brazil's complex tax structure historically imposed approximately 50% tax burden on pet food products, creating affordability barriers that limited market penetration across income segments. While sweeping reform is still pending, Ecuador’s successful 2025 VAT elimination offers a blueprint and political impetus. Temporary tariff-rate quotas implemented in November 2024 have already eased certain input costs. Progressive fiscal relaxation would lower shelf prices and stimulate down-trading consumers to re-enter branded segments.
Restraints Impact Analysis*
| Restraint | (~) % Impact on CAGR Forecast | Geographic Relevance | Impact Timeline |
|---|---|---|---|
| High inflation and price sensitivity | -1.4% | Argentina, regional urban centers | Short term (≤ 2 years) |
| Volatile grain and meat input costs | -1.1% | Manufacturing centers, import-dependent regions | Medium term (2-4 years) |
| Fragmented regulatory requirements across Mercosur and Pacific Alliance | -0.8% | Cross-border trade regions | Short term (≤ 2 years) |
| Last-mile logistics barriers in Amazon Andes corridor | -0.6% | Rural and remote regions | Long term (≥ 4 years) |
| Source: Mordor Intelligence | |||
High Inflation and Price Sensitivity
Persistent inflation erodes real wages, making value-priced formats and private labels more attractive, especially in Argentina, where wage growth is declining. This macroeconomic pressure creates a fragmented competitive landscape where manufacturers, suppliers, pet shops, and veterinarians compete intensely for price-conscious consumers, often leading to margin compression and reduced investment in innovation. Private label products are gaining market share as retailers respond to consumer demand for value-oriented options, while premium brands face challenges maintaining volume growth despite strong brand loyalty among affluent segments. The inflationary environment particularly impacts imported ingredients and packaging materials, forcing manufacturers to implement frequent price adjustments that can disrupt consumer purchasing patterns and retailer relationships.
Volatile Grain and Meat Input Costs
Commodity price volatility has a significant impact on South American pet food manufacturers, as soybean meal and corn prices are subject to weather disruptions, changes in export policies, and fluctuations in global demand, resulting in unpredictable cost structures. Flooding in Rio Grande do Sul disrupted soybean harvests, and Argentine leafhopper infestations reduced corn yields, highlighting the supply volatility that affects ingredient availability and pricing [2]Source: Guy H. Allen, “Notes and Observations in International Commodity Markets,” ksu.edu. Floods and pests disrupt ingredient supply, while Argentine export taxes skew regional flows. Hedging and multi-source procurement help large firms cope, but smaller producers bear a higher risk of volatility.
*Our forecasts treat driver/restraint impacts as directional, not additive. The impact forecasts reflect baseline growth, mix effects, and variable interactions.
Segment Analysis
By Pet Food Product: Veterinary Diets Accelerate Specialized Growth
Food products accounted for 73.65% of 2025 revenue in the South America dog food market, validating the ongoing transition from home-prepared meals. Veterinary diets are projected to post a 9.97% CAGR, adding the largest incremental value to the South America dog food market size through 2031. The Peruvian brand Vet Care Natural Formula targets chronic conditions, such as renal disease, and its early adoption in veterinary clinics affirms a willingness to pay for efficacy. Dry food remains the volume leader due to its price and convenience, even though wet food gains market share in premium urban niches where disposable income supports the premium texture and palatability.
Supplements and nutraceuticals show steady double-digit growth as Italcol and Alpina extend probiotic concepts from human yogurt to canine treats. Freeze-dried and jerky snacks offer single-ingredient transparency, which resonates with label-conscious owners. Over the forecast window, functional benefits, science-backed claims, and cross-channel veterinary endorsements reshape value perception, propelling specialized lines into mainstream channels while expanding overall South America dog food market penetration.


By Distribution Channel: Digital Transformation Reshapes Retail
Specialty outlets accounted for 41.35% of 2025 sales across the South America dog food market share, leveraging trained staff to advise on breed-specific nutrition. Yet, online channels are projected to grow at a 10.18% annual rate, capturing routine replenishment through subscription and bundling. The Petz-Cobasi merger aims to combine brick-and-mortar trust with digital convenience, an approach crucial for retaining pharmacological diet shoppers who require veterinary oversight.
Supermarkets and hypermarkets allocate more shelf space to mid-price brands as pet aisles outperform many packaged-food categories. Convenience stores cater to emergency purchases in densely populated cities. Veterinary clinics maintain authority for prescription diets, often integrating QR codes for automatic refills that link back to manufacturer portals. The extended logistics network now supports two-day delivery across most Brazilian metropolitan areas, allowing even small direct-to-consumer brands to achieve national reach. These improvements foster wider adoption of premium SKUs, boosting the South America dog food market size by pulling incremental spend away from homemade feeding.
Geography Analysis
Brazil generated 66.85% of 2025 revenue, underpinned by a formal annual production capacity, the world’s second-largest national canine population. The South American dog food market benefits from Brazil’s MAPA regulations, which require rigorous labeling and quality audits, thereby elevating domestic manufacturing standards. SinPatinhas is projected to refine market sizing and aid tailored nutrition campaigns that drive further premium uptake.
Argentina is projected to show the highest forecast CAGR of 9.38% through 2031, due to near-universal pet ownership and professional veterinary leadership, despite facing economic headwinds. Local crop abundance offers ingredient cost advantages, although export tax differentials create a complex pricing equation. Chile, Colombia, Peru, and Ecuador collectively lift regional upside. Ecuador’s 2025 VAT exemption immediately reduced shelf prices by approximately 12%, catalyzing first-time purchases among value-oriented owners.
Colombia's innovation in functional pet treats, achieved through Italcol's probiotic partnerships, demonstrates the potential for specialized product development. Meanwhile, Peru's veterinary diet launches indicate a growing sophistication in the therapeutic nutrition segment. These markets benefit from regional trade agreements and improving logistics infrastructure, though last-mile distribution challenges in Amazon-Andes corridor regions continue to limit rural market penetration and increase operational costs for manufacturers seeking comprehensive geographic coverage.
Competitive Landscape
The South America dog food market exhibits low consolidation with multinational players Mars, Nestle Purina, PremieRpet, Empresas Carozzi SA, and Colgate-Palmolive's Hill's Pet Nutrition commanding significant market presence alongside strong regional manufacturers, including BRF, Grupo Oliveira, and Italcol, which leverage local ingredient sourcing and distribution expertise. Competition intensity is escalating as digital transformation reshapes customer acquisition strategies, with companies investing heavily in e-commerce capabilities, subscription models, and AI-driven personalization platforms to differentiate beyond traditional product features and pricing.
Opportunities arise in specialized nutrition segments, including therapeutic diets, functional treats, and species-specific formulations, where partnerships with the veterinary channel and scientific credibility create sustainable competitive advantages. Technology adoption patterns favor companies that can integrate digital health monitoring with nutrition recommendations, as evidenced by Farmina's deployment of the Genius AI platform and Nestle Purina's innovation accelerator programs, which support local startup partnerships.
Regulatory compliance capabilities increasingly determine market access, particularly as Brazil's MAPA registration requirements and Mexico's enhanced pet food safety standards create barriers for smaller manufacturers lacking the technical expertise and financial resources to navigate complex approval processes. The competitive landscape rewards companies that can balance premium positioning with value accessibility, as economic volatility forces consumers to prioritize price-performance ratios while maintaining aspirations for higher-quality nutrition solutions.
South America Dog Food Industry Leaders
BRF Global
Empresas Carozzi SA
Mars Incorporated
Nestle (Purina)
PremieRpet
- *Disclaimer: Major Players sorted in no particular order

Recent Industry Developments
- November 2024: Brazil's Executive Committee of the Foreign Trade Chamber implemented temporary import tariff-rate quotas for animal feed and other products through November 2025, affecting ingredient cost structures for pet food manufacturers relying on imported raw materials.
- July 2023: Hill's Pet Nutrition introduced its new MSC (Marine Stewardship Council) certified pollock and insect protein products for pets with sensitive stomachs and skin lines. They contain vitamins, omega-3 fatty acids, and antioxidants.
- March 2023: PremieRpet launched a line of superpremium, "Protein-packed" meal toppers/treats for dogs and cats under the brand Natoo. These are produced at PremieRpet's facility in Brazil.Hill's Pet Nutrition introduced its new MSC (Marine Stewardship Council) certified pollock and insect protein products for pets with sensitive stomachs and skin lines. They contain vitamins, omega-3 fatty acids, and antioxidants.


South America Dog Food Market Report Scope
Food, Pet Nutraceuticals/Supplements, Pet Treats, Pet Veterinary Diets are covered as segments by Pet Food Product. Convenience Stores, Online Channel, Specialty Stores, Supermarkets/Hypermarkets are covered as segments by Distribution Channel. Argentina, Brazil are covered as segments by Country.| Food | By Sub Product | Dry Pet Food | By Sub Dry Pet Food | Kibbles |
| Other Dry Pet Food | ||||
| Wet Pet Food | ||||
| Pet Nutraceuticals/Supplements | By Sub Product | Milk Bioactives | ||
| Omega-3 Fatty Acids | ||||
| Probiotics | ||||
| Proteins and Peptides | ||||
| Vitamins and Minerals | ||||
| Other Nutraceuticals | ||||
| Pet Treats | By Sub Product | Crunchy Treats | ||
| Dental Treats | ||||
| Freeze-dried and Jerky Treats | ||||
| Soft and Chewy Treats | ||||
| Other Treats | ||||
| Pet Veterinary Diets | By Sub Product | Derma Diets | ||
| Diabetes | ||||
| Digestive Sensitivity | ||||
| Obesity Diets | ||||
| Oral Care Diets | ||||
| Renal | ||||
| Urinary tract disease | ||||
| Other Veterinary Diets |
| Convenience Stores |
| Online Channel |
| Specialty Stores |
| Supermarkets/Hypermarkets |
| Other Channels |
| Argentina |
| Brazil |
| Rest of South America |
| By Pet Food Product | Food | By Sub Product | Dry Pet Food | By Sub Dry Pet Food | Kibbles |
| Other Dry Pet Food | |||||
| Wet Pet Food | |||||
| Pet Nutraceuticals/Supplements | By Sub Product | Milk Bioactives | |||
| Omega-3 Fatty Acids | |||||
| Probiotics | |||||
| Proteins and Peptides | |||||
| Vitamins and Minerals | |||||
| Other Nutraceuticals | |||||
| Pet Treats | By Sub Product | Crunchy Treats | |||
| Dental Treats | |||||
| Freeze-dried and Jerky Treats | |||||
| Soft and Chewy Treats | |||||
| Other Treats | |||||
| Pet Veterinary Diets | By Sub Product | Derma Diets | |||
| Diabetes | |||||
| Digestive Sensitivity | |||||
| Obesity Diets | |||||
| Oral Care Diets | |||||
| Renal | |||||
| Urinary tract disease | |||||
| Other Veterinary Diets | |||||
| By Distribution Channel | Convenience Stores | ||||
| Online Channel | |||||
| Specialty Stores | |||||
| Supermarkets/Hypermarkets | |||||
| Other Channels | |||||
| By Geography | Argentina | ||||
| Brazil | |||||
| Rest of South America | |||||


Market Definition
- FUNCTIONS - Pet foods are usually intended to provide complete and balanced nutrition to the pet but are primarily used as functional products. The scope includes the food and supplements consumed by pets including veterinary diets. Supplements/nutraceuticals that are directly supplied to pets are considered within the scope.
- RESELLERS - Companies engaged in reselling of pet food without value addition have been excluded from the market scope, in order to avoid double counting.
- END CONSUMERS - Pet owners are considered to be the end-consumers in the market studied.
- DISTRIBUTION CHANNELS - Supermarkets/hypermarkets, specialty stores, convenience stores, online channels and other channels are considered within the scope. The stores which are exclusively providing pet related basic and custom products are considered within the scope of specialty stores.
| Keyword | Definition |
|---|---|
| Pet Food | The scope of pet food includes the food that is eatable by pets including food, treats, veterinary diets, and nutraceuticals/supplements. |
| Food | Food is animal feed intended for consumption by pets. It is formulated to provide essential nutrients and meet the dietary needs of various types of pets, including dogs, cats, and other animals. These are generally segmented into dry and wet pet foods. |
| Dry Pet Food | Dry pet foods may be extruded/baked (kibbles) or flaked. They have a lower moisture content, typically around 12-20%. |
| Wet Pet Food | Wet pet food, also known as canned pet food or moist pet food, generally has a higher moisture content compared to dry pet food, often ranging from 70-80%. |
| Kibbles | Kibbles are dry, processed pet food in small, bite-sized pieces or pellets. They are specifically formulated to provide balanced nutrition for various domestic animals, such as dogs, cats, and other animals. |
| Treats | Pet Treats are special food items or rewards given to pets, to show affection, and encourage good behavior. They are especially used during training. Pet treats are made from various combinations of meat or meat-derived materials with other ingredients. |
| Dental Treats | Pet dental treats are specialized treats that are formulated to promote good oral hygiene in pets. |
| Crunchy Treats | It is a type of pet treat that has a firm and crispy texture which can be a good source of nutrition for pets. |
| Soft and chewy treats | Soft and Chewy pet treats are a type of pet food product that is formulated to be easy to chewy and digest. They are usually made from soft and pliable ingredients, such as meat, poultry, or vegetables, that have been blended and formed into bite-sized pieces or strips. |
| Freeze-dried & Jerky Treats | Freeze-dried and jerky treats are snacks given to pets, that are prepared through a special preservation process, without damaging the nutritional content, resulting in long-lasting, nutrient-rich treats. |
| Urinary Tract Disease Diets | These are commercial diets that are specifically formulated to promote urinary health and reduce the risk of urinary tract infections and other urinary problems. |
| Renal Diets | These are specialized pet foods formulated to support the health of pets with kidney disease or renal insufficiency. |
| Digestive Sensitivity Diets | Digestive-sensitive diets are specially formulated to meet the nutritional needs of pets with digestive issues such as food intolerances, allergies, and sensitivities. These diets are designed to be easily digestible and to reduce the symptoms of digestive problems in pets. |
| Oral Care Diets | Oral care diets for pets are specially formulated diets produced to promote oral health and hygiene in pets. |
| Grain-Free Pet Food | Pet food that does not contain common grains like wheat, corn, or soy. Grain-free diets are often preferred by pet owners seeking alternative options or if their pets have specific dietary sensitivities. |
| Premium Pet Food | High-quality pet food formulated with superior ingredients often offers additional nutritional benefits compared to standard pet food. |
| Natural Pet Food | Pet food made from natural ingredients, with minimal processing and without artificial preservatives. |
| Organic Pet Food | Pet food is produced using organic ingredients, free from synthetic pesticides, hormones, and genetically modified organisms (GMOs). |
| Extrusion | A manufacturing process used to produce dry pet food, where ingredients are cooked, mixed, and shaped under high pressure and temperature. |
| Other Pets | Other pets include birds, fish, rabbits, hamsters, ferrets, and reptiles. |
| Palatability | The taste, texture, and aroma of pet food influence its appeal and acceptance by pets. |
| Complete and Balanced Pet Food | Pet food that provides all essential nutrients in appropriate proportions to meet the nutritional needs of pets without additional supplementation. |
| Preservatives | These are the substances that are added to pet food to extend its shelf life and prevent spoilage. |
| Nutraceuticals | Food products that offer health benefits beyond basic nutrition, often contain bioactive compounds with potential therapeutic effects. |
| Probiotics | Live beneficial bacteria that promote a healthy balance of gut flora, supporting digestive health and immune function in pets. |
| Antioxidants | Compounds that help neutralize harmful free radicals in the body, promoting cellular health and supporting the immune system in pets. |
| Shelf-Life | The duration of which pet food remains safe and nutritionally viable for consumption after its production date. |
| Prescription diet | Specialized pet food formulated to address specific medical conditions under veterinary supervision. |
| Allergen | A substance that can cause allergic reactions in some pets, leading to food allergies or sensitivities. |
| Canned food | Wet pet food that is packed in cans and contains higher moisture content than dry food. |
| Limited ingredient diet (LID) | Pet food formulated with a reduced number of ingredients to minimize potential allergens. |
| Guaranteed Analysis | The minimum or maximum levels of certain nutrients present in pet food. |
| Weight management | Pet food designed to help pets maintain a healthy weight or support weight loss efforts. |
| Other Nutraceuticals | It includes prebiotics, antioxidants, digestive fiber, enzymes, essential oils and herbs. |
| Other Veterinary Diets | It includes weight management diets, skin and coat health, cardiac care, and joint care. |
| Other Treats | It includes rawhides, mineral blocks, lickables, and catnips. |
| Other Dry Foods | It includes cereal flakes, mixers, meal toppers, freeze-dried foods, and air-dried foods. |
| Other Animals | It includes birds, fish, reptiles, and small animals (rabbits, ferrets, hamsters). |
| Other Distribution Channels | It includes veterinary clinics, local unregulated stores, and feed and farm stores. |
| Proteins and Peptides | Proteins are large molecules composed of basic units called amino acids which help in the growth and development of pets. Peptides are the short string of 2 to 50 amino acids. |
| Omega-3 fatty acids | Omega-3 fatty acids are essential polyunsaturated fats that play a crucial role in the overall health and well-being of Pets |
| Vitamins | Vitamins are the essential organic compounds that are essential for vital physiological functioning. |
| Minerals | Minerals are naturally occurring inorganic substances that are essential for various physiological functions in pets. |
| CKD | Chronic Kidney Disease |
| DHA | Docosahexaenoic Acid |
| EPA | Eicosapentaenoic Acid |
| ALA | Alpha-linolenic Acid |
| BHA | Butylated Hydroxyanisol |
| BHT | Butylated Hydroxytoluene |
| FLUTD | Feline Lower Urinary Tract Disease |


Research Methodology
Mordor Intelligence follows a four-step methodology in all our reports.
- Step-1: IDENTIFY KEY VARIABLES: In order to build a robust forecasting methodology, the variables and factors identified in Step-1 are tested against available historical market numbers. Through an iterative process, the variables required for market forecast are set and the model is built on the basis of these variables.
- Step-2: Build a Market Model: Market-size estimations for the forecast years are in nominal terms. Inflation is not a part of the pricing, and the average selling price (ASP) is kept constant throughout the forecast period.
- Step-3: Validate and Finalize: In this important step, all market numbers, variables and analyst calls are validated through an extensive network of primary research experts from the market studied. The respondents are selected across levels and functions to generate a holistic picture of the market studied.
- Step-4: Research Outputs: Syndicated Reports, Custom Consulting Assignments, Databases & Subscription Platforms


