South America Cat Food Market Size and Share
Market Overview
| Study Period | 2017 - 2030 |
|---|---|
| Forecast Data Period | 2025 - 2030 |
| Historical Data Period | 2017 - 2023 |
| Market Size (2025) | USD 3.23 Billion |
| Market Size (2030) | USD 5.78 Billion |
| Growth Rate (2025 - 2030) | 12.31% CAGR |
| Market Concentration | Medium |
Major Players*Disclaimer: Major Players sorted in no particular order Image © Mordor Intelligence. Reuse requires attribution under CC BY 4.0. | |

South America Cat Food Market Analysis by Mordor Intelligence
The South America Cat Food Market size is estimated at 3.23 billion USD in 2025, and is expected to reach 5.78 billion USD by 2030, growing at a CAGR of 12.31% during the forecast period (2025-2030).
The South American cat food industry is experiencing a significant transformation driven by premiumization and changing consumer preferences. Pet owners are increasingly treating their cats as family members, leading to higher demand for premium and specialized nutrition products. This shift is reflected in the market structure, where cats accounted for 19.5% of the overall South American pet food market in 2022, demonstrating their growing importance in the pet food industry. Manufacturers are responding by developing premium products with natural ingredients, specialized formulations, and innovative packaging solutions like trilaminate materials that ensure better preservation and convenience.
Product preferences in the South American cat food market are evolving with a clear inclination towards wet food products and specialized treats. Wet food has emerged as the dominant category, accounting for 52.9% of the market in 2022, as it aligns better with cats' natural dietary requirements and provides higher moisture content. In the treats segment, freeze-dried options have gained significant traction, representing 24.6% of the treats category in 2022, driven by their superior preservation of natural flavors and nutritional content. Major manufacturers are continuously innovating their product portfolios, as evidenced by Nestlé Purina's launch of new cat treats under the Friskies brand in May 2023.
The distribution landscape is undergoing a notable transformation with specialty stores leading the market evolution. These specialized outlets dominated the distribution channels with a 47.8% market share in 2022, offering personalized service and expert guidance from veterinarians and pet care specialists. The rise of specialty stores has been accompanied by the emergence of omnichannel strategies, where traditional retailers are expanding their online presence to provide customers with seamless shopping experiences. This shift is particularly evident in markets like Brazil, where major specialty chains are rapidly expanding their physical and digital footprints.
Manufacturing capabilities in South America are expanding to meet the growing demand for premium cat food products. Companies are investing in state-of-the-art production facilities equipped with advanced technology to produce high-quality cat feed products. Local manufacturers are increasingly focusing on developing products that cater to regional preferences, incorporating local flavors and recipes while maintaining international quality standards. This localization strategy is complemented by investments in research and development to create innovative formulations that address specific nutritional needs and health concerns of cats in the region, further strengthening the Latin America cat food market.
South America Cat Food Market Trends and Insights
Brazil accounted for the largest cat population in the region owing to their adaptability to smaller living spaces and lower maintenance
- The pet cat population in South America has been steadily increasing, and it increased by 13.3% between 2019 and 2022. This upward trend could be attributed to the higher adoption rates of cats as companions during the extended periods of home confinement brought on by the pandemic. Among the countries in the region, Brazil had the largest cat population, accounting for about 55.5% of the total cat population as of 2022. In South America, cats comprised 19.3% of the overall pet population in 2022. This relatively lower proportion of cats could be attributed to the cultural perception that dogs are more practical and valued pets. As a result, the number of cats represented only 50.0% of the total dog population in the region.
- However, the adaptability of cats to smaller living spaces, without feeling confined, coupled with their lower maintenance costs compared to dogs, contributed to an increased preference for cat ownership. This trend led to a significant rise in the pet cat population across the region. In Brazil alone, as of 2020, about 14.3 million households owned cats as pets. Similarly, in Argentina, the rate of cat ownership was higher, with 31.4% of households, or 4.6 million households, having cats as pets.
- An important emerging trend in the region is the establishment of cat cafes. As of 2021, around 20 cat cafes were in Brazil, providing customers with a unique opportunity to enjoy a drink while interacting with cats in a comfortable setting. This growing trend of cat cafes and the cat's ability to adopt smaller living spaces can further enhance the adoption of cats as popular pets in the region.


Higher-income pet owners' preference for natural ingredient cat food and growing product premiumization driving pet expenditure
- The expenditure on pet cats in South America steadily increased by about 22.3% between 2019 and 2022. This increase was mainly due to the rising pet ownership across the region. For instance, the number of households owning a pet cat in Brazil increased by about 11.1% between 2016 and 2020, while in Argentina, it increased by about 10.3%. Pet owners in the region are increasingly focused on pet humanization, and higher-income pet owners are driving sales growth through the use of natural ingredients and product premiumization. For instance, the retail sales value of premium dry cat food in Brazil saw a rise from USD 100.2 million in 2016 to USD 122.4 million in 2022, with a CAGR of 3.4%, reflecting the rising demand for premium cat products.
- However, with an economic downturn prevailing across the region, price sensitivity has become a crucial factor in choosing cat food brands. In Argentina, pet owners frequently switch brands or opt for the most affordable options to manage their expenses. The largest portion of sales in 2020 belonged to 'Economy' food brands, which accounted for 49.5% of the total dry cat food sales value. This trend indicates the leading preference for cost-effective cat food options.
- Offline retail channels such as pet shops, vet clinics, and supermarkets are the preferred distribution channels for purchasing pet food products in the region. However, during the COVID-19 pandemic, e-commerce's share in pet food distribution reached 11.1% as of 2022. The higher consumption of premium pet food and growing awareness about the benefits of healthy, nutritious pet food helped increase pet expenditure in the region.

Segment Analysis: PET FOOD PRODUCT
Food Segment in South America Cat Food Market
The cat food segment dominates the South American cat food market, commanding approximately 75% of the total market share in 2024. This substantial market presence is primarily driven by the segment being a fundamental necessity for cats' daily nutritional requirements. The segment encompasses both dry and wet cat food options, with wet food gaining particular prominence due to its high moisture content and strong appeal to cats' highly developed sense of smell. The segment's dominance is further strengthened by the increasing availability of premium and specialized feline food products through various distribution channels, including specialty stores and online platforms. Major manufacturers in the region have been expanding their production facilities and introducing innovative products to meet the growing demand for high-quality cat food products.
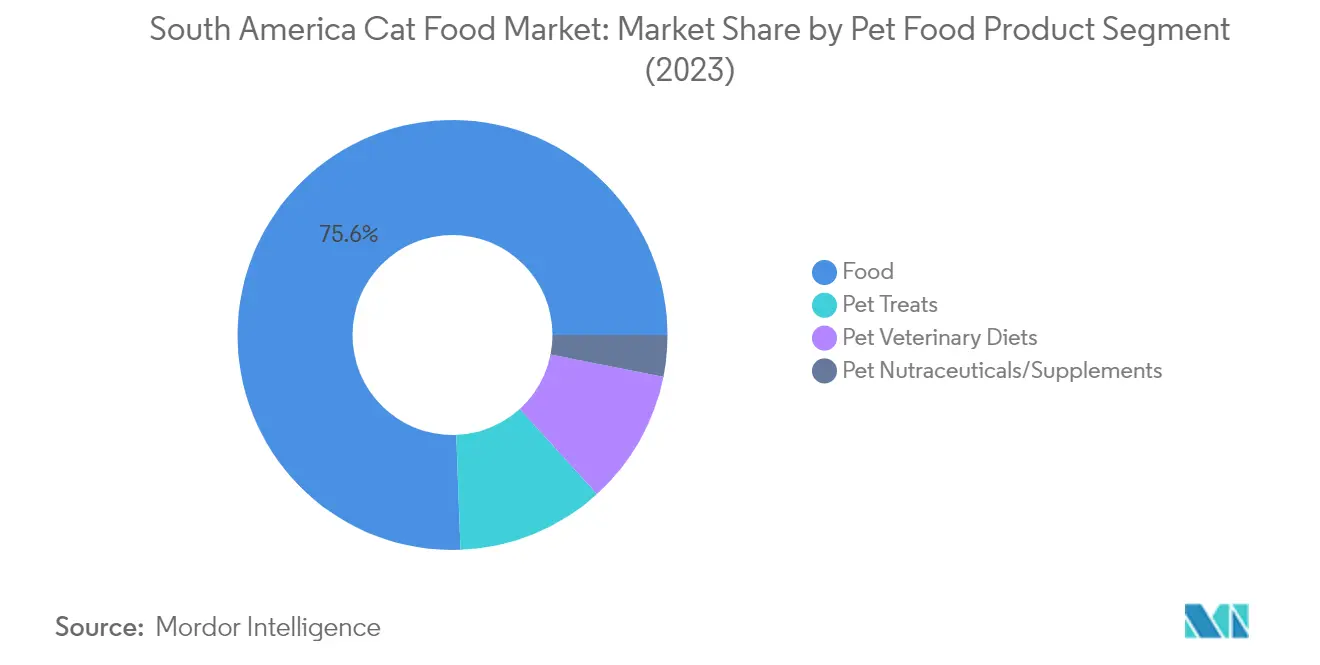

Pet Treats Segment in South America Cat Food Market
The pet treats segment is experiencing remarkable growth in the South American cat food market, projected to expand at approximately 17% during the forecast period 2024-2029. This impressive growth trajectory is driven by several factors, including the increasing trend of pet humanization and growing consumer interest in premium treat options. The segment's growth is particularly notable in the freeze-dried and jerky treats category, which offers superior nutritional value and longer shelf life. Manufacturers are focusing on developing innovative treat formulations that not only serve as rewards but also provide additional health benefits such as dental care and digestive support. The rising adoption of cats as pets and the increasing willingness of pet owners to spend on high-quality treats are further propelling this segment's expansion.
Remaining Segments in Pet Food Product Market
The pet nutraceuticals/supplements and veterinary diets segments play crucial roles in the South American cat food market, catering to specific health and wellness needs of cats. The nutraceuticals segment focuses on providing additional nutritional support through products like omega-3 fatty acids, probiotics, and vitamins, addressing various health concerns and supporting overall well-being. Meanwhile, the veterinary diets segment serves a specialized market niche, offering therapeutic nutrition for cats with specific health conditions such as diabetes, digestive sensitivity, and urinary tract diseases. Both segments are benefiting from increasing pet owner awareness about preventive healthcare and the growing trend of premium pet care products in the region.
Segment Analysis: DISTRIBUTION CHANNEL
Specialty Stores Segment in South American Cat Food Market
Specialty stores have emerged as both the dominant and fastest-growing distribution channel in the South American cat food market, commanding approximately 48% of the market share in 2024. These stores have established their leadership position by offering a comprehensive range of pet-related products across various price points, from economical to premium brands. The segment's success can be attributed to their unique value proposition of employing knowledgeable staff and veterinary specialists who provide expert guidance to pet owners, helping them make informed decisions about their cats' nutritional needs. The presence of veterinarians in these stores particularly drives the sales of specialized products like veterinary diets and premium pet foods. Major specialty store chains like Petz in Brazil are continuously expanding their presence, with plans to establish 30-40 new stores in 2024, demonstrating the segment's robust growth trajectory. The segment is projected to maintain its strong performance with an expected growth rate of approximately 14% from 2024 to 2029, driven by increasing consumer preference for specialized pet care products and personalized shopping experiences.
Remaining Segments in Distribution Channel
The remaining distribution channels in the South American cat food market include supermarkets/hypermarkets, online channels, convenience stores, and other specialized outlets. Supermarkets and hypermarkets serve as crucial distribution points, offering the convenience of purchasing cat food alongside regular household items. The online channel has gained significant traction, particularly following the digital transformation in retail, offering convenience and wide product selection through platforms like Amazon and specialized pet e-commerce sites. Convenience stores cater to emergency purchases and immediate needs with their extended operating hours and accessibility. Other channels, including veterinary clinics and pet care centers, play a vital role in distributing specialized pet food products and maintaining direct relationships with pet owners.
South America Cat Food Market Geography Segment Analysis
Cat Food Market in Brazil
Brazil dominates the South American cat food market, commanding approximately 58% of the regional market share in 2024. The country's market leadership is primarily driven by its substantial cat population, which has created a robust demand for diverse cat feed products. The market is characterized by a strong presence of both domestic and international manufacturers who have established extensive distribution networks across urban and rural areas. Brazilian consumers are increasingly gravitating towards premium and super-premium feline food products, reflecting a growing trend of pet humanization. The country's retail landscape for cat food is highly developed, with specialty pet stores, supermarkets, and e-commerce platforms offering a wide range of products. Notably, the country has witnessed significant investments in manufacturing facilities and research centers, strengthening its position as a regional hub for cat food production. The market is also seeing increased demand for specialized products such as veterinary diets and natural ingredient-based formulations, catering to evolving consumer preferences.
Cat Food Market in Argentina
Argentina's cat food market is projected to experience robust growth at approximately 15% CAGR from 2024 to 2029. The market's dynamic growth is fueled by increasing pet ownership rates and a strong trend toward premium product adoption. The country's retail infrastructure for pet food has undergone significant modernization, with specialty stores and veterinary clinics playing a crucial role in product distribution. Argentine consumers are showing increased interest in specialized nutrition solutions, particularly in urban areas where pet humanization trends are most pronounced. The market has witnessed substantial product innovations, particularly in natural and organic cat food segments, reflecting changing consumer preferences. Local manufacturers are expanding their production capabilities and introducing new product lines to meet the growing demand. The country's veterinary community has been instrumental in driving awareness about proper pet nutrition, influencing consumer choices towards higher-quality cat food products. The e-commerce channel has emerged as a significant distribution platform, offering convenience and wider product accessibility to consumers.
Cat Food Market in Chile
Chile's cat food market exhibits strong potential within South America, characterized by sophisticated consumer preferences and a well-developed retail infrastructure. The country stands out for its high rate of premium product adoption, particularly in urban areas where pet owners demonstrate strong purchasing power. Chilean retailers have successfully implemented omnichannel strategies, combining traditional brick-and-mortar stores with digital platforms to enhance customer reach. The market has witnessed significant developments in specialized nutrition segments, with increasing demand for functional and therapeutic cat food products. Local veterinarians play a crucial role in shaping consumer choices, particularly in the prescription diet segment. The country's regulatory environment supports product innovation while maintaining high-quality standards, attracting investments from both domestic and international manufacturers. Chilean consumers show strong interest in natural and organic products, driving manufacturers to expand their premium product portfolios.
Cat Food Market in Other Countries
The cat food market in other South American countries, including Paraguay, Uruguay, Peru, Colombia, and Venezuela, demonstrates varying degrees of development and growth potential. These markets are characterized by increasing pet ownership rates and growing awareness of proper pet nutrition. The retail landscape in these countries is evolving, with traditional pet shops coexisting alongside modern retail formats and emerging e-commerce platforms. Consumer preferences vary significantly across these markets, influenced by local economic conditions and cultural attitudes toward pet care. International manufacturers are increasingly targeting these markets through customized product offerings and marketing strategies. The veterinary community plays a vital role in educating pet owners about proper nutrition, particularly in urban areas. These markets show promising potential for growth, particularly in the premium segment, as disposable incomes rise and pet humanization trends strengthen. Local distribution networks are becoming more sophisticated, improving product accessibility across different regions.

Competitive Landscape
Top Companies in South America Cat Food Market
The South American cat food market is characterized by intense competition and continuous innovation among major players. Companies are heavily investing in research and development to introduce premium products with natural ingredients, specialized formulations for different life stages, and therapeutic diets addressing specific health conditions. Operational agility is demonstrated through the establishment of regional manufacturing facilities and distribution networks, particularly in Brazil and Argentina, to ensure efficient market penetration and product availability. Strategic partnerships with research institutes, veterinary clinics, and e-commerce platforms have become crucial for market expansion and customer reach. Companies are also focusing on expanding their production capacities, with significant investments in new manufacturing facilities and technology upgrades to meet the growing demand for wet pet food, treats, and specialized cat nutrition products.
Market Dominated by Global-Local Player Mix
The South American cat food market exhibits a consolidated structure with a mix of global conglomerates and regional specialists. Global players like Mars Incorporated, Nestlé Purina, and General Mills leverage their extensive research capabilities, established brand portfolios, and international experience to maintain strong market positions. Meanwhile, regional players such as PremieRpet and BRF Global compete effectively by capitalizing on their local market knowledge, established distribution networks, and ability to cater to regional preferences and price points.
The market has witnessed significant merger and acquisition activities as companies seek to strengthen their market presence and expand their product portfolios. Global players have been actively acquiring regional companies to gain immediate market access and local manufacturing capabilities, while regional players are consolidating their positions through strategic acquisitions of smaller pet food manufacturers and distributors. This trend has led to increased market concentration, with the top players controlling a substantial portion of the market share.
Innovation and Distribution Key to Growth
Success in the South American cat food market increasingly depends on companies' ability to innovate and adapt to changing consumer preferences. Incumbents can maintain and expand their market share by investing in premium product development, particularly in wet food and treats categories, while strengthening their relationships with veterinarians and specialty retailers. Companies must also focus on developing strong e-commerce capabilities and expanding their presence in specialty stores, as these channels continue to gain importance in product distribution.
For contenders looking to gain ground, the key lies in identifying and exploiting niche market segments while building strong regional distribution networks. Companies need to focus on developing products that cater to specific regional preferences and price points, while also investing in marketing and brand-building activities. The regulatory environment, particularly in Brazil, requires companies to maintain strict quality standards and obtain necessary certifications, creating entry barriers for new players. However, the growing trend of pet humanization and increasing pet ownership presents opportunities for companies that can effectively differentiate their products and establish strong relationships with key stakeholders in the market. Additionally, the demand for specialized cat feed is rising as consumers seek products that offer specific health benefits for their pets.
South America Cat Food Industry Leaders
ADM
BRF Global
Mars Incorporated
Nestle (Purina)
PremieRpet
- *Disclaimer: Major Players sorted in no particular order


Recent Industry Developments
- July 2023: Hill's Pet Nutrition introduced its new MSC (Marine Stewardship Council) certified pollock and insect protein products for pets with sensitive stomachs and skin lines. They contain vitamins, omega-3 fatty acids, and antioxidants.
- May 2023: Nestle Purina launched new cat treats under the Friskies "Friskies Playfuls - treats" brand. These treats are round in shape and are available in chicken and liver and salmon and shrimp flavors for adult cats.
- March 2023: PremieRpet launched a line of superpremium, "Protein-packed" meal toppers/treats for dogs and cats under the brand Natoo. These are produced at PremieRpet's facility in Brazil.


South America Cat Food Market Report Scope
Food, Pet Nutraceuticals/Supplements, Pet Treats, Pet Veterinary Diets are covered as segments by Pet Food Product. Convenience Stores, Online Channel, Specialty Stores, Supermarkets/Hypermarkets are covered as segments by Distribution Channel. Argentina, Brazil are covered as segments by Country.| Food | By Sub Product | Dry Pet Food | By Sub Dry Pet Food | Kibbles |
| Other Dry Pet Food | ||||
| Wet Pet Food | ||||
| Pet Nutraceuticals/Supplements | By Sub Product | Milk Bioactives | ||
| Omega-3 Fatty Acids | ||||
| Probiotics | ||||
| Proteins and Peptides | ||||
| Vitamins and Minerals | ||||
| Other Nutraceuticals | ||||
| Pet Treats | By Sub Product | Crunchy Treats | ||
| Dental Treats | ||||
| Freeze-dried and Jerky Treats | ||||
| Soft & Chewy Treats | ||||
| Other Treats | ||||
| Pet Veterinary Diets | By Sub Product | Diabetes | ||
| Digestive Sensitivity | ||||
| Oral Care Diets | ||||
| Renal | ||||
| Urinary tract disease | ||||
| Obesity Diets | ||||
| Derma Diets | ||||
| Other Veterinary Diets |
| Convenience Stores |
| Online Channel |
| Specialty Stores |
| Supermarkets/Hypermarkets |
| Other Channels |
| Brazil |
| Argentina |
| Rest of South America |
| Pet Food Product | Food | By Sub Product | Dry Pet Food | By Sub Dry Pet Food | Kibbles |
| Other Dry Pet Food | |||||
| Wet Pet Food | |||||
| Pet Nutraceuticals/Supplements | By Sub Product | Milk Bioactives | |||
| Omega-3 Fatty Acids | |||||
| Probiotics | |||||
| Proteins and Peptides | |||||
| Vitamins and Minerals | |||||
| Other Nutraceuticals | |||||
| Pet Treats | By Sub Product | Crunchy Treats | |||
| Dental Treats | |||||
| Freeze-dried and Jerky Treats | |||||
| Soft & Chewy Treats | |||||
| Other Treats | |||||
| Pet Veterinary Diets | By Sub Product | Diabetes | |||
| Digestive Sensitivity | |||||
| Oral Care Diets | |||||
| Renal | |||||
| Urinary tract disease | |||||
| Obesity Diets | |||||
| Derma Diets | |||||
| Other Veterinary Diets | |||||
| Distribution Channel | Convenience Stores | ||||
| Online Channel | |||||
| Specialty Stores | |||||
| Supermarkets/Hypermarkets | |||||
| Other Channels | |||||
| Geography | Brazil | ||||
| Argentina | |||||
| Rest of South America | |||||


Market Definition
- FUNCTIONS - Pet foods are usually intended to provide complete and balanced nutrition to the pet but are primarily used as functional products. The scope includes the food and supplements consumed by pets including veterinary diets. Supplements/nutraceuticals that are directly supplied to pets are considered within the scope.
- RESELLERS - Companies engaged in reselling of pet food without value addition have been excluded from the market scope, in order to avoid double counting.
- END CONSUMERS - Pet owners are considered to be the end-consumers in the market studied.
- DISTRIBUTION CHANNELS - Supermarkets/hypermarkets, specialty stores, convenience stores, online channels and other channels are considered within the scope. The stores which are exclusively providing pet related basic and custom products are considered within the scope of specialty stores.
| Keyword | Definition |
|---|---|
| Pet Food | The scope of pet food includes the food that is eatable by pets including food, treats, veterinary diets, and nutraceuticals/supplements. |
| Food | Food is animal feed intended for consumption by pets. It is formulated to provide essential nutrients and meet the dietary needs of various types of pets, including dogs, cats, and other animals. These are generally segmented into dry and wet pet foods. |
| Dry Pet Food | Dry pet foods may be extruded/baked (kibbles) or flaked. They have a lower moisture content, typically around 12-20%. |
| Wet Pet Food | Wet pet food, also known as canned pet food or moist pet food, generally has a higher moisture content compared to dry pet food, often ranging from 70-80%. |
| Kibbles | Kibbles are dry, processed pet food in small, bite-sized pieces or pellets. They are specifically formulated to provide balanced nutrition for various domestic animals, such as dogs, cats, and other animals. |
| Treats | Pet Treats are special food items or rewards given to pets, to show affection, and encourage good behavior. They are especially used during training. Pet treats are made from various combinations of meat or meat-derived materials with other ingredients. |
| Dental Treats | Pet dental treats are specialized treats that are formulated to promote good oral hygiene in pets. |
| Crunchy Treats | It is a type of pet treat that has a firm and crispy texture which can be a good source of nutrition for pets. |
| Soft and chewy treats | Soft and Chewy pet treats are a type of pet food product that is formulated to be easy to chewy and digest. They are usually made from soft and pliable ingredients, such as meat, poultry, or vegetables, that have been blended and formed into bite-sized pieces or strips. |
| Freeze-dried & Jerky Treats | Freeze-dried and jerky treats are snacks given to pets, that are prepared through a special preservation process, without damaging the nutritional content, resulting in long-lasting, nutrient-rich treats. |
| Urinary Tract Disease Diets | These are commercial diets that are specifically formulated to promote urinary health and reduce the risk of urinary tract infections and other urinary problems. |
| Renal Diets | These are specialized pet foods formulated to support the health of pets with kidney disease or renal insufficiency. |
| Digestive Sensitivity Diets | Digestive-sensitive diets are specially formulated to meet the nutritional needs of pets with digestive issues such as food intolerances, allergies, and sensitivities. These diets are designed to be easily digestible and to reduce the symptoms of digestive problems in pets. |
| Oral Care Diets | Oral care diets for pets are specially formulated diets produced to promote oral health and hygiene in pets. |
| Grain-Free Pet Food | Pet food that does not contain common grains like wheat, corn, or soy. Grain-free diets are often preferred by pet owners seeking alternative options or if their pets have specific dietary sensitivities. |
| Premium Pet Food | High-quality pet food formulated with superior ingredients often offers additional nutritional benefits compared to standard pet food. |
| Natural Pet Food | Pet food made from natural ingredients, with minimal processing and without artificial preservatives. |
| Organic Pet Food | Pet food is produced using organic ingredients, free from synthetic pesticides, hormones, and genetically modified organisms (GMOs). |
| Extrusion | A manufacturing process used to produce dry pet food, where ingredients are cooked, mixed, and shaped under high pressure and temperature. |
| Other Pets | Other pets include birds, fish, rabbits, hamsters, ferrets, and reptiles. |
| Palatability | The taste, texture, and aroma of pet food influence its appeal and acceptance by pets. |
| Complete and Balanced Pet Food | Pet food that provides all essential nutrients in appropriate proportions to meet the nutritional needs of pets without additional supplementation. |
| Preservatives | These are the substances that are added to pet food to extend its shelf life and prevent spoilage. |
| Nutraceuticals | Food products that offer health benefits beyond basic nutrition, often contain bioactive compounds with potential therapeutic effects. |
| Probiotics | Live beneficial bacteria that promote a healthy balance of gut flora, supporting digestive health and immune function in pets. |
| Antioxidants | Compounds that help neutralize harmful free radicals in the body, promoting cellular health and supporting the immune system in pets. |
| Shelf-Life | The duration of which pet food remains safe and nutritionally viable for consumption after its production date. |
| Prescription diet | Specialized pet food formulated to address specific medical conditions under veterinary supervision. |
| Allergen | A substance that can cause allergic reactions in some pets, leading to food allergies or sensitivities. |
| Canned food | Wet pet food that is packed in cans and contains higher moisture content than dry food. |
| Limited ingredient diet (LID) | Pet food formulated with a reduced number of ingredients to minimize potential allergens. |
| Guaranteed Analysis | The minimum or maximum levels of certain nutrients present in pet food. |
| Weight management | Pet food designed to help pets maintain a healthy weight or support weight loss efforts. |
| Other Nutraceuticals | It includes prebiotics, antioxidants, digestive fiber, enzymes, essential oils and herbs. |
| Other Veterinary Diets | It includes weight management diets, skin and coat health, cardiac care, and joint care. |
| Other Treats | It includes rawhides, mineral blocks, lickables, and catnips. |
| Other Dry Foods | It includes cereal flakes, mixers, meal toppers, freeze-dried foods, and air-dried foods. |
| Other Animals | It includes birds, fish, reptiles, and small animals (rabbits, ferrets, hamsters). |
| Other Distribution Channels | It includes veterinary clinics, local unregulated stores, and feed and farm stores. |
| Proteins and Peptides | Proteins are large molecules composed of basic units called amino acids which help in the growth and development of pets. Peptides are the short string of 2 to 50 amino acids. |
| Omega-3 fatty acids | Omega-3 fatty acids are essential polyunsaturated fats that play a crucial role in the overall health and well-being of Pets |
| Vitamins | Vitamins are the essential organic compounds that are essential for vital physiological functioning. |
| Minerals | Minerals are naturally occurring inorganic substances that are essential for various physiological functions in pets. |
| CKD | Chronic Kidney Disease |
| DHA | Docosahexaenoic Acid |
| EPA | Eicosapentaenoic Acid |
| ALA | Alpha-linolenic Acid |
| BHA | Butylated Hydroxyanisol |
| BHT | Butylated Hydroxytoluene |
| FLUTD | Feline Lower Urinary Tract Disease |


Research Methodology
Mordor Intelligence follows a four-step methodology in all our reports.
- Step-1: IDENTIFY KEY VARIABLES: In order to build a robust forecasting methodology, the variables and factors identified in Step-1 are tested against available historical market numbers. Through an iterative process, the variables required for market forecast are set and the model is built on the basis of these variables.
- Step-2: Build a Market Model: Market-size estimations for the forecast years are in nominal terms. Inflation is not a part of the pricing, and the average selling price (ASP) is kept constant throughout the forecast period.
- Step-3: Validate and Finalize: In this important step, all market numbers, variables and analyst calls are validated through an extensive network of primary research experts from the market studied. The respondents are selected across levels and functions to generate a holistic picture of the market studied.
- Step-4: Research Outputs: Syndicated Reports, Custom Consulting Assignments, Databases & Subscription Platforms


