South Africa Pet Food Market Size and Share
Market Overview
| Study Period | 2018 - 2031 |
|---|---|
| Forecast Data Period | 2026 - 2031 |
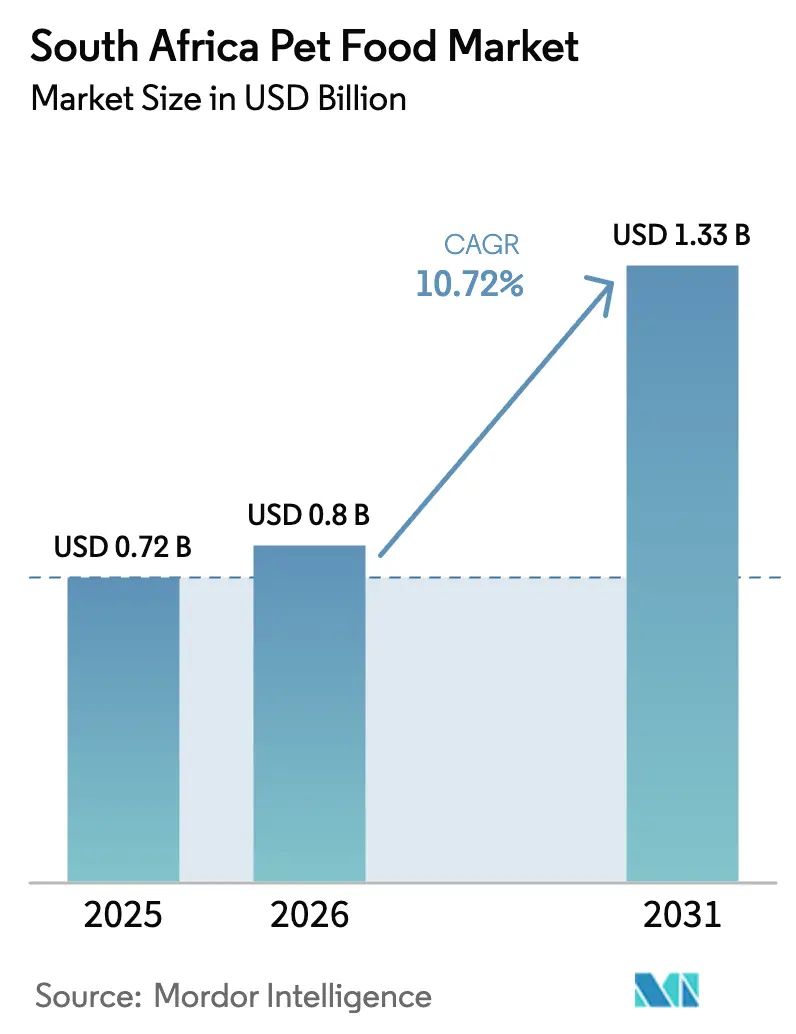
| Base Year Market Size (2025) | USD 0.72 Billion |
| Market Size (2026) | USD 0.8 Billion |
| Market Size (2031) | USD 1.33 Billion |
| Growth Rate (2026 - 2031) | 10.72% CAGR |
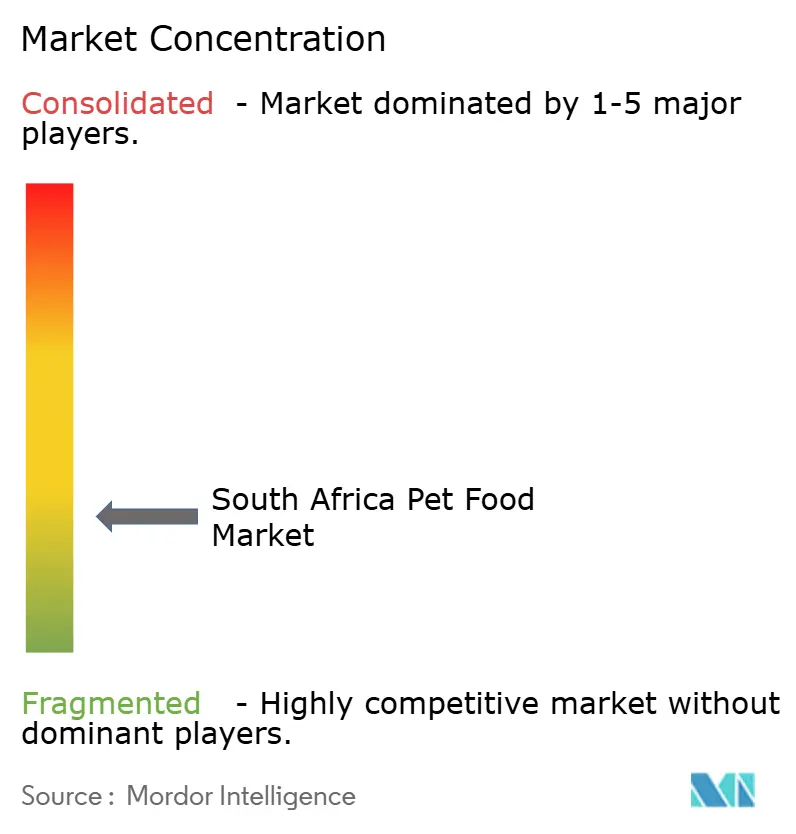
| Market Concentration | Low |
Major Players *Disclaimer: Major Players sorted in no particular order Image © Mordor Intelligence. Reuse requires attribution under CC BY 4.0. | |
South Africa Pet Food Market Analysis by Mordor Intelligence
The South Africa pet food market size was valued at USD 0.72 billion in 2025 and estimated to grow from USD 0.80 billion in 2026 to reach USD 1.33 billion by 2031, at a CAGR of 10.72% during the forecast period (2026-2031). Growth is anchored in a well-established pet culture, the country’s expanding middle-income group, and sustained premiumization. Food products hold the largest revenue share, private-label penetration rises in grocery chains, and e-commerce partnerships accelerate same-day fulfillment. Local manufacturers invest in solar-powered plants and novel proteins to protect margins against grain price volatility. Regulatory barriers under Act 36 of 1947 safeguard quality and deter rapid foreign entry, further consolidating domestic advantages.
Key Report Takeaways
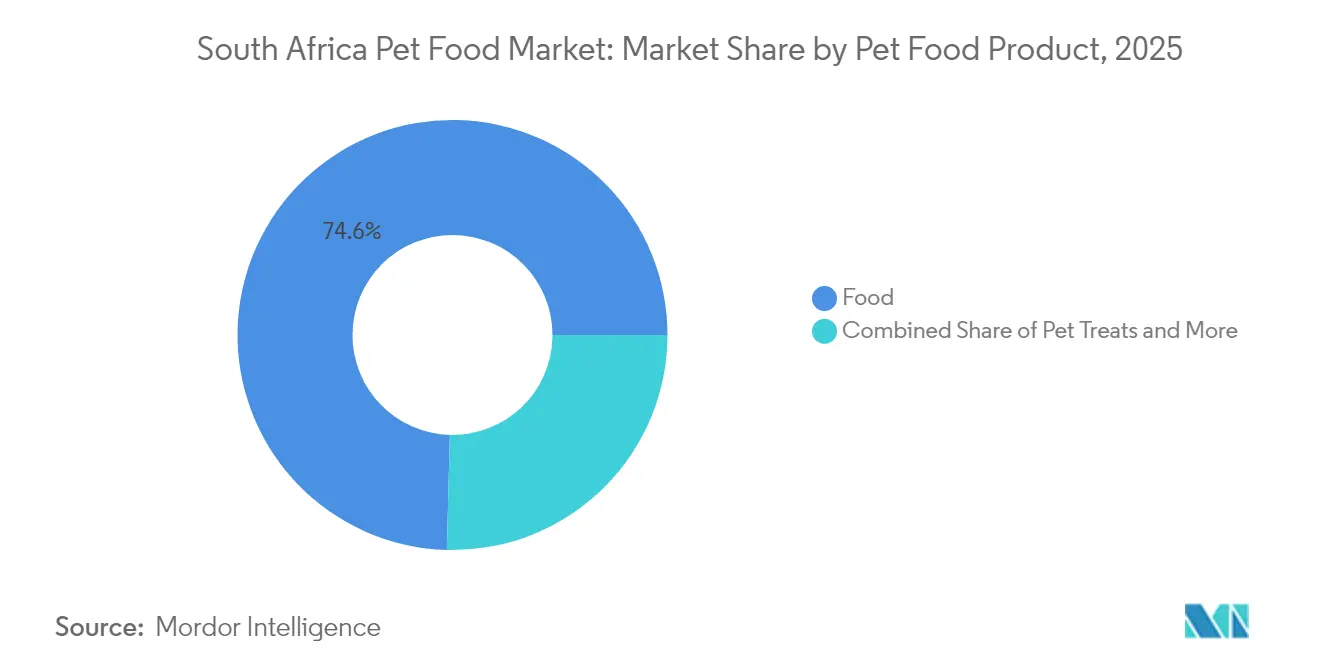
- By pet food product, food commanded 74.58% of the South Africa pet food market size in 2025; and forecast to expand at an 11.52% CAGR to 2031.
- By pets, dogs led with 79.05% of the South Africa pet food market share in 2025, while same segment recorded the highest projected 11.34% CAGR through 2031.
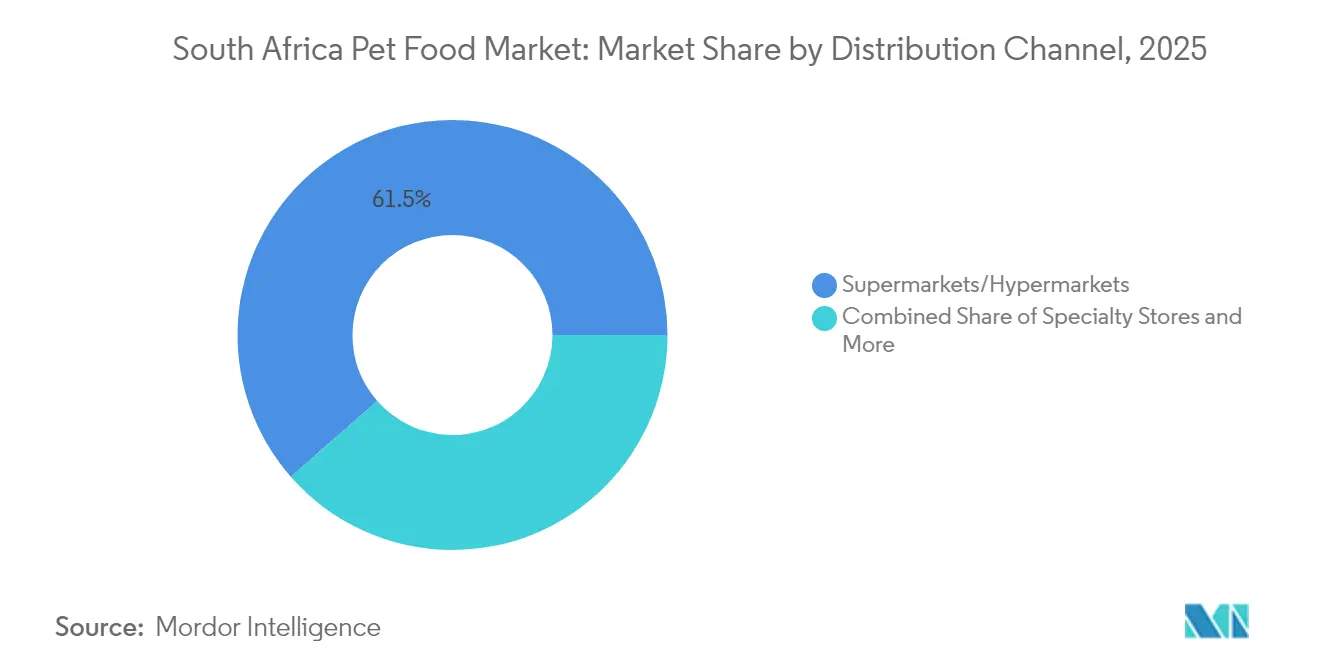
- By distribution channel, supermarkets and hypermarkets captured 61.45% share in 2025, while Specialty Stores recorded the fastest growth rate by 12.25 CAGR through 2031.
Note: Market size and forecast figures in this report are generated using Mordor Intelligence’s proprietary estimation framework, updated with the latest available data and insights as of 2026.
South Africa Pet Food Market Trends and Insights
Drivers Impact Analysis*
| Driver | (~) % Impact on CAGR Forecast | Geographic Relevance | Impact Timeline |
|---|---|---|---|
| Rising pet humanization and premiumization | +2.8% | National, with early gains in Gauteng, Western Cape, KwaZulu-Natal | Medium term (2-4 years) |
| E-commerce penetration and same-day fulfillment | +1.9% | Urban centers, expanding to secondary cities | Short term (≤ 2 years) |
| Veterinarian endorsement of therapeutic diets | +1.5% | National, concentrated in metropolitan veterinary networks | Long term (≥ 4 years) |
| Private-label growth at grocery majors | +1.2% | National, led by Shoprite, Pick n Pay, Woolworths expansion | Medium term (2-4 years) |
| Insect-protein adoption to hedge meat inflation | +0.9% | Western Cape innovation hubs, scaling nationally | Long term (≥ 4 years) |
| Subscription auto-replenish services scaling | +0.7% | Urban Gauteng, Western Cape early adopters | Short term (≤ 2 years) |
| Source: Mordor Intelligence | |||
Rising Pet Humanization and Premiumization
Pet humanization fundamentally reshapes purchasing decisions as 85% of South African pet owners view pet nutrition as equally important to human health, driving demand for functional ingredients targeting aging, joint mobility, and digestive wellness. Montego Pet Nutrition's launch of 49 new products in 2024, including PURE Collagen Protein formulations with hydrolyzed collagen for joint stability, exemplifies this trend toward human-grade nutritional sophistication[1]Source: Montego Pet Nutrition, “About Us,” montegopetnutrition.com. This trend accelerates adoption of specialized diets addressing specific health concerns, from hypoallergenic formulations using novel proteins like springbok and impala to therapeutic nutrition targeting renal, urinary, and diabetic conditions. Consumer education through veterinary channels reinforces premiumization, with branded, scientifically-backed ingredients influencing more than half of dog and cat owners in purchase decisions.
E-commerce Penetration and Same-Day Fulfillment
Digital transformation accelerates through strategic partnerships, exemplified by Petshop Science's May 2025 integration with Sixty60 for same-day delivery across 143 stores, capitalizing on urban consumers' convenience expectations while expanding rural accessibility[2]Source: Shoprite, “Sixty60 Partnership,” shoprite.co.za. E-commerce platforms enable smaller manufacturers like Maneli Pets to access national markets without extensive retail partnerships, democratizing market entry while providing consumers with broader product selections. Mobile commerce integration through platforms like Zulzi and Yebo Fresh extends reach into lower-income areas, supporting market expansion beyond traditional urban centers.
Veterinarian Endorsement of Therapeutic Diets
Veterinary channel expansion drives therapeutic diet adoption as specialized nutrition addresses South Africa's aging pet population and rising awareness of preventive care benefits. Royal Canin and Hill's Pet Nutrition maintain strong veterinary relationships, with ePETstore claiming exclusive online prescription diet sales, creating controlled distribution that supports premium pricing and professional guidance[3]Source: ePETstore, “Prescription Diets,” epetstore.co.za. Clinical guidance boosts acceptance of novel proteins from game meat and aligns with South Africa’s Game Meat Strategy that targets new conservation jobs by 2030. Microbiome-focused formulations featuring probiotics address prevalent digestive sensitivities.
Private-Label Growth at Grocery Majors
Retail consolidation empowers grocery majors to develop private-label pet food offerings that capture margin while providing value-conscious consumers with affordable alternatives to branded products. Shoprite's support for small manufacturers like Maneli Pets through its Petshop Science division demonstrates how retailers leverage local production capabilities to create exclusive products while supporting supplier diversity. Private-label growth benefits from consumer willingness to try new products, with 48% of South Africans considering cheaper brand alternatives amid economic pressures, yet maintaining quality expectations that require sophisticated formulation and manufacturing capabilities. The trend toward private-label premiumization enables retailers to offer functional ingredients and specialized nutrition at accessible price points, democratizing access to advanced pet nutrition previously limited to premium brands.
Restraints Impact Analysis*
| Restraint | (~) % Impact on CAGR Forecast | Geographic Relevance | Impact Timeline |
|---|---|---|---|
| Wheat-price volatility and feed-grain shortages | -1.8% | National, with acute impact on inland manufacturing | Short term (≤ 2 years) |
| Shelf-space pay-to-play costs in supermarkets | -1.2% | National retail chains, affecting smaller brands | Medium term (2-4 years) |
| Import-licensing bottlenecks for novel ingredients | -0.9% | National, impacting innovation-focused manufacturers | Long term (≥ 4 years) |
| Intensifying price rivalry from homemade and raw diets | -0.7% | Urban areas with higher disposable income | Medium term (2-4 years) |
| Source: Mordor Intelligence | |||
Wheat-Price Volatility and Feed-Grain Shortages
Maize surged 2024, with yellow maize feed at ZAR 4 146 per metric ton (USD 224). The volatility extends beyond local production as global grain markets face disruption, with South Africa's import dependence for wheat and certain feed grains exposing manufacturers to currency fluctuation risks amid a weakening rand. Manufacturers respond through ingredient diversification, with companies like Montego exploring alternative carbohydrate sources including sweet potato and pea-based formulations to reduce reliance on volatile grain markets. The cost pressures intensify competitive dynamics as manufacturers must balance ingredient quality with affordability, particularly challenging premium positioning when input costs rise faster than consumer willingness to pay.
Shelf-Space Pay-to-Play Costs in Supermarkets
Retail consolidation increases listing fees and promotional costs as supermarket chains leverage their market power to extract higher margins from pet food manufacturers, particularly challenging smaller brands seeking national distribution. Shoprite's expansion to 143 Petshop Science stores creates additional shelf-space competition while requiring significant promotional investments from manufacturers to secure prominent positioning and drive trial among price-sensitive consumers. The concentration of retail power among major chains creates barriers to entry for new brands while enabling retailers to demand exclusive products, private-label partnerships, or preferential pricing that can undermine manufacturer profitability and limit consumer choice.
*Our forecasts treat driver/restraint impacts as directional, not additive. The impact forecasts reflect baseline growth, mix effects, and variable interactions.
Segment Analysis
By Pet Food Product: Food Dominance Drives Innovation
Food accounted for 74.58% of the South Africa pet food market in 2025 and retained an 11.52% CAGR outlook to 2031, underscoring its daily-use centrality. Dry kibble leads for convenience, though wet offerings gain favor among owners of senior animals requiring hydration. Pet nutraceuticals and supplements emerge fastest by value, reflecting consumer shift toward preventive health. Veterinary diets command premium pricing by targeting renal, joint, and metabolic conditions, and their share of the South Africa pet food market size is projected to climb steadily. Manufacturers integrate glucosamine, chondroitin, and hydrolyzed collagen, transforming meal occasions into health interventions.
Continuous product launches sustain variety. Limited-ingredient recipes with single carbohydrates such as rice appeal to sensitivity management, while game proteins like springbok offer hypoallergenic alternatives that support sustainable wildlife utilization. FSSC 22000 certification underpins export growth, reinforcing consumer trust. With insect protein introductions, manufacturers hedge grain volatility and align with circular economy objectives.


By Pets: Dogs Lead Market Evolution
Dogs held 79.05% of the South Africa pet food market in 2025, benefitting from larger consumption volumes per animal and higher emotional engagement that justifies premium purchases, while same segment recorded the highest projected 11.34% CAGR through 2031. Breed-specific formulations cater to size-related joint issues, while age-focused lines address senior conditions such as cognitive decline. The canine segment’s share of the South Africa pet food market size remains dominant through the forecast period. Cats, though smaller in number driven by specialized taurine-rich diets and indoor formulas. Exotic and small animal nutrition remains niche, yet targeted product ranges in aquatics and avian feed offer incremental growth.
Working dog nutrition tailored for security, conservation, and farm roles demands calorie-dense diets with digestive stability. Multi-pet household growth encourages bundled offerings, fostering cross-category loyalty. Manufacturers leverage such dynamics to diversify portfolios without diluting brand equity.
By Distribution Channel: Specialty Growth Challenges Traditional Retail
Supermarkets and hypermarkets captured 61.45% of the South Africa pet food market share in 2025, leveraging price competitiveness and one-stop convenience. Specialty outlets record a faster 12.25% CAGR as shoppers seek expert advice and curated assortments. Woolworths’ Absolute Pets acquisition combines corporate scale with specialist credibility, enhancing margin capture from premium consumers. Online marketplaces extend reach and offer same-day delivery, cementing convenience leadership.
Convenience stores gain relevance for emergency purchases, while subscription services support steady demand flows and higher lifetime value. Veterinary clinics expand point-of-sale areas for prescription lines, reinforcing professional guidance. Omnichannel strategies blend in-store experience with digital engagement, aiming for seamless inventory visibility and personalized promotions.
Geography Analysis
The South Africa pet food market remains the continent’s most advanced ecosystem, holding a major percentage of Africa’s pet food export value in 2021. Gauteng, the economic hub, records the largest consumer spend on premium recipes and same-day delivery. Western Cape leads innovation through insect protein and game meat integration, drawing on conservation programs. KwaZulu-Natal follows with strong urban demand and port infrastructure supporting imports of specialty additives.
Regional income disparities shape product preferences. Urban centers favor therapeutic and functional diets, whereas rural customers prioritize affordability, sustaining the volume flow of economy kibble. Load-shedding varies by province; firms in high-disruption zones invest in solar arrays, securing production and building sustainability credentials. Export corridors leverage port facilities in Durban and Cape Town, enabling reach into Namibia, Botswana, and Asian markets such as India and Malaysia that together absorb over half of the outbound volume.
Secondary cities benefit from expanding retail footprints and improved road links, unlocking new demand pockets. Government incentives for renewable energy adoption among manufacturers reinforce resilience. As personal debt reaches 73% of disposable income nationally, value segments retain relevance, and aspirational middle-income households continue trading up, sustaining premium growth.
Competitive Landscape
The South Africa pet food market exhibits low concentration with established local players competing alongside international brands, creating dynamic competitive tensions between scale advantages and local market knowledge. Montego Pet Nutrition leverages its position as Africa's largest independent pet food manufacturer to expand internationally, celebrating 25 years in operation during 2025 while achieving distribution across 21 countries and launching 49 new products in 2024.
Multinationals such as Mars and Nestlé compete on brand trust, while Nutreco’s 2025 acquisition of AECI’s premix unit deepens technical capabilities. Woolworths leverages Absolute Pets to merge grocery reach with specialist know-how. The competitive landscape intensifies through strategic acquisitions, exemplified by Woolworths' purchase of Absolute Pets and Nutreco's acquisition of African Explosives and Chemical Industries (AECI) Animal Health's feed premix business, demonstrating how established players seek vertical integration and specialized capabilities to strengthen market positions.
Innovation differentiates challengers: Maltento’s insect protein, Thokoman’s peanut-waste treats, and African BSF’s alternative protein open new formulation avenues. E-commerce data analytics refine assortment planning, with Takealot optimizing price ladders and inventory turnover. Regulatory lead times for new entrants shield incumbents, yet also compel ongoing R&D to justify shelf presence and pricing. E-commerce capabilities become competitive necessities as partnerships with delivery platforms and subscription service development enable direct customer relationships that bypass traditional retail margins while providing valuable consumer data for product development and marketing optimization.
South Africa Pet Food Industry Leaders
FARMINA PET FOODS
General Mills Inc.
Mars Incorporated
Nestle (Purina)
Hill's Pet Nutrition Inc. (Colgate-Palmolive Company)
- *Disclaimer: Major Players sorted in no particular order

Recent Industry Developments
- September 2025: Montego Pet Nutrition expanded US distribution for KAROO Wild antelope-based dog treats through partnership with Rio Grande Service Center, extending availability to Arizona, Colorado, New Mexico, Wyoming, and West Texas, bringing total US state coverage to over 22 states while positioning novel protein treats in the super-premium category.
- July 2023: Hill's Pet Nutrition introduced its new MSC (Marine Stewardship Council) certified pollock and insect protein products for pets with sensitive stomachs and skin lines. They contain vitamins, omega-3 fatty acids, and antioxidants.
- May 2023: Nestle Purina launched new cat treats under the Friskies "Friskies Playfuls - treats" brand. These treats are round in shape and are available in chicken and liver and salmon and shrimp flavors for adult cats.


South Africa Pet Food Market Report Scope
Food, Pet Nutraceuticals/Supplements, Pet Treats, Pet Veterinary Diets are covered as segments by Pet Food Product. Cats, Dogs are covered as segments by Pets. Convenience Stores, Online Channel, Specialty Stores, Supermarkets/Hypermarkets are covered as segments by Distribution Channel.| Food | By Sub Product | Dry Pet Food | By Sub Dry Pet Food | Kibbles |
| Other Dry Pet Food | ||||
| Wet Pet Food | ||||
| Pet Nutraceuticals/Supplements | By Sub Product | Milk Bioactives | ||
| Omega-3 Fatty Acids | ||||
| Probiotics | ||||
| Proteins and Peptides | ||||
| Vitamins and Minerals | ||||
| Other Nutraceuticals | ||||
| Pet Treats | By Sub Product | Crunchy Treats | ||
| Dental Treats | ||||
| Freeze-dried and Jerky Treats | ||||
| Soft and Chewy Treats | ||||
| Other Treats | ||||
| Pet Veterinary Diets | By Sub Product | Derma Diets | ||
| Diabetes | ||||
| Digestive Sensitivity | ||||
| Obesity Diets | ||||
| Oral Care Diets | ||||
| Renal | ||||
| Urinary tract disease | ||||
| Other Veterinary Diets |
| Cats |
| Dogs |
| Other Pets |
| Convenience Stores |
| Online Channel |
| Specialty Stores |
| Supermarkets/Hypermarkets |
| Other Channels |
| Pet Food Product | Food | By Sub Product | Dry Pet Food | By Sub Dry Pet Food | Kibbles |
| Other Dry Pet Food | |||||
| Wet Pet Food | |||||
| Pet Nutraceuticals/Supplements | By Sub Product | Milk Bioactives | |||
| Omega-3 Fatty Acids | |||||
| Probiotics | |||||
| Proteins and Peptides | |||||
| Vitamins and Minerals | |||||
| Other Nutraceuticals | |||||
| Pet Treats | By Sub Product | Crunchy Treats | |||
| Dental Treats | |||||
| Freeze-dried and Jerky Treats | |||||
| Soft and Chewy Treats | |||||
| Other Treats | |||||
| Pet Veterinary Diets | By Sub Product | Derma Diets | |||
| Diabetes | |||||
| Digestive Sensitivity | |||||
| Obesity Diets | |||||
| Oral Care Diets | |||||
| Renal | |||||
| Urinary tract disease | |||||
| Other Veterinary Diets | |||||
| Pets | Cats | ||||
| Dogs | |||||
| Other Pets | |||||
| Distribution Channel | Convenience Stores | ||||
| Online Channel | |||||
| Specialty Stores | |||||
| Supermarkets/Hypermarkets | |||||
| Other Channels | |||||


Market Definition
- FUNCTIONS - Pet foods are usually intended to provide complete and balanced nutrition to the pet but are primarily used as functional products. The scope includes the food and supplements consumed by pets including veterinary diets. Supplements/nutraceuticals that are directly supplied to pets are considered within the scope.
- RESELLERS - Companies engaged in reselling of pet food without value addition have been excluded from the market scope, in order to avoid double counting.
- END CONSUMERS - Pet owners are considered to be the end-consumers in the market studied.
- DISTRIBUTION CHANNELS - Supermarkets/hypermarkets, specialty stores, convenience stores, online channels and other channels are considered within the scope. The stores which are exclusively providing pet related basic and custom products are considered within the scope of specialty stores.
| Keyword | Definition |
|---|---|
| Pet Food | The scope of pet food includes the food that is eatable by pets including food, treats, veterinary diets, and nutraceuticals/supplements. |
| Food | Food is animal feed intended for consumption by pets. It is formulated to provide essential nutrients and meet the dietary needs of various types of pets, including dogs, cats, and other animals. These are generally segmented into dry and wet pet foods. |
| Dry Pet Food | Dry pet foods may be extruded/baked (kibbles) or flaked. They have a lower moisture content, typically around 12-20%. |
| Wet Pet Food | Wet pet food, also known as canned pet food or moist pet food, generally has a higher moisture content compared to dry pet food, often ranging from 70-80%. |
| Kibbles | Kibbles are dry, processed pet food in small, bite-sized pieces or pellets. They are specifically formulated to provide balanced nutrition for various domestic animals, such as dogs, cats, and other animals. |
| Treats | Pet Treats are special food items or rewards given to pets, to show affection, and encourage good behavior. They are especially used during training. Pet treats are made from various combinations of meat or meat-derived materials with other ingredients. |
| Dental Treats | Pet dental treats are specialized treats that are formulated to promote good oral hygiene in pets. |
| Crunchy Treats | It is a type of pet treat that has a firm and crispy texture which can be a good source of nutrition for pets. |
| Soft and chewy treats | Soft and Chewy pet treats are a type of pet food product that is formulated to be easy to chewy and digest. They are usually made from soft and pliable ingredients, such as meat, poultry, or vegetables, that have been blended and formed into bite-sized pieces or strips. |
| Freeze-dried & Jerky Treats | Freeze-dried and jerky treats are snacks given to pets, that are prepared through a special preservation process, without damaging the nutritional content, resulting in long-lasting, nutrient-rich treats. |
| Urinary Tract Disease Diets | These are commercial diets that are specifically formulated to promote urinary health and reduce the risk of urinary tract infections and other urinary problems. |
| Renal Diets | These are specialized pet foods formulated to support the health of pets with kidney disease or renal insufficiency. |
| Digestive Sensitivity Diets | Digestive-sensitive diets are specially formulated to meet the nutritional needs of pets with digestive issues such as food intolerances, allergies, and sensitivities. These diets are designed to be easily digestible and to reduce the symptoms of digestive problems in pets. |
| Oral Care Diets | Oral care diets for pets are specially formulated diets produced to promote oral health and hygiene in pets. |
| Grain-Free Pet Food | Pet food that does not contain common grains like wheat, corn, or soy. Grain-free diets are often preferred by pet owners seeking alternative options or if their pets have specific dietary sensitivities. |
| Premium Pet Food | High-quality pet food formulated with superior ingredients often offers additional nutritional benefits compared to standard pet food. |
| Natural Pet Food | Pet food made from natural ingredients, with minimal processing and without artificial preservatives. |
| Organic Pet Food | Pet food is produced using organic ingredients, free from synthetic pesticides, hormones, and genetically modified organisms (GMOs). |
| Extrusion | A manufacturing process used to produce dry pet food, where ingredients are cooked, mixed, and shaped under high pressure and temperature. |
| Other Pets | Other pets include birds, fish, rabbits, hamsters, ferrets, and reptiles. |
| Palatability | The taste, texture, and aroma of pet food influence its appeal and acceptance by pets. |
| Complete and Balanced Pet Food | Pet food that provides all essential nutrients in appropriate proportions to meet the nutritional needs of pets without additional supplementation. |
| Preservatives | These are the substances that are added to pet food to extend its shelf life and prevent spoilage. |
| Nutraceuticals | Food products that offer health benefits beyond basic nutrition, often contain bioactive compounds with potential therapeutic effects. |
| Probiotics | Live beneficial bacteria that promote a healthy balance of gut flora, supporting digestive health and immune function in pets. |
| Antioxidants | Compounds that help neutralize harmful free radicals in the body, promoting cellular health and supporting the immune system in pets. |
| Shelf-Life | The duration of which pet food remains safe and nutritionally viable for consumption after its production date. |
| Prescription diet | Specialized pet food formulated to address specific medical conditions under veterinary supervision. |
| Allergen | A substance that can cause allergic reactions in some pets, leading to food allergies or sensitivities. |
| Canned food | Wet pet food that is packed in cans and contains higher moisture content than dry food. |
| Limited ingredient diet (LID) | Pet food formulated with a reduced number of ingredients to minimize potential allergens. |
| Guaranteed Analysis | The minimum or maximum levels of certain nutrients present in pet food. |
| Weight management | Pet food designed to help pets maintain a healthy weight or support weight loss efforts. |
| Other Nutraceuticals | It includes prebiotics, antioxidants, digestive fiber, enzymes, essential oils and herbs. |
| Other Veterinary Diets | It includes weight management diets, skin and coat health, cardiac care, and joint care. |
| Other Treats | It includes rawhides, mineral blocks, lickables, and catnips. |
| Other Dry Foods | It includes cereal flakes, mixers, meal toppers, freeze-dried foods, and air-dried foods. |
| Other Animals | It includes birds, fish, reptiles, and small animals (rabbits, ferrets, hamsters). |
| Other Distribution Channels | It includes veterinary clinics, local unregulated stores, and feed and farm stores. |
| Proteins and Peptides | Proteins are large molecules composed of basic units called amino acids which help in the growth and development of pets. Peptides are the short string of 2 to 50 amino acids. |
| Omega-3 fatty acids | Omega-3 fatty acids are essential polyunsaturated fats that play a crucial role in the overall health and well-being of Pets |
| Vitamins | Vitamins are the essential organic compounds that are essential for vital physiological functioning. |
| Minerals | Minerals are naturally occurring inorganic substances that are essential for various physiological functions in pets. |
| CKD | Chronic Kidney Disease |
| DHA | Docosahexaenoic Acid |
| EPA | Eicosapentaenoic Acid |
| ALA | Alpha-linolenic Acid |
| BHA | Butylated Hydroxyanisol |
| BHT | Butylated Hydroxytoluene |
| FLUTD | Feline Lower Urinary Tract Disease |


Research Methodology
Mordor Intelligence follows a four-step methodology in all our reports.
- Step-1: IDENTIFY KEY VARIABLES: In order to build a robust forecasting methodology, the variables and factors identified in Step-1 are tested against available historical market numbers. Through an iterative process, the variables required for market forecast are set and the model is built on the basis of these variables.
- Step-2: Build a Market Model: Market-size estimations for the forecast years are in nominal terms. Inflation is not a part of the pricing, and the average selling price (ASP) is kept constant throughout the forecast period.
- Step-3: Validate and Finalize: In this important step, all market numbers, variables and analyst calls are validated through an extensive network of primary research experts from the market studied. The respondents are selected across levels and functions to generate a holistic picture of the market studied.
- Step-4: Research Outputs: Syndicated Reports, Custom Consulting Assignments, Databases & Subscription Platforms


